Como regla general, cuando necesita hacer algo de manera rápida y económica, no pensamos en la tolerancia a fallas y la escalabilidad de nuestra aplicación, que después de un tiempo necesariamente conlleva dolor. Las soluciones modernas le permiten resolver este problema rápida y fácilmente.
En el ejemplo de la transición de una aplicación monolítica a microservicios, intentaré mostrar todos los pros y los contras de cada enfoque. El artículo está dividido en tres partes:
- En la primera parte, consideraremos una aplicación monolítica en el marco web de Dash, es decir. La generación y visualización de datos estará en un solo lugar.
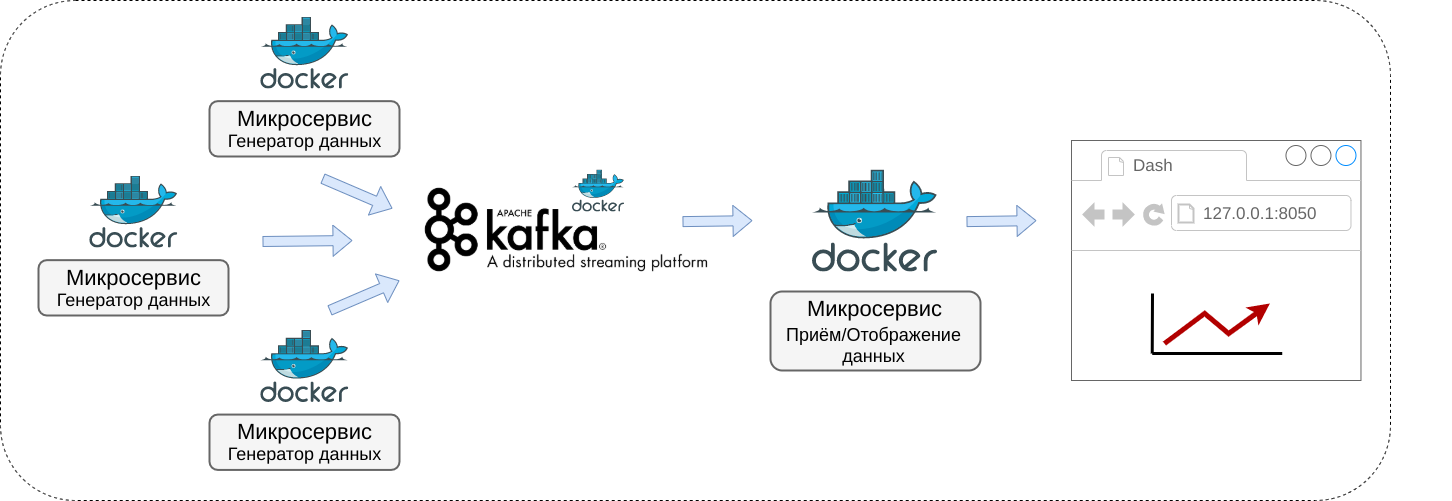
- La segunda parte está dedicada a la descomposición de una aplicación monolítica en microservicios, es decir. Un servicio se dedicará a la generación de datos, otro se mostrará y la comunicación entre ellos se establecerá a través del agente de mensajes Kafka.
- En la tercera parte, los microservicios se "empaquetarán" en contenedores Docker.
La aplicación final se verá como el diagrama a continuación.
Introducción
Para comprender mejor el ejemplo, es deseable tener al menos conocimientos básicos en Kafka y Docker, en mi opinión daré algunos cursos y artículos útiles:
github, .
1.
Dash (Plotly), , local_app. .
monolith.pyimport datetime
import dash
import dash_core_components as dcc
import dash_html_components as html
import plotly
from dash.dependencies import Input, Output
from pyorbital.orbital import Orbital
satellite = Orbital('TERRA')
external_stylesheets = ['https://codepen.io/chriddyp/pen/bWLwgP.css']
app = dash.Dash(__name__, external_stylesheets=external_stylesheets)
app.layout = html.Div(
html.Div([
html.H4('TERRA Satellite Live Feed'),
html.Div(id='live-update-text'),
dcc.Graph(id='live-update-graph'),
dcc.Interval(
id='interval-component',
interval=1*1000,
n_intervals=0
)
])
)
@app.callback(Output('live-update-text', 'children'),
[Input('interval-component', 'n_intervals')])
def update_metrics(n):
lon, lat, alt = satellite.get_lonlatalt(datetime.datetime.now())
style = {'padding': '5px', 'fontSize': '16px'}
return [
html.Span('Longitude: {0:.2f}'.format(lon), style=style),
html.Span('Latitude: {0:.2f}'.format(lat), style=style),
html.Span('Altitude: {0:0.2f}'.format(alt), style=style)
]
@app.callback(Output('live-update-graph', 'figure'),
[Input('interval-component', 'n_intervals')])
def update_graph_live(n):
satellite = Orbital('TERRA')
data = {
'time': [],
'Latitude': [],
'Longitude': [],
'Altitude': []
}
for i in range(180):
time = datetime.datetime.now() - datetime.timedelta(seconds=i*20)
lon, lat, alt = satellite.get_lonlatalt(
time
)
data['Longitude'].append(lon)
data['Latitude'].append(lat)
data['Altitude'].append(alt)
data['time'].append(time)
fig = plotly.tools.make_subplots(rows=2, cols=1, vertical_spacing=0.2)
fig['layout']['margin'] = {
'l': 30, 'r': 10, 'b': 30, 't': 10
}
fig['layout']['legend'] = {'x': 0, 'y': 1, 'xanchor': 'left'}
fig.append_trace({
'x': data['time'],
'y': data['Altitude'],
'name': 'Altitude',
'mode': 'lines+markers',
'type': 'scatter'
}, 1, 1)
fig.append_trace({
'x': data['Longitude'],
'y': data['Latitude'],
'text': data['time'],
'name': 'Longitude vs Latitude',
'mode': 'lines+markers',
'type': 'scatter'
}, 2, 1)
return fig
if __name__ == '__main__':
app.run_server(debug=True)
- . python pyorbital, ( - Terra (EOS AM-1)). Dash (Plotly) : 127.0.0.1:8050.
, — altitude, longitude latitude (, ), .. , , — .

( () )
:
:
- , , , , .. ( , ).
- / . , , , , .
2.
local_microservices_app, Kafka Docker, ( github Stephane Maarek)
, — backend (producer.py), Kafka, — frontend (consumer.py, graph_display.py) Kafka .
backend:
Producer ( ) Kafka ( 20 )
producer.pyfrom time import sleep
import datetime
from confluent_kafka import Producer
import json
from pyorbital.orbital import Orbital
satellite = Orbital('TERRA')
topic = 'test_topic'
producer = Producer({'bootstrap.servers': 'localhost:9092'})
def acked(err, msg):
if err is not None:
print("Failed to deliver message: {}".format(err))
else:
print("Produced record to topic {} partition [{}] @ offset {}"
.format(msg.topic(), msg.partition(), msg.offset()))
while True:
time = datetime.datetime.now()
lon, lat, alt = satellite.get_lonlatalt(time)
record_value = json.dumps({'lon':lon, 'lat': lat, 'alt': alt, 'time': str(time)})
producer.produce(topic, key=None, value=record_value, on_delivery=acked)
producer.poll()
sleep(1)
frontend:
Consumer ( ) MyKafkaConnect consumer.py, Kafka 180 ( , ) . Kafka.
(monolith.py) , , , MyKafkaConnect, .
consumer.pyimport datetime
from confluent_kafka import Consumer, TopicPartition
import json
from collections import deque
from time import sleep
class MyKafkaConnect:
def __init__(self, topic, group, que_len=180):
self.topic = topic
self.conf = {
'bootstrap.servers': 'localhost:9092',
'group.id': group,
'enable.auto.commit': True,
}
self.data = {
'time': deque(maxlen=que_len),
'Latitude': deque(maxlen=que_len),
'Longitude': deque(maxlen=que_len),
'Altitude': deque(maxlen=que_len)
}
consumer = Consumer(self.conf)
consumer.subscribe([self.topic])
self.partition = TopicPartition(topic=self.topic, partition=0)
low_offset, high_offset = consumer.get_watermark_offsets(self.partition)
if high_offset > que_len:
self.partition.offset = high_offset - que_len
else:
self.partition.offset = low_offset
consumer.assign([self.partition])
self.__update_que(consumer)
def __update_que(self, consumer):
try:
while True:
msg = consumer.poll(timeout=0.1)
if msg is None:
break
elif msg.error():
print('error: {}'.format(msg.error()))
break
else:
record_value = msg.value()
json_data = json.loads(record_value.decode('utf-8'))
self.data['Longitude'].append(json_data['lon'])
self.data['Latitude'].append(json_data['lat'])
self.data['Altitude'].append(json_data['alt'])
self.data['time'].append(datetime.datetime.strptime(json_data['time'], '%Y-%m-%d %H:%M:%S.%f'))
self.partition.offset += 1
finally:
consumer.close()
def get_graph_data(self):
consumer = Consumer(self.conf)
consumer.subscribe([self.topic])
consumer.get_watermark_offsets(self.partition)
consumer.assign([self.partition])
self.__update_que(consumer)
o = {key: list(value) for key, value in self.data.items()}
return o
def get_last(self):
lon = self.data['Longitude'][-1]
lat = self.data['Latitude'][-1]
alt = self.data['Altitude'][-1]
return lon, lat, alt
if __name__ == '__main__':
connect = MyKafkaConnect(topic='test_topic', group='test_group')
while True:
test = connect.get_graph_data()
print('number of messages:', len(test['time']),
'unique:', len(set(test['time'])),
'time:', test['time'][-1].second)
sleep(0.1)
graph_display.pyimport datetime
import dash
import dash_core_components as dcc
import dash_html_components as html
import plotly
from dash.dependencies import Input, Output
from consumer import MyKafkaConnect
connect = MyKafkaConnect(topic='test_topic', group='test_group')
external_stylesheets = ['https://codepen.io/chriddyp/pen/bWLwgP.css']
app = dash.Dash(__name__, external_stylesheets=external_stylesheets)
app.layout = html.Div(
html.Div([
html.H4('TERRA Satellite Live Feed'),
html.Div(id='live-update-text'),
dcc.Graph(id='live-update-graph'),
dcc.Interval(
id='interval-component',
interval=1*1000,
n_intervals=0
)
])
)
@app.callback(Output('live-update-text', 'children'),
[Input('interval-component', 'n_intervals')])
def update_metrics(n):
lon, lat, alt = connect.get_last()
print('update metrics')
style = {'padding': '5px', 'fontSize': '16px'}
return [
html.Span('Longitude: {0:.2f}'.format(lon), style=style),
html.Span('Latitude: {0:.2f}'.format(lat), style=style),
html.Span('Altitude: {0:0.2f}'.format(alt), style=style)
]
@app.callback(Output('live-update-graph', 'figure'),
[Input('interval-component', 'n_intervals')])
def update_graph_live(n):
data = connect.get_graph_data()
print('Update graph, data units:', len(data['time']))
fig = plotly.tools.make_subplots(rows=2, cols=1, vertical_spacing=0.2)
fig['layout']['margin'] = {
'l': 30, 'r': 10, 'b': 30, 't': 10
}
fig['layout']['legend'] = {'x': 0, 'y': 1, 'xanchor': 'left'}
fig.append_trace({
'x': data['time'],
'y': data['Altitude'],
'name': 'Altitude',
'mode': 'lines+markers',
'type': 'scatter'
}, 1, 1)
fig.append_trace({
'x': data['Longitude'],
'y': data['Latitude'],
'text': data['time'],
'name': 'Longitude vs Latitude',
'mode': 'lines+markers',
'type': 'scatter'
}, 2, 1)
return fig
if __name__ == '__main__':
app.run_server(debug=True)
:
- , backend , , ( , , ).
- / , .. , backend , .
- .
:

( backend , )
3. Docker
docker_microservices_app. , backend frontend Docker. backend ( - Aura (EOS CH-1) Aqua (EOS PM-1)).
DockerCódigo fuente backend / Dockerfile (empaquetado por producer.py)FROM python:3.7
RUN python -m pip install confluent-kafka
RUN python -m pip install pyorbital
WORKDIR /app
COPY producer.py ./
CMD ["python", "producer.py"]
Código fuente frontend / Dockerfile (empaquetado por consumer.py y graph_display.py)FROM python:3.7
RUN python -m pip install confluent-kafka
RUN python -m pip install dash plotly
WORKDIR /app
COPY consumer.py graph_display.py ./
CMD ["python", "graph_display.py"]
Código fuente docker-compose.yml (contiene backend, frontend y Kafka)version: '2.1'
# Stephane Maarek's kafka-docker
# https://github.com/simplesteph/kafka-stack-docker-compose/blob/master/zk-single-kafka-single.yml
services:
zoo1:
image: zookeeper:3.4.9
hostname: zoo1
ports:
- "2181:2181"
restart: unless-stopped
environment:
ZOO_MY_ID: 1
ZOO_PORT: 2181
ZOO_SERVERS: server.1=zoo1:2888:3888
volumes:
- ./zk-single-kafka-single/zoo1/data:/data
- ./zk-single-kafka-single/zoo1/datalog:/datalog
kafka1:
image: confluentinc/cp-kafka:5.5.0
hostname: kafka1
ports:
- "9092:9092"
restart: unless-stopped
environment:
KAFKA_ADVERTISED_LISTENERS: LISTENER_DOCKER_INTERNAL://kafka1:19092,LISTENER_DOCKER_EXTERNAL://${DOCKER_HOST_IP:-127.0.0.1}:9092
KAFKA_LISTENER_SECURITY_PROTOCOL_MAP: LISTENER_DOCKER_INTERNAL:PLAINTEXT,LISTENER_DOCKER_EXTERNAL:PLAINTEXT
KAFKA_INTER_BROKER_LISTENER_NAME: LISTENER_DOCKER_INTERNAL
KAFKA_ZOOKEEPER_CONNECT: "zoo1:2181"
KAFKA_BROKER_ID: 1
KAFKA_LOG4J_LOGGERS: "kafka.controller=INFO,kafka.producer.async.DefaultEventHandler=INFO,state.change.logger=INFO"
KAFKA_OFFSETS_TOPIC_REPLICATION_FACTOR: 1
volumes:
- ./zk-single-kafka-single/kafka1/data:/var/lib/kafka/data
depends_on:
- zoo1
backend_terra:
build:
context: ./backend
restart: unless-stopped
environment:
BOOTSTRAP_SERVERS: "kafka1:19092"
TOPIC: "terra_topic"
SATELLITE: "TERRA"
depends_on:
- kafka1
backend_aqua:
build:
context: ./backend
restart: unless-stopped
environment:
BOOTSTRAP_SERVERS: "kafka1:19092"
TOPIC: "aqua_topic"
SATELLITE: "AQUA"
depends_on:
- kafka1
backend_aura:
build:
context: ./backend
restart: unless-stopped
environment:
BOOTSTRAP_SERVERS: "kafka1:19092"
TOPIC: "aura_topic"
SATELLITE: "AURA"
depends_on:
- kafka1
frontend:
build:
context: ./frontend
ports:
- "8050:8050"
restart: unless-stopped
environment:
BOOTSTRAP_SERVERS: "kafka1:19092"
depends_on:
- backend_terra
- backend_aqua
- backend_aura
PythonCódigo fuente backend / producer.pyfrom time import sleep
import datetime
from confluent_kafka import Producer
import json
from pyorbital.orbital import Orbital
import os
topic = os.environ['TOPIC']
bootstrap_servers = os.environ['BOOTSTRAP_SERVERS']
s_name = os.environ['SATELLITE']
satellite = Orbital(s_name)
producer = Producer({'bootstrap.servers': bootstrap_servers})
def acked(err, msg):
if err is not None:
print("Failed to deliver message: {}".format(err))
else:
print("Produced record to topic {} partition [{}] @ offset {}"
.format(msg.topic(), msg.partition(), msg.offset()))
while True:
time = datetime.datetime.now()
lon, lat, alt = satellite.get_lonlatalt(time)
record_value = json.dumps({'lon':lon, 'lat': lat, 'alt': alt, 'time': str(time)})
producer.produce(topic, key=None, value=record_value, on_delivery=acked)
producer.poll()
sleep(1)
frontend/consumer.py ( )import datetime
from confluent_kafka import Consumer, TopicPartition
import json
from collections import deque
from time import sleep
class MyKafkaConnect:
def __init__(self, topic, group, que_len=180):
self.topic = topic
self.conf = {
'bootstrap.servers': 'localhost:9092',
'group.id': group,
'enable.auto.commit': True,
}
self.data = {
'time': deque(maxlen=que_len),
'Latitude': deque(maxlen=que_len),
'Longitude': deque(maxlen=que_len),
'Altitude': deque(maxlen=que_len)
}
consumer = Consumer(self.conf)
consumer.subscribe([self.topic])
self.partition = TopicPartition(topic=self.topic, partition=0)
low_offset, high_offset = consumer.get_watermark_offsets(self.partition)
if high_offset > que_len:
self.partition.offset = high_offset - que_len
else:
self.partition.offset = low_offset
consumer.assign([self.partition])
self.__update_que(consumer)
def __update_que(self, consumer):
try:
while True:
msg = consumer.poll(timeout=0.1)
if msg is None:
break
elif msg.error():
print('error: {}'.format(msg.error()))
break
else:
record_value = msg.value()
json_data = json.loads(record_value.decode('utf-8'))
self.data['Longitude'].append(json_data['lon'])
self.data['Latitude'].append(json_data['lat'])
self.data['Altitude'].append(json_data['alt'])
self.data['time'].append(datetime.datetime.strptime(json_data['time'], '%Y-%m-%d %H:%M:%S.%f'))
self.partition.offset += 1
finally:
consumer.close()
def get_graph_data(self):
consumer = Consumer(self.conf)
consumer.subscribe([self.topic])
consumer.get_watermark_offsets(self.partition)
consumer.assign([self.partition])
self.__update_que(consumer)
o = {key: list(value) for key, value in self.data.items()}
return o
def get_last(self):
lon = self.data['Longitude'][-1]
lat = self.data['Latitude'][-1]
alt = self.data['Altitude'][-1]
return lon, lat, alt
if __name__ == '__main__':
connect = MyKafkaConnect(topic='test_topic', group='test_group')
while True:
test = connect.get_graph_data()
print('number of messages:', len(test['time']),
'unique:', len(set(test['time'])),
'time:', test['time'][-1].second)
sleep(0.1)
frontend/graph_display.pyimport datetime
import dash
import dash_core_components as dcc
import dash_html_components as html
import plotly
from dash.dependencies import Input, Output
from consumer import MyKafkaConnect
external_stylesheets = ['https://codepen.io/chriddyp/pen/bWLwgP.css']
app = dash.Dash(__name__, external_stylesheets=external_stylesheets)
app.layout = html.Div(
html.Div([
html.Div([
html.H4('TERRA Satellite Live Feed'),
html.Div(id='terra-text'),
dcc.Graph(id='terra-graph')
], className="four columns"),
html.Div([
html.H4('AQUA Satellite Live Feed'),
html.Div(id='aqua-text'),
dcc.Graph(id='aqua-graph')
], className="four columns"),
html.Div([
html.H4('AURA Satellite Live Feed'),
html.Div(id='aura-text'),
dcc.Graph(id='aura-graph')
], className="four columns"),
dcc.Interval(
id='interval-component',
interval=1*1000,
n_intervals=0
)
], className="row")
)
def create_graphs(topic, live_update_text, live_update_graph):
connect = MyKafkaConnect(topic=topic, group='test_group')
@app.callback(Output(live_update_text, 'children'),
[Input('interval-component', 'n_intervals')])
def update_metrics_terra(n):
lon, lat, alt = connect.get_last()
print('update metrics')
style = {'padding': '5px', 'fontSize': '15px'}
return [
html.Span('Longitude: {0:.2f}'.format(lon), style=style),
html.Span('Latitude: {0:.2f}'.format(lat), style=style),
html.Span('Altitude: {0:0.2f}'.format(alt), style=style)
]
@app.callback(Output(live_update_graph, 'figure'),
[Input('interval-component', 'n_intervals')])
def update_graph_live_terra(n):
data = connect.get_graph_data()
print('Update graph, data units:', len(data['time']))
fig = plotly.tools.make_subplots(rows=2, cols=1, vertical_spacing=0.2)
fig['layout']['margin'] = {
'l': 30, 'r': 10, 'b': 30, 't': 10
}
fig['layout']['legend'] = {'x': 0, 'y': 1, 'xanchor': 'left'}
fig.append_trace({
'x': data['time'],
'y': data['Altitude'],
'name': 'Altitude',
'mode': 'lines+markers',
'type': 'scatter'
}, 1, 1)
fig.append_trace({
'x': data['Longitude'],
'y': data['Latitude'],
'text': data['time'],
'name': 'Longitude vs Latitude',
'mode': 'lines+markers',
'type': 'scatter'
}, 2, 1)
return fig
create_graphs('terra_topic', 'terra-text', 'terra-graph')
create_graphs('aqua_topic', 'aqua-text', 'aqua-graph')
create_graphs('aura_topic', 'aura-text', 'aura-graph')
if __name__ == '__main__':
app.run_server(
host='0.0.0.0',
port=8050,
debug=True)
( , ):
:
, backend , ( ), , , , .

( , , )
, ( ) . , Kafka , , , , .. , Kafka connectors, - .
Enlaces relacionados adicionales:
Python + Kafka =? / Nikolay Saskovets / bitnet [Python Meetup 14/09/2019 ]
Nikolay Saskovets, Construyendo sistemas de microservicios utilizando Kafka