在对库和Web框架的广泛迷恋中,我们开始忘记以最小的方式解决问题的乐趣。在本文中,我们将使用香草Python和JavaScript zapillit某个相关主题的Web服务,并将其安装在GitLab Pages中。快速,简约,没有不必要的依赖关系,并且尽可能优雅。
灵感vidosy 如何判断我们打浆COVID - 19从minutephysics,我在免费的(从远程办公和家庭事务)时间是基于数据从服务中勾勒地图冠状病毒传播在俄罗斯和世界的Yandex的构建图,相似的在“ Covid趋势”页面上。结果如下:
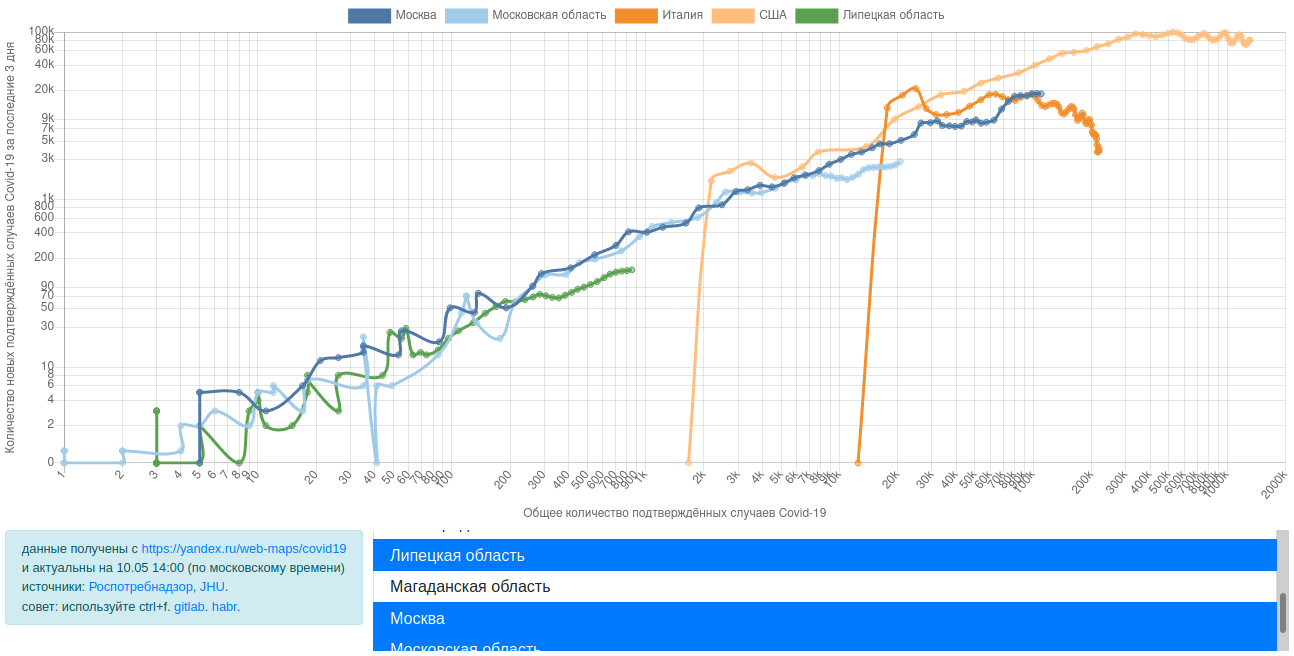
有趣?我们走吧!
从哪里获取数据?
大约在我想从俄罗斯地区的分钟物理学中复制图表的时候,Yandex在地图上添加了每个区域的直方图。

, . - , , , , requests . , ( , , , ):
from urllib.request import urlopen
from html.parser import HTMLParser
import json

class Covid19DataLoader(HTMLParser):
    page_url = "https://yandex.ru/web-maps/covid19"

    def __init__(self):
        super().__init__()
        self.config_found = False
        self.config = None

    def load(self):
        with urlopen(self.page_url) as response:
            page = response.read().decode("utf8")
        self.feed(page)
        return self.config['covidData']

    def handle_starttag(self, tag, attrs):
        if tag == 'script':
            for k, v in attrs:
                if k == 'class' and v == 'config-view':
                    self.config_found = True

    def handle_data(self, data):
        if self.config_found and not self.config:
            self.config = json.loads(data)
?
, — HTML-, Chart.js. - , string.Template:
def get_html(covid_data):
    template_str = open(page_path, 'r', encoding='utf-8').read()
    template = Template(template_str)
    page = template.substitute(
        covid_data=json.dumps(covid_data),
        data_info=get_info(covid_data)
    )
    return page
page_path :
<!DOCTYPE html>
<html>
<head></head>
<body>
<div>$data_info</div>
<script type="text/javascript">
let covid_data = $covid_data
</script>
</body>
</html>
! ! !
?
. Python:
from http.server import BaseHTTPRequestHandler
from lib.data_loader import Covid19DataLoader
from lib.page_maker import get_html

class Handler(BaseHTTPRequestHandler):
    def do_GET(self):
        if self.path == '/':
            self.send_response(200)
            self.send_header('Content-Type', 'text/html')
            self.end_headers()
            try:
                response = get_html(Covid19DataLoader().load())
                self.wfile.write(response.encode('utf-8'))
            except Exception as e:
                self.send_error(500)
                print(f'{type(e).__name__}: {e}')
        else:
            self.send_error(404)
, GitLab Pages,
, , , .
: . (, cron). , !
, 3 , . " ?" , , , - ( ) , !
from datetime import timedelta
from functools import reduce

y_axis_window = timedelta(days=3).total_seconds()

def get_cases_in_window(data, current_time):
    window_open_time = current_time - y_axis_window
    cases_in_window = list(filter(lambda s: window_open_time <= s['ts'] < current_time, data))
    return cases_in_window

def differentiate(data):
    result = [data[0]]
    for prev_i, cur_sample in enumerate(data[1:]):
        result.append({
            'ts': cur_sample['ts'],
            'value': cur_sample['value'] - data[prev_i]['value']
        })
    return result

def get_trend(histogram):
    trend = []
    new_cases = differentiate(histogram)
    for sample in histogram:
        current_time = sample['ts']
        total_cases = sample['value']
        new_cases_in_window = get_cases_in_window(new_cases, current_time)
        total_new_cases_in_window = reduce(lambda a, c: a + c['value'], new_cases_in_window, 0)
        trend.append({'x': total_cases,'y': total_new_cases_in_window})
    return trend

def get_trends(data_items):
    return { area['name']: get_trend(area['histogram']) for area in data_items }
, ( CSS Grid, ), . , - . .
?
Docker, , — VPS, docker-compose up --build -d, cron - ( , ?? , ...), , , http.server , . GitLab CI ssh ( ).
, , , .
GitLab Pages:
import os
from lib.data_loader import Covid19DataLoader
from lib.data_processor import get_trends
from lib.page_maker import get_html

page_dir = 'public'
page_name = 'index.html'

print('Updating Covid-19 data from Yandex...')
raw_data = Covid19DataLoader().load()
print('Calculating trends...')
trends = get_trends(raw_data['items'])
page = get_html({'raw_data': raw_data, 'trends': trends})

if not os.path.isdir(page_dir):
    os.mkdir(page_dir)
page_path = os.path.join(page_dir, page_name)
open(page_path, 'w', encoding='utf-8').write(page)
print(f'Page saved as "{page_path}"')
, https://himura.gitlab.io/covid19, .gitlab-ci.yml:
image: python
pages:
    stage: deploy
    only: [ master ]
    script:
        - python ./get_static_html.py
    artifacts:
      paths: [ public ]
Pipeline Schedules:
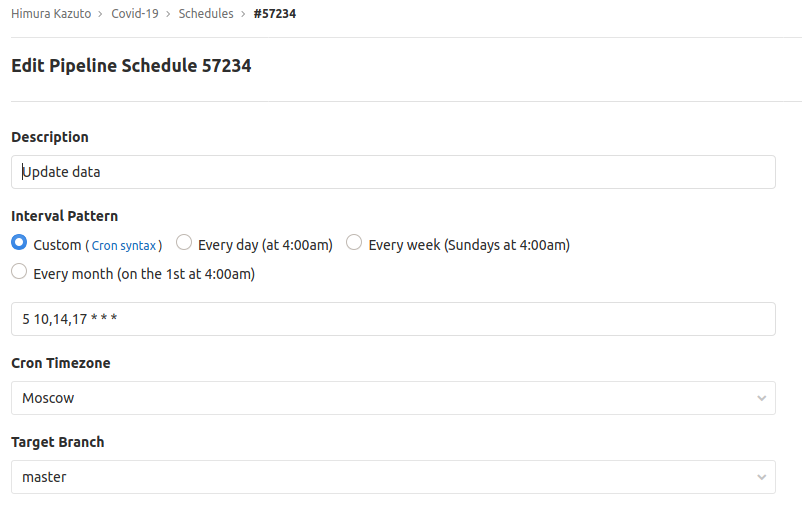
- :

— :
?
, GitLab: https://gitlab.com/himura/covid19
, , 2 . , - MVP, , - . , , — . known issues:
我希望这篇文章是有趣和/或有用的,并且我也确实希望不久以后,我们所有人都能看到图表的线条如何下降。
保持健康,不要在没有代码的情况下添加依赖项!