大家好。5月,OTUS 使用Zabbix,Prometheus,Grafana和ELK 启动了有关基础结构和应用程序的监视和日志记录的研讨会。在这方面,我们传统上共享有关该主题的有用材料。
用于Prometheus的Blackbox导出程序允许您通过HTTP,HTTPS,DNS,TCP,ICMP监视外部服务。在本文中,我将向您展示如何使用Blackbox导出程序配置HTTP / HTTPS监视。我们将在Kubernetes中启动Blackbox导出程序。环境
我们将需要以下内容:黑盒导出器配置
我们通过配置Blackbox ConfigMap来配置httpWeb服务监视模块。apiVersion: v1
kind: ConfigMap
metadata:
name: prometheus-blackbox-exporter
labels:
app: prometheus-blackbox-exporter
data:
blackbox.yaml: |
modules:
http_2xx:
http:
no_follow_redirects: false
preferred_ip_protocol: ip4
valid_http_versions:
- HTTP/1.1
- HTTP/2
valid_status_codes: []
prober: http
timeout: 5s
该模块http_2xx用于验证Web服务是否返回HTTP 2xx状态代码。黑匣子导出器的配置在文档中有更详细的描述。在Kubernetes集群中部署黑盒导出器
描述Deployment并Service在Kubernetes中进行部署。---
kind: Service
apiVersion: v1
metadata:
name: prometheus-blackbox-exporter
labels:
app: prometheus-blackbox-exporter
spec:
type: ClusterIP
ports:
- name: http
port: 9115
protocol: TCP
selector:
app: prometheus-blackbox-exporter
---
apiVersion: apps/v1
kind: Deployment
metadata:
name: prometheus-blackbox-exporter
labels:
app: prometheus-blackbox-exporter
spec:
replicas: 1
selector:
matchLabels:
app: prometheus-blackbox-exporter
template:
metadata:
labels:
app: prometheus-blackbox-exporter
spec:
restartPolicy: Always
containers:
- name: blackbox-exporter
image: "prom/blackbox-exporter:v0.15.1"
imagePullPolicy: IfNotPresent
securityContext:
readOnlyRootFilesystem: true
runAsNonRoot: true
runAsUser: 1000
args:
- "--config.file=/config/blackbox.yaml"
resources:
{}
ports:
- containerPort: 9115
name: http
livenessProbe:
httpGet:
path: /health
port: http
readinessProbe:
httpGet:
path: /health
port: http
volumeMounts:
- mountPath: /config
name: config
- name: configmap-reload
image: "jimmidyson/configmap-reload:v0.2.2"
imagePullPolicy: "IfNotPresent"
securityContext:
runAsNonRoot: true
runAsUser: 65534
args:
- --volume-dir=/etc/config
- --webhook-url=http:
resources:
{}
volumeMounts:
- mountPath: /etc/config
name: config
readOnly: true
volumes:
- name: config
configMap:
name: prometheus-blackbox-exporter
可以使用以下命令部署黑盒导出器。名称空间monitoring是指Prometheus运算符。kubectl --namespace=monitoring apply -f blackbox-exporter.yaml
使用以下命令验证所有服务都在运行:kubectl --namespace=monitoring get all --selector=app=prometheus-blackbox-exporter
检查黑匣子
您可以使用以下命令访问导出程序Blackbox Web界面port-forward:kubectl --namespace=monitoring port-forward svc/prometheus-blackbox-exporter 9115:9115
通过位于localhost:9115 的Web浏览器连接到导出器的Blackbox Web界面。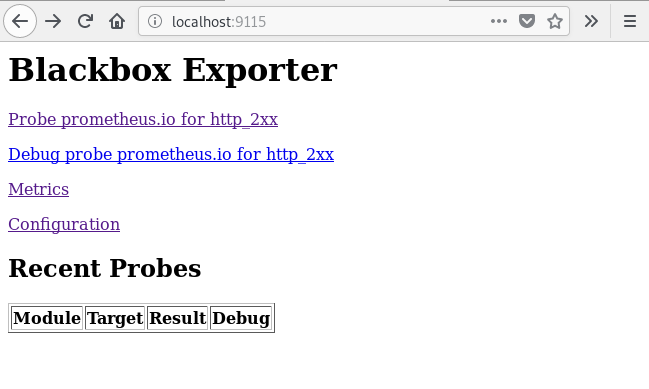 如果您转到地址http://本地主机:9115 / probe?Module = http_2xx&target = https://www.google.com,则会看到检查指定URL(https://www.google.com)的结果。
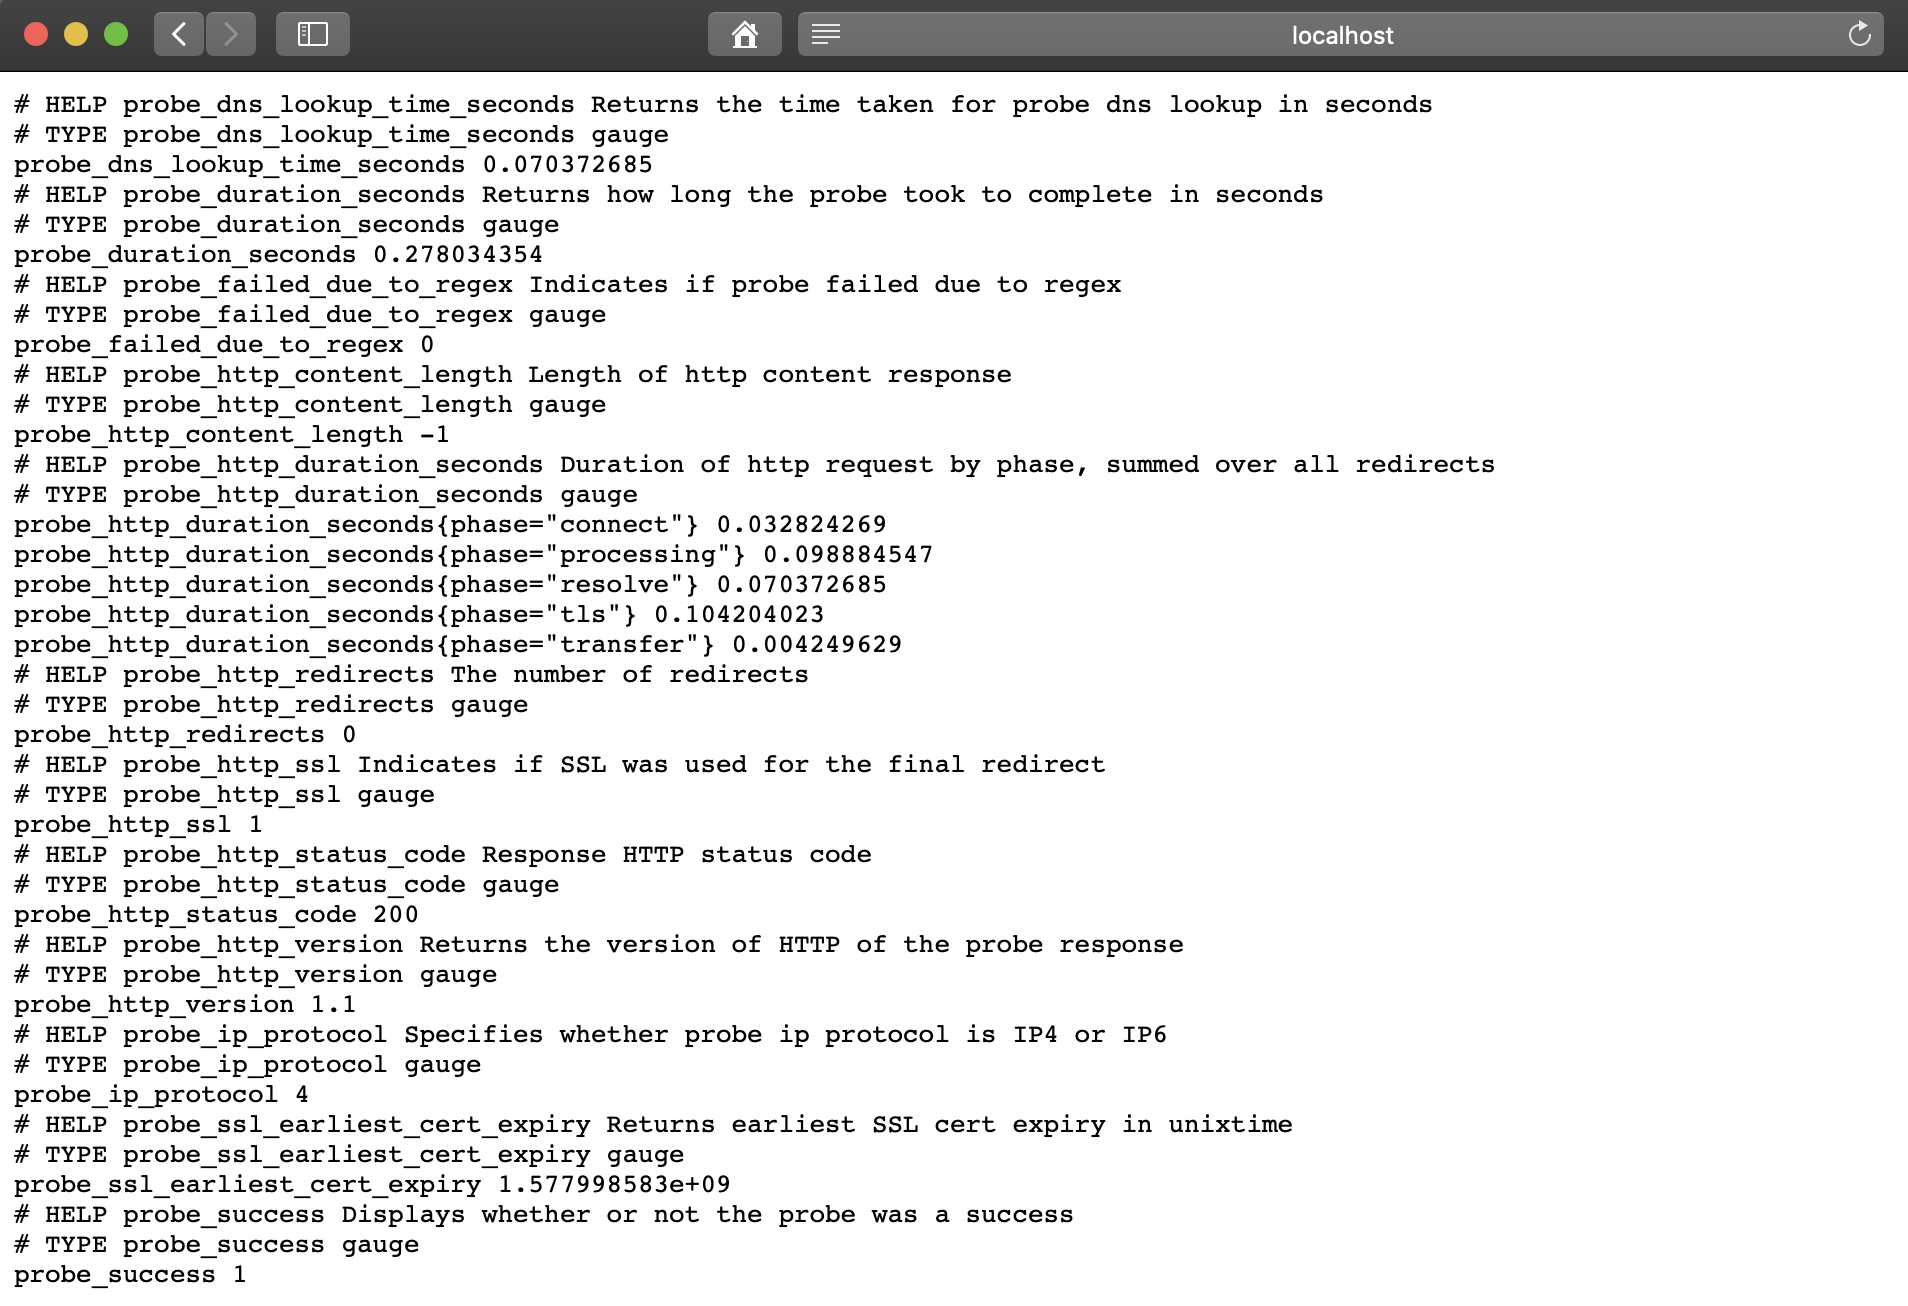 度量标准
度量标准probe_success值1表示检查成功。值为0表示错误。设置普罗米修斯
部署BlackBox导出器后,配置Prometheus prometheus-additional.yaml。- job_name: 'kube-api-blackbox'
scrape_interval: 1w
metrics_path: /probe
params:
module: [http_2xx]
static_configs:
- targets:
- https:
- http:
- https:
relabel_configs:
- source_labels: [__address__]
target_label: __param_target
- source_labels: [__param_target]
target_label: instance
- target_label: __address__
replacement: prometheus-blackbox-exporter:9115 # The blackbox exporter.
Secret使用以下命令
生成。PROMETHEUS_ADD_CONFIG=$(cat prometheus-additional.yaml | base64)
cat << EOF | kubectl --namespace=monitoring apply -f -
apiVersion: v1
kind: Secret
metadata:
name: additional-scrape-configs
type: Opaque
data:
prometheus-additional.yaml: $PROMETHEUS_ADD_CONFIG
EOF
使用来指定additional-scrape-configsPrometheus运算符additionalScrapeConfigs。kubectl --namespace=monitoring edit prometheuses k8s
...
spec:
additionalScrapeConfigs:
key: prometheus-additional.yaml
name: additional-scrape-configs
我们进入Prometheus Web界面,检查指标和目标。kubectl --namespace=monitoring port-forward svc/prometheus-k8s 9090:9090
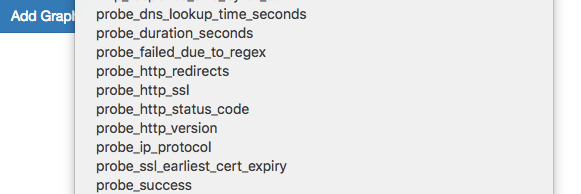
 我们看到了黑匣子的指标和目标。
添加通知规则(警报)
要从Blackbox导出器接收通知,请将规则添加到Prometheus Operator。kubectl --namespace=monitoring edit prometheusrules prometheus-k8s-rules
...
- name: blackbox-exporter
rules:
- alert: ProbeFailed
expr: probe_success == 0
for: 5m
labels:
severity: error
annotations:
summary: "Probe failed (instance {{ $labels.instance }})"
description: "Probe failed\n VALUE = {{ $value }}\n LABELS: {{ $labels }}"
- alert: SlowProbe
expr: avg_over_time(probe_duration_seconds[1m]) > 1
for: 5m
labels:
severity: warning
annotations:
summary: "Slow probe (instance {{ $labels.instance }})"
description: "Blackbox probe took more than 1s to complete\n VALUE = {{ $value }}\n LABELS: {{ $labels }}"
- alert: HttpStatusCode
expr: probe_http_status_code <= 199 OR probe_http_status_code >= 400
for: 5m
labels:
severity: error
annotations:
summary: "HTTP Status Code (instance {{ $labels.instance }})"
description: "HTTP status code is not 200-399\n VALUE = {{ $value }}\n LABELS: {{ $labels }}"
- alert: SslCertificateWillExpireSoon
expr: probe_ssl_earliest_cert_expiry - time() < 86400 * 30
for: 5m
labels:
severity: warning
annotations:
summary: "SSL certificate will expire soon (instance {{ $labels.instance }})"
description: "SSL certificate expires in 30 days\n VALUE = {{ $value }}\n LABELS: {{ $labels }}"
- alert: SslCertificateHasExpired
expr: probe_ssl_earliest_cert_expiry - time() <= 0
for: 5m
labels:
severity: error
annotations:
summary: "SSL certificate has expired (instance {{ $labels.instance }})"
description: "SSL certificate has expired already\n VALUE = {{ $value }}\n LABELS: {{ $labels }}"
- alert: HttpSlowRequests
expr: avg_over_time(probe_http_duration_seconds[1m]) > 1
for: 5m
labels:
severity: warning
annotations:
summary: "HTTP slow requests (instance {{ $labels.instance }})"
description: "HTTP request took more than 1s\n VALUE = {{ $value }}\n LABELS: {{ $labels }}"
- alert: SlowPing
expr: avg_over_time(probe_icmp_duration_seconds[1m]) > 1
for: 5m
labels:
severity: warning
annotations:
summary: "Slow ping (instance {{ $labels.instance }})"
description: "Blackbox ping took more than 1s\n VALUE = {{ $value }}\n LABELS: {{ $labels }}"
在Prometheus Web界面中,转到Status => Rules,然后找到blackbox-exporter的警报规则。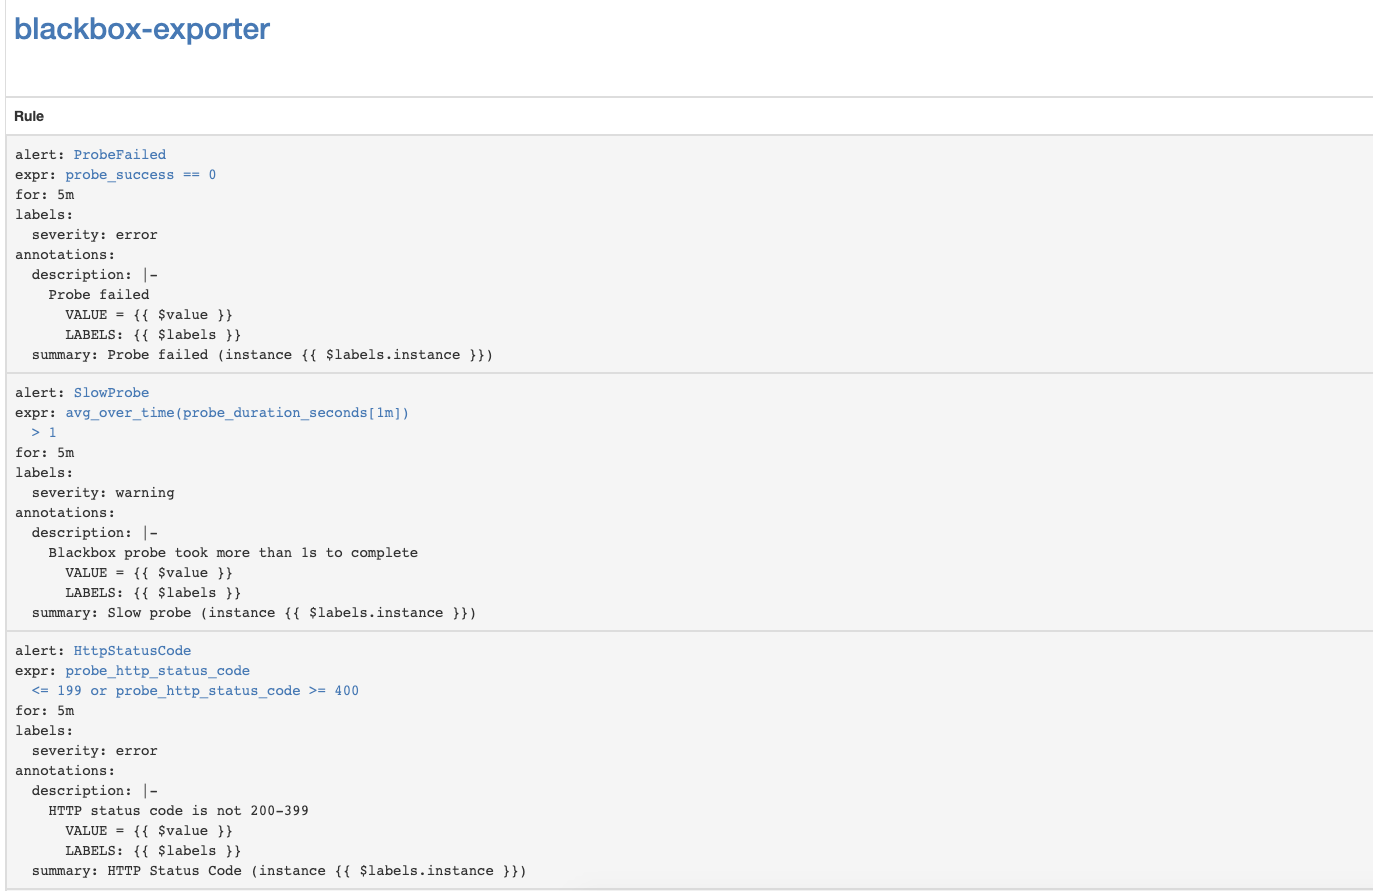
配置Kubernetes API Server SSL证书到期通知
让我们设置监控Kubernetes API Server SSL证书的到期时间。他将每周发送一次通知。添加用于Kubernetes API服务器身份验证的Blackbox导出器模块。kubectl --namespace=monitoring edit configmap prometheus-blackbox-exporter
...
kube-api:
http:
method: GET
no_follow_redirects: false
preferred_ip_protocol: ip4
tls_config:
insecure_skip_verify: false
ca_file: /var/run/secrets/kubernetes.io/serviceaccount/ca.crt
bearer_token_file: /var/run/secrets/kubernetes.io/serviceaccount/token
valid_http_versions:
- HTTP/1.1
- HTTP/2
valid_status_codes: []
prober: http
timeout: 5s
添加Prometheus抓取配置- job_name: 'kube-api-blackbox'
metrics_path: /probe
params:
module: [kube-api]
static_configs:
- targets:
- https:
relabel_configs:
- source_labels: [__address__]
target_label: __param_target
- source_labels: [__param_target]
target_label: instance
- target_label: __address__
replacement: prometheus-blackbox-exporter:9115 # The blackbox exporter.
应用普罗米修斯秘密PROMETHEUS_ADD_CONFIG=$(cat prometheus-additional.yaml | base64)
cat << EOF | kubectl --namespace=monitoring apply -f -
apiVersion: v1
kind: Secret
metadata:
name: additional-scrape-configs
type: Opaque
data:
prometheus-additional.yaml: $PROMETHEUS_ADD_CONFIG
EOF
添加警报规则kubectl --namespace=monitoring edit prometheusrules prometheus-k8s-rules
...
- name: k8s-api-server-cert-expiry
rules:
- alert: K8sAPIServerSSLCertExpiringAfterThreeMonths
expr: probe_ssl_earliest_cert_expiry{job="kube-api-blackbox"} - time() < 86400 * 90
for: 1w
labels:
severity: warning
annotations:
summary: "Kubernetes API Server SSL certificate will expire after three months (instance {{ $labels.instance }})"
description: "Kubernetes API Server SSL certificate expires in 90 days\n VALUE = {{ $value }}\n LABELS: {{ $labels }}"
有用的链接
监控和登录Docker