Olá a todos. Em maio, a OTUS lança um workshop sobre monitoramento e criação de log , infraestrutura e aplicativos, usando Zabbix, Prometheus, Grafana e ELK. A esse respeito, tradicionalmente compartilhamos material útil sobre o assunto.
O exportador de caixa preta do Prometheus permite monitorar serviços externos através de HTTP, HTTPS, DNS, TCP, ICMP. Neste artigo, mostrarei como configurar o monitoramento HTTP / HTTPS usando o exportador de Blackbox. Vamos lançar o exportador de Blackbox no Kubernetes.Meio Ambiente
Vamos precisar do seguinte:- Kubernetes
- Operador Prometheus
Configuração do exportador de caixa preta
Configuramos o Blackbox ConfigMappara configurar httpo módulo de monitoramento de serviços da web.apiVersion: v1
kind: ConfigMap
metadata:
name: prometheus-blackbox-exporter
labels:
app: prometheus-blackbox-exporter
data:
blackbox.yaml: |
modules:
http_2xx:
http:
no_follow_redirects: false
preferred_ip_protocol: ip4
valid_http_versions:
- HTTP/1.1
- HTTP/2
valid_status_codes: []
prober: http
timeout: 5s
O módulo é http_2xxusado para verificar se o serviço da web retorna um código de status HTTP 2xx. A configuração do exportador de caixa preta é descrita em mais detalhes na documentação .Implantar exportador de caixa preta no cluster Kubernetes
Descreva Deploymente Servicepara implantação no Kubernetes.---
kind: Service
apiVersion: v1
metadata:
name: prometheus-blackbox-exporter
labels:
app: prometheus-blackbox-exporter
spec:
type: ClusterIP
ports:
- name: http
port: 9115
protocol: TCP
selector:
app: prometheus-blackbox-exporter
---
apiVersion: apps/v1
kind: Deployment
metadata:
name: prometheus-blackbox-exporter
labels:
app: prometheus-blackbox-exporter
spec:
replicas: 1
selector:
matchLabels:
app: prometheus-blackbox-exporter
template:
metadata:
labels:
app: prometheus-blackbox-exporter
spec:
restartPolicy: Always
containers:
- name: blackbox-exporter
image: "prom/blackbox-exporter:v0.15.1"
imagePullPolicy: IfNotPresent
securityContext:
readOnlyRootFilesystem: true
runAsNonRoot: true
runAsUser: 1000
args:
- "--config.file=/config/blackbox.yaml"
resources:
{}
ports:
- containerPort: 9115
name: http
livenessProbe:
httpGet:
path: /health
port: http
readinessProbe:
httpGet:
path: /health
port: http
volumeMounts:
- mountPath: /config
name: config
- name: configmap-reload
image: "jimmidyson/configmap-reload:v0.2.2"
imagePullPolicy: "IfNotPresent"
securityContext:
runAsNonRoot: true
runAsUser: 65534
args:
- --volume-dir=/etc/config
- --webhook-url=http:
resources:
{}
volumeMounts:
- mountPath: /etc/config
name: config
readOnly: true
volumes:
- name: config
configMap:
name: prometheus-blackbox-exporter
O exportador de caixa preta pode ser implantado usando o seguinte comando. O espaço monitoringpara nome refere-se ao operador Prometheus.kubectl --namespace=monitoring apply -f blackbox-exporter.yaml
Verifique se todos os serviços estão em execução usando o seguinte comando:kubectl --namespace=monitoring get all --selector=app=prometheus-blackbox-exporter
Marque Blackbox
Você pode acessar a interface da web do exportador Blackbox com port-forward:kubectl --namespace=monitoring port-forward svc/prometheus-blackbox-exporter 9115:9115
Conecte-se à interface da Web Blackbox do exportador através de um navegador da web em localhost : 9115.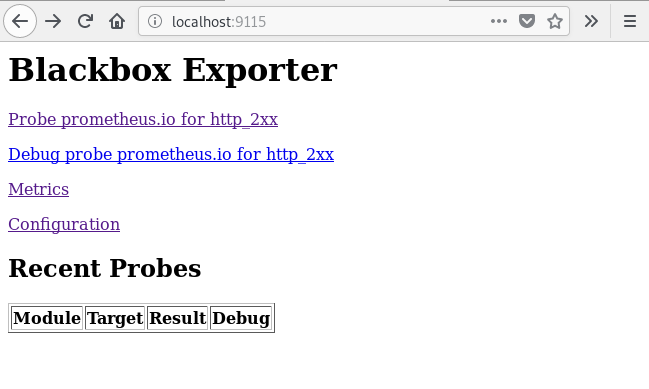 Se você acessar o endereço http: // localhost: 9115 / probe? Module = http_2xx & target = https: //www.google.com , verá o resultado da verificação do URL especificado ( https://www.google.com ).
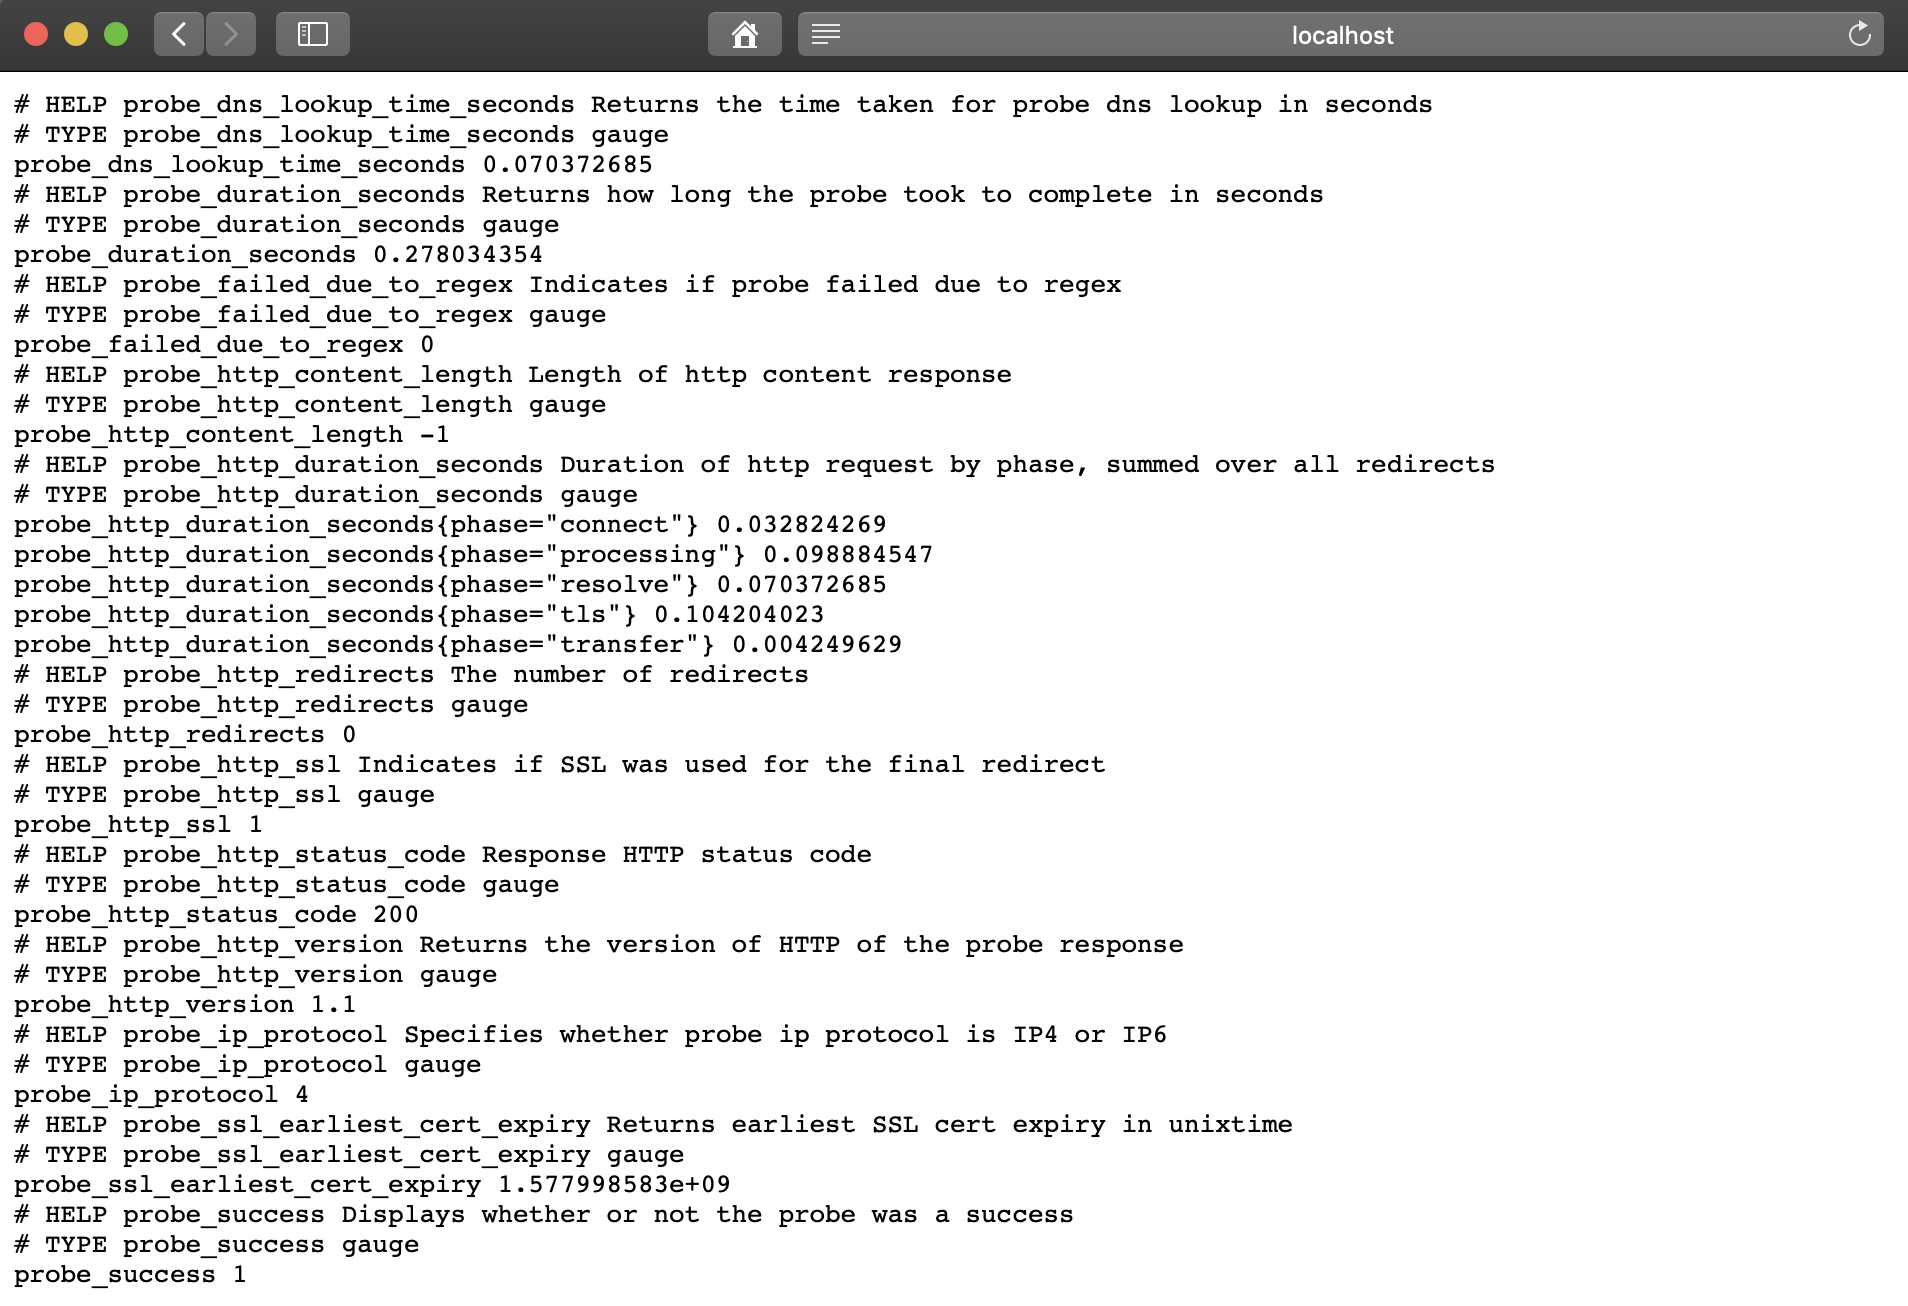 Um
Um probe_successvalor métrico 1 significa uma verificação bem-sucedida. Um valor 0 indica um erro.Configurando o Prometheus
Após implantar o exportador BlackBox, configure o Prometheus prometheus-additional.yaml.- job_name: 'kube-api-blackbox'
scrape_interval: 1w
metrics_path: /probe
params:
module: [http_2xx]
static_configs:
- targets:
- https:
- http:
- https:
relabel_configs:
- source_labels: [__address__]
target_label: __param_target
- source_labels: [__param_target]
target_label: instance
- target_label: __address__
replacement: prometheus-blackbox-exporter:9115 # The blackbox exporter.
Gere Secretusando o seguinte comando.PROMETHEUS_ADD_CONFIG=$(cat prometheus-additional.yaml | base64)
cat << EOF | kubectl --namespace=monitoring apply -f -
apiVersion: v1
kind: Secret
metadata:
name: additional-scrape-configs
type: Opaque
data:
prometheus-additional.yaml: $PROMETHEUS_ADD_CONFIG
EOF
Especifique additional-scrape-configspara o operador Prometheus usando additionalScrapeConfigs.kubectl --namespace=monitoring edit prometheuses k8s
...
spec:
additionalScrapeConfigs:
key: prometheus-additional.yaml
name: additional-scrape-configs
Entramos na interface da web do Prometheus, verificamos métricas e objetivos.kubectl --namespace=monitoring port-forward svc/prometheus-k8s 9090:9090
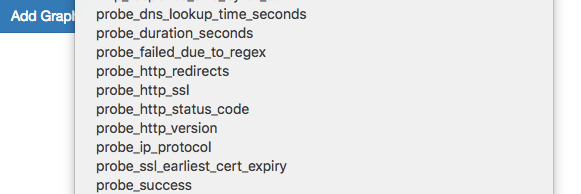
 Vemos as métricas e os objetivos da caixa preta.
Adicionando regras para notificações (alerta)
Para receber notificações do exportador do Blackbox, adicione as regras ao Prometheus Operator.kubectl --namespace=monitoring edit prometheusrules prometheus-k8s-rules
...
- name: blackbox-exporter
rules:
- alert: ProbeFailed
expr: probe_success == 0
for: 5m
labels:
severity: error
annotations:
summary: "Probe failed (instance {{ $labels.instance }})"
description: "Probe failed\n VALUE = {{ $value }}\n LABELS: {{ $labels }}"
- alert: SlowProbe
expr: avg_over_time(probe_duration_seconds[1m]) > 1
for: 5m
labels:
severity: warning
annotations:
summary: "Slow probe (instance {{ $labels.instance }})"
description: "Blackbox probe took more than 1s to complete\n VALUE = {{ $value }}\n LABELS: {{ $labels }}"
- alert: HttpStatusCode
expr: probe_http_status_code <= 199 OR probe_http_status_code >= 400
for: 5m
labels:
severity: error
annotations:
summary: "HTTP Status Code (instance {{ $labels.instance }})"
description: "HTTP status code is not 200-399\n VALUE = {{ $value }}\n LABELS: {{ $labels }}"
- alert: SslCertificateWillExpireSoon
expr: probe_ssl_earliest_cert_expiry - time() < 86400 * 30
for: 5m
labels:
severity: warning
annotations:
summary: "SSL certificate will expire soon (instance {{ $labels.instance }})"
description: "SSL certificate expires in 30 days\n VALUE = {{ $value }}\n LABELS: {{ $labels }}"
- alert: SslCertificateHasExpired
expr: probe_ssl_earliest_cert_expiry - time() <= 0
for: 5m
labels:
severity: error
annotations:
summary: "SSL certificate has expired (instance {{ $labels.instance }})"
description: "SSL certificate has expired already\n VALUE = {{ $value }}\n LABELS: {{ $labels }}"
- alert: HttpSlowRequests
expr: avg_over_time(probe_http_duration_seconds[1m]) > 1
for: 5m
labels:
severity: warning
annotations:
summary: "HTTP slow requests (instance {{ $labels.instance }})"
description: "HTTP request took more than 1s\n VALUE = {{ $value }}\n LABELS: {{ $labels }}"
- alert: SlowPing
expr: avg_over_time(probe_icmp_duration_seconds[1m]) > 1
for: 5m
labels:
severity: warning
annotations:
summary: "Slow ping (instance {{ $labels.instance }})"
description: "Blackbox ping took more than 1s\n VALUE = {{ $value }}\n LABELS: {{ $labels }}"
Na interface da web do Prometheus, vá para Status => Regras e encontre as regras de alerta para o blackbox-exportador.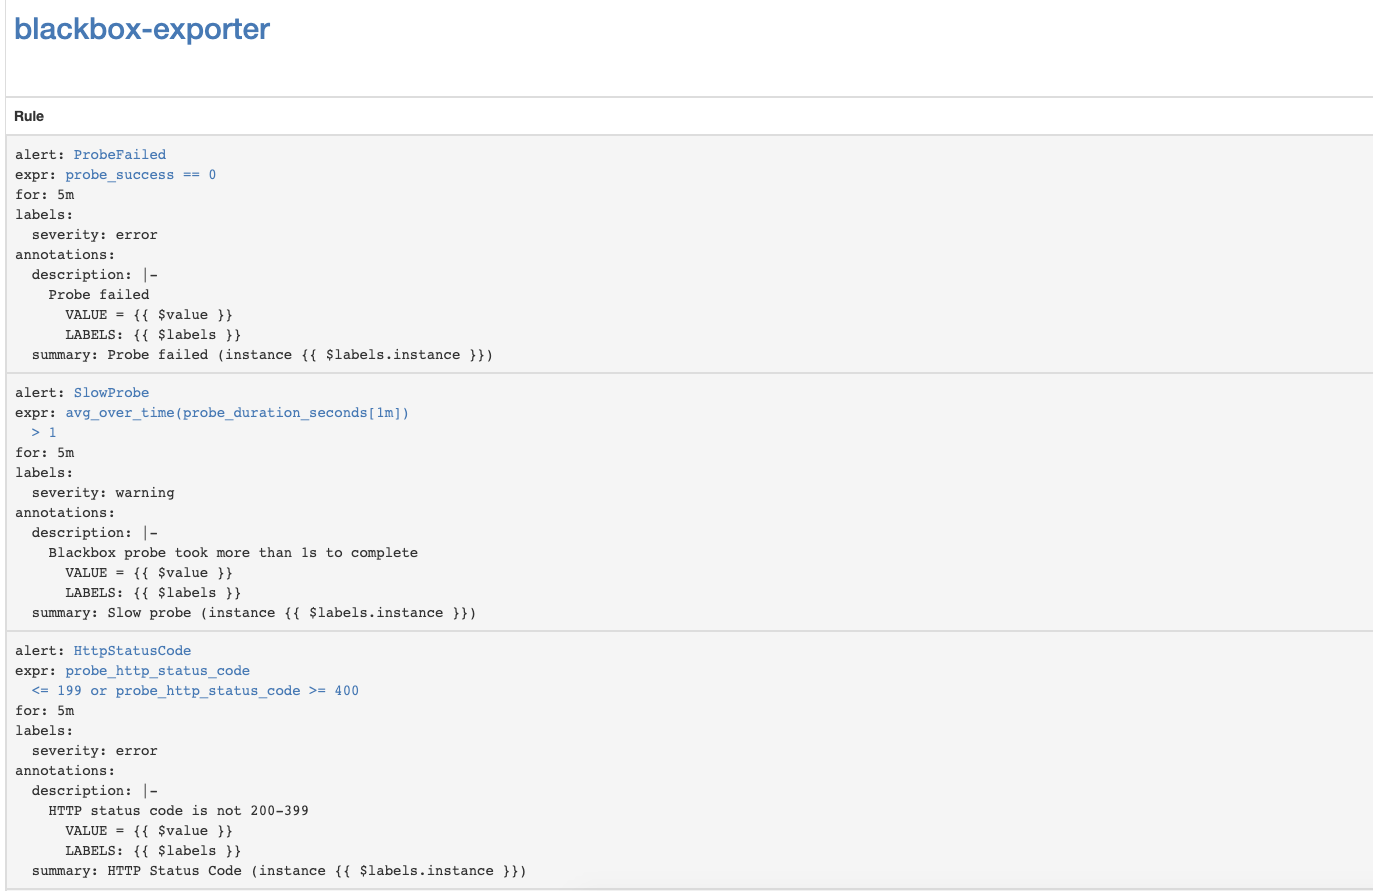
Configurar notificações de expiração de certificado SSL do servidor de API do Kubernetes
Vamos configurar o monitoramento da expiração dos certificados SSL do Kubernetes API Server. Ele envia notificações uma vez por semana.Adicione o módulo exportador do Blackbox para autenticação do servidor da API Kubernetes.kubectl --namespace=monitoring edit configmap prometheus-blackbox-exporter
...
kube-api:
http:
method: GET
no_follow_redirects: false
preferred_ip_protocol: ip4
tls_config:
insecure_skip_verify: false
ca_file: /var/run/secrets/kubernetes.io/serviceaccount/ca.crt
bearer_token_file: /var/run/secrets/kubernetes.io/serviceaccount/token
valid_http_versions:
- HTTP/1.1
- HTTP/2
valid_status_codes: []
prober: http
timeout: 5s
Adicionando a configuração de raspar Prometheus- job_name: 'kube-api-blackbox'
metrics_path: /probe
params:
module: [kube-api]
static_configs:
- targets:
- https:
relabel_configs:
- source_labels: [__address__]
target_label: __param_target
- source_labels: [__param_target]
target_label: instance
- target_label: __address__
replacement: prometheus-blackbox-exporter:9115 # The blackbox exporter.
Aplicar Prometheus SecretPROMETHEUS_ADD_CONFIG=$(cat prometheus-additional.yaml | base64)
cat << EOF | kubectl --namespace=monitoring apply -f -
apiVersion: v1
kind: Secret
metadata:
name: additional-scrape-configs
type: Opaque
data:
prometheus-additional.yaml: $PROMETHEUS_ADD_CONFIG
EOF
Adicionar regras de alertakubectl --namespace=monitoring edit prometheusrules prometheus-k8s-rules
...
- name: k8s-api-server-cert-expiry
rules:
- alert: K8sAPIServerSSLCertExpiringAfterThreeMonths
expr: probe_ssl_earliest_cert_expiry{job="kube-api-blackbox"} - time() < 86400 * 90
for: 1w
labels:
severity: warning
annotations:
summary: "Kubernetes API Server SSL certificate will expire after three months (instance {{ $labels.instance }})"
description: "Kubernetes API Server SSL certificate expires in 90 days\n VALUE = {{ $value }}\n LABELS: {{ $labels }}"
Links Úteis
Monitorando e registrando no Docker