En règle générale, lorsque vous devez faire quelque chose rapidement et à moindre coût, nous ne pensons pas à la tolérance aux pannes et à l'évolutivité de notre application, ce qui, après un certain temps, entraîne nécessairement de la douleur. Des solutions modernes vous permettent de résoudre rapidement et facilement ce problème.
Sur l'exemple du passage d'une application monolithique aux microservices, je vais essayer de montrer tous les avantages et les inconvénients de chaque approche. L'article est divisé en trois parties:
- Dans la première partie, nous considérerons une application monolithique sur le framework web Dash, c'est-à-dire la génération et l'affichage des données seront au même endroit.
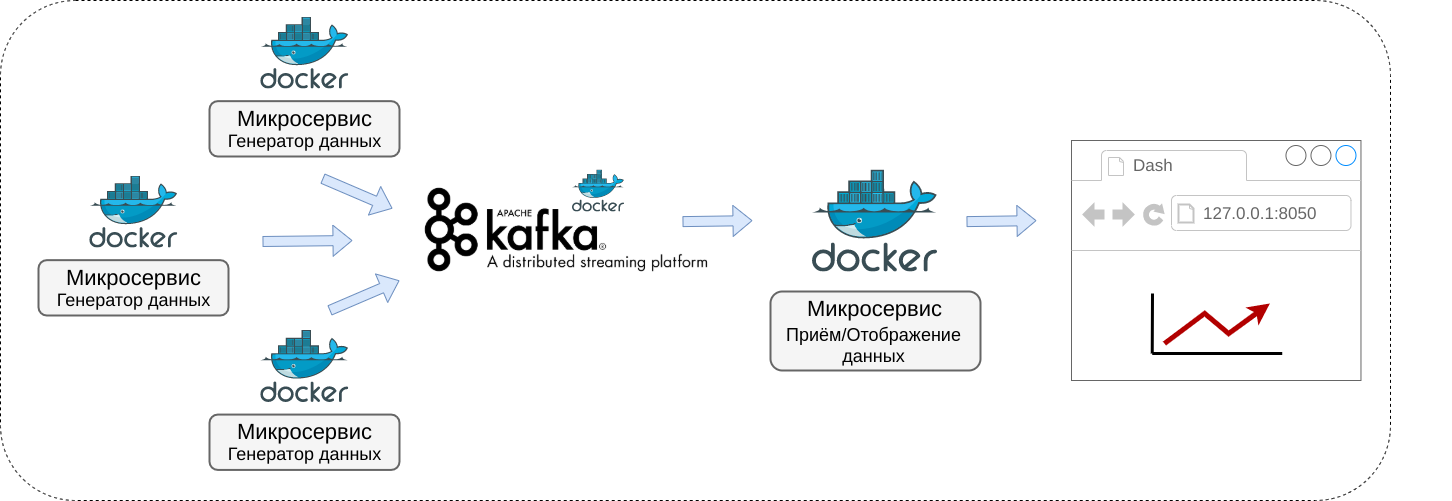
- La deuxième partie est consacrée à la décomposition d'une application monolithique en microservices, c'est-à-dire Un service sera engagé dans la génération de données, un autre sera affiché et la communication entre eux sera établie via le courtier de messages Kafka.
- Dans la troisième partie, les microservices seront "emballés" dans des conteneurs Docker.
L'application finale ressemblera au schéma ci-dessous.
introduction
Afin de mieux comprendre l'exemple, il est souhaitable d'avoir au moins des connaissances de base en Kafka et Docker, je donnerai à mon avis quelques cours et articles utiles:
github, .
1.
Dash (Plotly), , local_app. .
monolith.pyimport datetime
import dash
import dash_core_components as dcc
import dash_html_components as html
import plotly
from dash.dependencies import Input, Output
from pyorbital.orbital import Orbital
satellite = Orbital('TERRA')
external_stylesheets = ['https://codepen.io/chriddyp/pen/bWLwgP.css']
app = dash.Dash(__name__, external_stylesheets=external_stylesheets)
app.layout = html.Div(
html.Div([
html.H4('TERRA Satellite Live Feed'),
html.Div(id='live-update-text'),
dcc.Graph(id='live-update-graph'),
dcc.Interval(
id='interval-component',
interval=1*1000,
n_intervals=0
)
])
)
@app.callback(Output('live-update-text', 'children'),
[Input('interval-component', 'n_intervals')])
def update_metrics(n):
lon, lat, alt = satellite.get_lonlatalt(datetime.datetime.now())
style = {'padding': '5px', 'fontSize': '16px'}
return [
html.Span('Longitude: {0:.2f}'.format(lon), style=style),
html.Span('Latitude: {0:.2f}'.format(lat), style=style),
html.Span('Altitude: {0:0.2f}'.format(alt), style=style)
]
@app.callback(Output('live-update-graph', 'figure'),
[Input('interval-component', 'n_intervals')])
def update_graph_live(n):
satellite = Orbital('TERRA')
data = {
'time': [],
'Latitude': [],
'Longitude': [],
'Altitude': []
}
for i in range(180):
time = datetime.datetime.now() - datetime.timedelta(seconds=i*20)
lon, lat, alt = satellite.get_lonlatalt(
time
)
data['Longitude'].append(lon)
data['Latitude'].append(lat)
data['Altitude'].append(alt)
data['time'].append(time)
fig = plotly.tools.make_subplots(rows=2, cols=1, vertical_spacing=0.2)
fig['layout']['margin'] = {
'l': 30, 'r': 10, 'b': 30, 't': 10
}
fig['layout']['legend'] = {'x': 0, 'y': 1, 'xanchor': 'left'}
fig.append_trace({
'x': data['time'],
'y': data['Altitude'],
'name': 'Altitude',
'mode': 'lines+markers',
'type': 'scatter'
}, 1, 1)
fig.append_trace({
'x': data['Longitude'],
'y': data['Latitude'],
'text': data['time'],
'name': 'Longitude vs Latitude',
'mode': 'lines+markers',
'type': 'scatter'
}, 2, 1)
return fig
if __name__ == '__main__':
app.run_server(debug=True)
- . python pyorbital, ( - Terra (EOS AM-1)). Dash (Plotly) : 127.0.0.1:8050.
, — altitude, longitude latitude (, ), .. , , — .

( () )
:
:
- , , , , .. ( , ).
- / . , , , , .
2.
local_microservices_app, Kafka Docker, ( github Stephane Maarek)
, — backend (producer.py), Kafka, — frontend (consumer.py, graph_display.py) Kafka .
backend:
Producer ( ) Kafka ( 20 )
producer.pyfrom time import sleep
import datetime
from confluent_kafka import Producer
import json
from pyorbital.orbital import Orbital
satellite = Orbital('TERRA')
topic = 'test_topic'
producer = Producer({'bootstrap.servers': 'localhost:9092'})
def acked(err, msg):
if err is not None:
print("Failed to deliver message: {}".format(err))
else:
print("Produced record to topic {} partition [{}] @ offset {}"
.format(msg.topic(), msg.partition(), msg.offset()))
while True:
time = datetime.datetime.now()
lon, lat, alt = satellite.get_lonlatalt(time)
record_value = json.dumps({'lon':lon, 'lat': lat, 'alt': alt, 'time': str(time)})
producer.produce(topic, key=None, value=record_value, on_delivery=acked)
producer.poll()
sleep(1)
frontend:
Consumer ( ) MyKafkaConnect consumer.py, Kafka 180 ( , ) . Kafka.
(monolith.py) , , , MyKafkaConnect, .
consumer.pyimport datetime
from confluent_kafka import Consumer, TopicPartition
import json
from collections import deque
from time import sleep
class MyKafkaConnect:
def __init__(self, topic, group, que_len=180):
self.topic = topic
self.conf = {
'bootstrap.servers': 'localhost:9092',
'group.id': group,
'enable.auto.commit': True,
}
self.data = {
'time': deque(maxlen=que_len),
'Latitude': deque(maxlen=que_len),
'Longitude': deque(maxlen=que_len),
'Altitude': deque(maxlen=que_len)
}
consumer = Consumer(self.conf)
consumer.subscribe([self.topic])
self.partition = TopicPartition(topic=self.topic, partition=0)
low_offset, high_offset = consumer.get_watermark_offsets(self.partition)
if high_offset > que_len:
self.partition.offset = high_offset - que_len
else:
self.partition.offset = low_offset
consumer.assign([self.partition])
self.__update_que(consumer)
def __update_que(self, consumer):
try:
while True:
msg = consumer.poll(timeout=0.1)
if msg is None:
break
elif msg.error():
print('error: {}'.format(msg.error()))
break
else:
record_value = msg.value()
json_data = json.loads(record_value.decode('utf-8'))
self.data['Longitude'].append(json_data['lon'])
self.data['Latitude'].append(json_data['lat'])
self.data['Altitude'].append(json_data['alt'])
self.data['time'].append(datetime.datetime.strptime(json_data['time'], '%Y-%m-%d %H:%M:%S.%f'))
self.partition.offset += 1
finally:
consumer.close()
def get_graph_data(self):
consumer = Consumer(self.conf)
consumer.subscribe([self.topic])
consumer.get_watermark_offsets(self.partition)
consumer.assign([self.partition])
self.__update_que(consumer)
o = {key: list(value) for key, value in self.data.items()}
return o
def get_last(self):
lon = self.data['Longitude'][-1]
lat = self.data['Latitude'][-1]
alt = self.data['Altitude'][-1]
return lon, lat, alt
if __name__ == '__main__':
connect = MyKafkaConnect(topic='test_topic', group='test_group')
while True:
test = connect.get_graph_data()
print('number of messages:', len(test['time']),
'unique:', len(set(test['time'])),
'time:', test['time'][-1].second)
sleep(0.1)
graph_display.pyimport datetime
import dash
import dash_core_components as dcc
import dash_html_components as html
import plotly
from dash.dependencies import Input, Output
from consumer import MyKafkaConnect
connect = MyKafkaConnect(topic='test_topic', group='test_group')
external_stylesheets = ['https://codepen.io/chriddyp/pen/bWLwgP.css']
app = dash.Dash(__name__, external_stylesheets=external_stylesheets)
app.layout = html.Div(
html.Div([
html.H4('TERRA Satellite Live Feed'),
html.Div(id='live-update-text'),
dcc.Graph(id='live-update-graph'),
dcc.Interval(
id='interval-component',
interval=1*1000,
n_intervals=0
)
])
)
@app.callback(Output('live-update-text', 'children'),
[Input('interval-component', 'n_intervals')])
def update_metrics(n):
lon, lat, alt = connect.get_last()
print('update metrics')
style = {'padding': '5px', 'fontSize': '16px'}
return [
html.Span('Longitude: {0:.2f}'.format(lon), style=style),
html.Span('Latitude: {0:.2f}'.format(lat), style=style),
html.Span('Altitude: {0:0.2f}'.format(alt), style=style)
]
@app.callback(Output('live-update-graph', 'figure'),
[Input('interval-component', 'n_intervals')])
def update_graph_live(n):
data = connect.get_graph_data()
print('Update graph, data units:', len(data['time']))
fig = plotly.tools.make_subplots(rows=2, cols=1, vertical_spacing=0.2)
fig['layout']['margin'] = {
'l': 30, 'r': 10, 'b': 30, 't': 10
}
fig['layout']['legend'] = {'x': 0, 'y': 1, 'xanchor': 'left'}
fig.append_trace({
'x': data['time'],
'y': data['Altitude'],
'name': 'Altitude',
'mode': 'lines+markers',
'type': 'scatter'
}, 1, 1)
fig.append_trace({
'x': data['Longitude'],
'y': data['Latitude'],
'text': data['time'],
'name': 'Longitude vs Latitude',
'mode': 'lines+markers',
'type': 'scatter'
}, 2, 1)
return fig
if __name__ == '__main__':
app.run_server(debug=True)
:
- , backend , , ( , , ).
- / , .. , backend , .
- .
:

( backend , )
3. Docker
docker_microservices_app. , backend frontend Docker. backend ( - Aura (EOS CH-1) Aqua (EOS PM-1)).
DockerBackend de code source / Dockerfile (emballé par producteur.py)FROM python:3.7
RUN python -m pip install confluent-kafka
RUN python -m pip install pyorbital
WORKDIR /app
COPY producer.py ./
CMD ["python", "producer.py"]
frontend/Dockerfile ( consumer.py graph_display.py)FROM python:3.7
RUN python -m pip install confluent-kafka
RUN python -m pip install dash plotly
WORKDIR /app
COPY consumer.py graph_display.py ./
CMD ["python", "graph_display.py"]
docker-compose.yml ( backend, frontend Kafka)version: '2.1'
# Stephane Maarek's kafka-docker
# https://github.com/simplesteph/kafka-stack-docker-compose/blob/master/zk-single-kafka-single.yml
services:
zoo1:
image: zookeeper:3.4.9
hostname: zoo1
ports:
- "2181:2181"
restart: unless-stopped
environment:
ZOO_MY_ID: 1
ZOO_PORT: 2181
ZOO_SERVERS: server.1=zoo1:2888:3888
volumes:
- ./zk-single-kafka-single/zoo1/data:/data
- ./zk-single-kafka-single/zoo1/datalog:/datalog
kafka1:
image: confluentinc/cp-kafka:5.5.0
hostname: kafka1
ports:
- "9092:9092"
restart: unless-stopped
environment:
KAFKA_ADVERTISED_LISTENERS: LISTENER_DOCKER_INTERNAL://kafka1:19092,LISTENER_DOCKER_EXTERNAL://${DOCKER_HOST_IP:-127.0.0.1}:9092
KAFKA_LISTENER_SECURITY_PROTOCOL_MAP: LISTENER_DOCKER_INTERNAL:PLAINTEXT,LISTENER_DOCKER_EXTERNAL:PLAINTEXT
KAFKA_INTER_BROKER_LISTENER_NAME: LISTENER_DOCKER_INTERNAL
KAFKA_ZOOKEEPER_CONNECT: "zoo1:2181"
KAFKA_BROKER_ID: 1
KAFKA_LOG4J_LOGGERS: "kafka.controller=INFO,kafka.producer.async.DefaultEventHandler=INFO,state.change.logger=INFO"
KAFKA_OFFSETS_TOPIC_REPLICATION_FACTOR: 1
volumes:
- ./zk-single-kafka-single/kafka1/data:/var/lib/kafka/data
depends_on:
- zoo1
backend_terra:
build:
context: ./backend
restart: unless-stopped
environment:
BOOTSTRAP_SERVERS: "kafka1:19092"
TOPIC: "terra_topic"
SATELLITE: "TERRA"
depends_on:
- kafka1
backend_aqua:
build:
context: ./backend
restart: unless-stopped
environment:
BOOTSTRAP_SERVERS: "kafka1:19092"
TOPIC: "aqua_topic"
SATELLITE: "AQUA"
depends_on:
- kafka1
backend_aura:
build:
context: ./backend
restart: unless-stopped
environment:
BOOTSTRAP_SERVERS: "kafka1:19092"
TOPIC: "aura_topic"
SATELLITE: "AURA"
depends_on:
- kafka1
frontend:
build:
context: ./frontend
ports:
- "8050:8050"
restart: unless-stopped
environment:
BOOTSTRAP_SERVERS: "kafka1:19092"
depends_on:
- backend_terra
- backend_aqua
- backend_aura
Pythonbackend/producer.pyfrom time import sleep
import datetime
from confluent_kafka import Producer
import json
from pyorbital.orbital import Orbital
import os
topic = os.environ['TOPIC']
bootstrap_servers = os.environ['BOOTSTRAP_SERVERS']
s_name = os.environ['SATELLITE']
satellite = Orbital(s_name)
producer = Producer({'bootstrap.servers': bootstrap_servers})
def acked(err, msg):
if err is not None:
print("Failed to deliver message: {}".format(err))
else:
print("Produced record to topic {} partition [{}] @ offset {}"
.format(msg.topic(), msg.partition(), msg.offset()))
while True:
time = datetime.datetime.now()
lon, lat, alt = satellite.get_lonlatalt(time)
record_value = json.dumps({'lon':lon, 'lat': lat, 'alt': alt, 'time': str(time)})
producer.produce(topic, key=None, value=record_value, on_delivery=acked)
producer.poll()
sleep(1)
frontend/consumer.py ( )import datetime
from confluent_kafka import Consumer, TopicPartition
import json
from collections import deque
from time import sleep
class MyKafkaConnect:
def __init__(self, topic, group, que_len=180):
self.topic = topic
self.conf = {
'bootstrap.servers': 'localhost:9092',
'group.id': group,
'enable.auto.commit': True,
}
self.data = {
'time': deque(maxlen=que_len),
'Latitude': deque(maxlen=que_len),
'Longitude': deque(maxlen=que_len),
'Altitude': deque(maxlen=que_len)
}
consumer = Consumer(self.conf)
consumer.subscribe([self.topic])
self.partition = TopicPartition(topic=self.topic, partition=0)
low_offset, high_offset = consumer.get_watermark_offsets(self.partition)
if high_offset > que_len:
self.partition.offset = high_offset - que_len
else:
self.partition.offset = low_offset
consumer.assign([self.partition])
self.__update_que(consumer)
def __update_que(self, consumer):
try:
while True:
msg = consumer.poll(timeout=0.1)
if msg is None:
break
elif msg.error():
print('error: {}'.format(msg.error()))
break
else:
record_value = msg.value()
json_data = json.loads(record_value.decode('utf-8'))
self.data['Longitude'].append(json_data['lon'])
self.data['Latitude'].append(json_data['lat'])
self.data['Altitude'].append(json_data['alt'])
self.data['time'].append(datetime.datetime.strptime(json_data['time'], '%Y-%m-%d %H:%M:%S.%f'))
self.partition.offset += 1
finally:
consumer.close()
def get_graph_data(self):
consumer = Consumer(self.conf)
consumer.subscribe([self.topic])
consumer.get_watermark_offsets(self.partition)
consumer.assign([self.partition])
self.__update_que(consumer)
o = {key: list(value) for key, value in self.data.items()}
return o
def get_last(self):
lon = self.data['Longitude'][-1]
lat = self.data['Latitude'][-1]
alt = self.data['Altitude'][-1]
return lon, lat, alt
if __name__ == '__main__':
connect = MyKafkaConnect(topic='test_topic', group='test_group')
while True:
test = connect.get_graph_data()
print('number of messages:', len(test['time']),
'unique:', len(set(test['time'])),
'time:', test['time'][-1].second)
sleep(0.1)
frontend/graph_display.pyimport datetime
import dash
import dash_core_components as dcc
import dash_html_components as html
import plotly
from dash.dependencies import Input, Output
from consumer import MyKafkaConnect
external_stylesheets = ['https://codepen.io/chriddyp/pen/bWLwgP.css']
app = dash.Dash(__name__, external_stylesheets=external_stylesheets)
app.layout = html.Div(
html.Div([
html.Div([
html.H4('TERRA Satellite Live Feed'),
html.Div(id='terra-text'),
dcc.Graph(id='terra-graph')
], className="four columns"),
html.Div([
html.H4('AQUA Satellite Live Feed'),
html.Div(id='aqua-text'),
dcc.Graph(id='aqua-graph')
], className="four columns"),
html.Div([
html.H4('AURA Satellite Live Feed'),
html.Div(id='aura-text'),
dcc.Graph(id='aura-graph')
], className="four columns"),
dcc.Interval(
id='interval-component',
interval=1*1000,
n_intervals=0
)
], className="row")
)
def create_graphs(topic, live_update_text, live_update_graph):
connect = MyKafkaConnect(topic=topic, group='test_group')
@app.callback(Output(live_update_text, 'children'),
[Input('interval-component', 'n_intervals')])
def update_metrics_terra(n):
lon, lat, alt = connect.get_last()
print('update metrics')
style = {'padding': '5px', 'fontSize': '15px'}
return [
html.Span('Longitude: {0:.2f}'.format(lon), style=style),
html.Span('Latitude: {0:.2f}'.format(lat), style=style),
html.Span('Altitude: {0:0.2f}'.format(alt), style=style)
]
@app.callback(Output(live_update_graph, 'figure'),
[Input('interval-component', 'n_intervals')])
def update_graph_live_terra(n):
data = connect.get_graph_data()
print('Update graph, data units:', len(data['time']))
fig = plotly.tools.make_subplots(rows=2, cols=1, vertical_spacing=0.2)
fig['layout']['margin'] = {
'l': 30, 'r': 10, 'b': 30, 't': 10
}
fig['layout']['legend'] = {'x': 0, 'y': 1, 'xanchor': 'left'}
fig.append_trace({
'x': data['time'],
'y': data['Altitude'],
'name': 'Altitude',
'mode': 'lines+markers',
'type': 'scatter'
}, 1, 1)
fig.append_trace({
'x': data['Longitude'],
'y': data['Latitude'],
'text': data['time'],
'name': 'Longitude vs Latitude',
'mode': 'lines+markers',
'type': 'scatter'
}, 2, 1)
return fig
create_graphs('terra_topic', 'terra-text', 'terra-graph')
create_graphs('aqua_topic', 'aqua-text', 'aqua-graph')
create_graphs('aura_topic', 'aura-text', 'aura-graph')
if __name__ == '__main__':
app.run_server(
host='0.0.0.0',
port=8050,
debug=True)
( , ):
:
, backend , ( ), , , , .

( , , )
, ( ) . , Kafka , , , , .. , Kafka connectors, - .
Liens connexes supplémentaires:
Python + Kafka =? / Nikolay Saskovets / bitnet [Python Meetup 14/09/2019 ]
Nikolay Saskovets, Création de systèmes de microservices à l'aide de Kafka