Bonjour à tous. En mai, OTUS lance un atelier pour surveiller et enregistrer l'infrastructure et les applications à l'aide de Zabbix, Prometheus, Grafana et ELK. À cet égard, nous partageons traditionnellement des informations utiles sur le sujet.
L'exportateur Blackbox pour Prometheus vous permet de surveiller les services externes via HTTP, HTTPS, DNS, TCP, ICMP. Dans cet article, je vais vous montrer comment configurer la surveillance HTTP / HTTPS à l'aide de l'exportateur Blackbox. Nous lancerons l'exportateur Blackbox à Kubernetes.Environnement
Nous aurons besoin des éléments suivants:- Kubernetes
- Opérateur Prometheus
Configuration de l'exportateur Blackbox
Nous configurons Blackbox via ConfigMappour configurer httple module de surveillance des services Web.apiVersion: v1
kind: ConfigMap
metadata:
name: prometheus-blackbox-exporter
labels:
app: prometheus-blackbox-exporter
data:
blackbox.yaml: |
modules:
http_2xx:
http:
no_follow_redirects: false
preferred_ip_protocol: ip4
valid_http_versions:
- HTTP/1.1
- HTTP/2
valid_status_codes: []
prober: http
timeout: 5s
Le module est http_2xxutilisé pour vérifier que le service Web renvoie un code d'état HTTP 2xx. Plus d'exportateur de configuration de blackbox est décrit dans la documentation .Déployer l'exportateur de boîte noire dans le cluster Kubernetes
Décrire Deploymentet Servicepour le déploiement dans Kubernetes.---
kind: Service
apiVersion: v1
metadata:
name: prometheus-blackbox-exporter
labels:
app: prometheus-blackbox-exporter
spec:
type: ClusterIP
ports:
- name: http
port: 9115
protocol: TCP
selector:
app: prometheus-blackbox-exporter
---
apiVersion: apps/v1
kind: Deployment
metadata:
name: prometheus-blackbox-exporter
labels:
app: prometheus-blackbox-exporter
spec:
replicas: 1
selector:
matchLabels:
app: prometheus-blackbox-exporter
template:
metadata:
labels:
app: prometheus-blackbox-exporter
spec:
restartPolicy: Always
containers:
- name: blackbox-exporter
image: "prom/blackbox-exporter:v0.15.1"
imagePullPolicy: IfNotPresent
securityContext:
readOnlyRootFilesystem: true
runAsNonRoot: true
runAsUser: 1000
args:
- "--config.file=/config/blackbox.yaml"
resources:
{}
ports:
- containerPort: 9115
name: http
livenessProbe:
httpGet:
path: /health
port: http
readinessProbe:
httpGet:
path: /health
port: http
volumeMounts:
- mountPath: /config
name: config
- name: configmap-reload
image: "jimmidyson/configmap-reload:v0.2.2"
imagePullPolicy: "IfNotPresent"
securityContext:
runAsNonRoot: true
runAsUser: 65534
args:
- --volume-dir=/etc/config
- --webhook-url=http:
resources:
{}
volumeMounts:
- mountPath: /etc/config
name: config
readOnly: true
volumes:
- name: config
configMap:
name: prometheus-blackbox-exporter
L'exportateur de boîte noire peut être déployé à l'aide de la commande suivante. L'espace de noms monitoringfait référence à l'opérateur Prometheus.kubectl --namespace=monitoring apply -f blackbox-exporter.yaml
Vérifiez que tous les services sont en cours d'exécution à l'aide de la commande suivante:kubectl --namespace=monitoring get all --selector=app=prometheus-blackbox-exporter
Vérifiez Blackbox
Vous pouvez accéder à l'interface Web Blackbox de l'exportateur avec port-forward:kubectl --namespace=monitoring port-forward svc/prometheus-blackbox-exporter 9115:9115
Connectez-vous à l'interface Web Blackbox de l'exportateur via un navigateur Web sur localhost : 9115.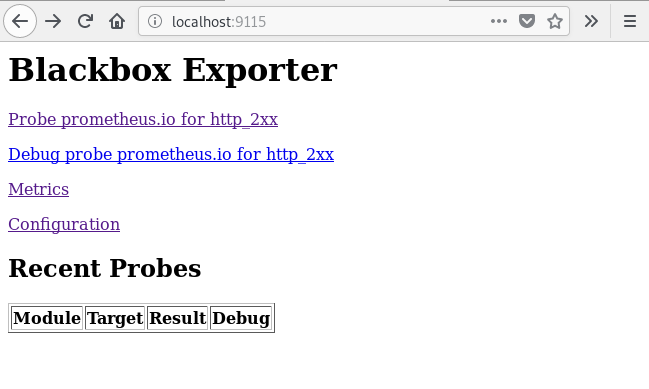 Si vous allez à l'adresse http: // localhost: 9115 / probe? Module = http_2xx & target = https: //www.google.com , vous verrez le résultat de la vérification de l'URL spécifiée ( https://www.google.com ).
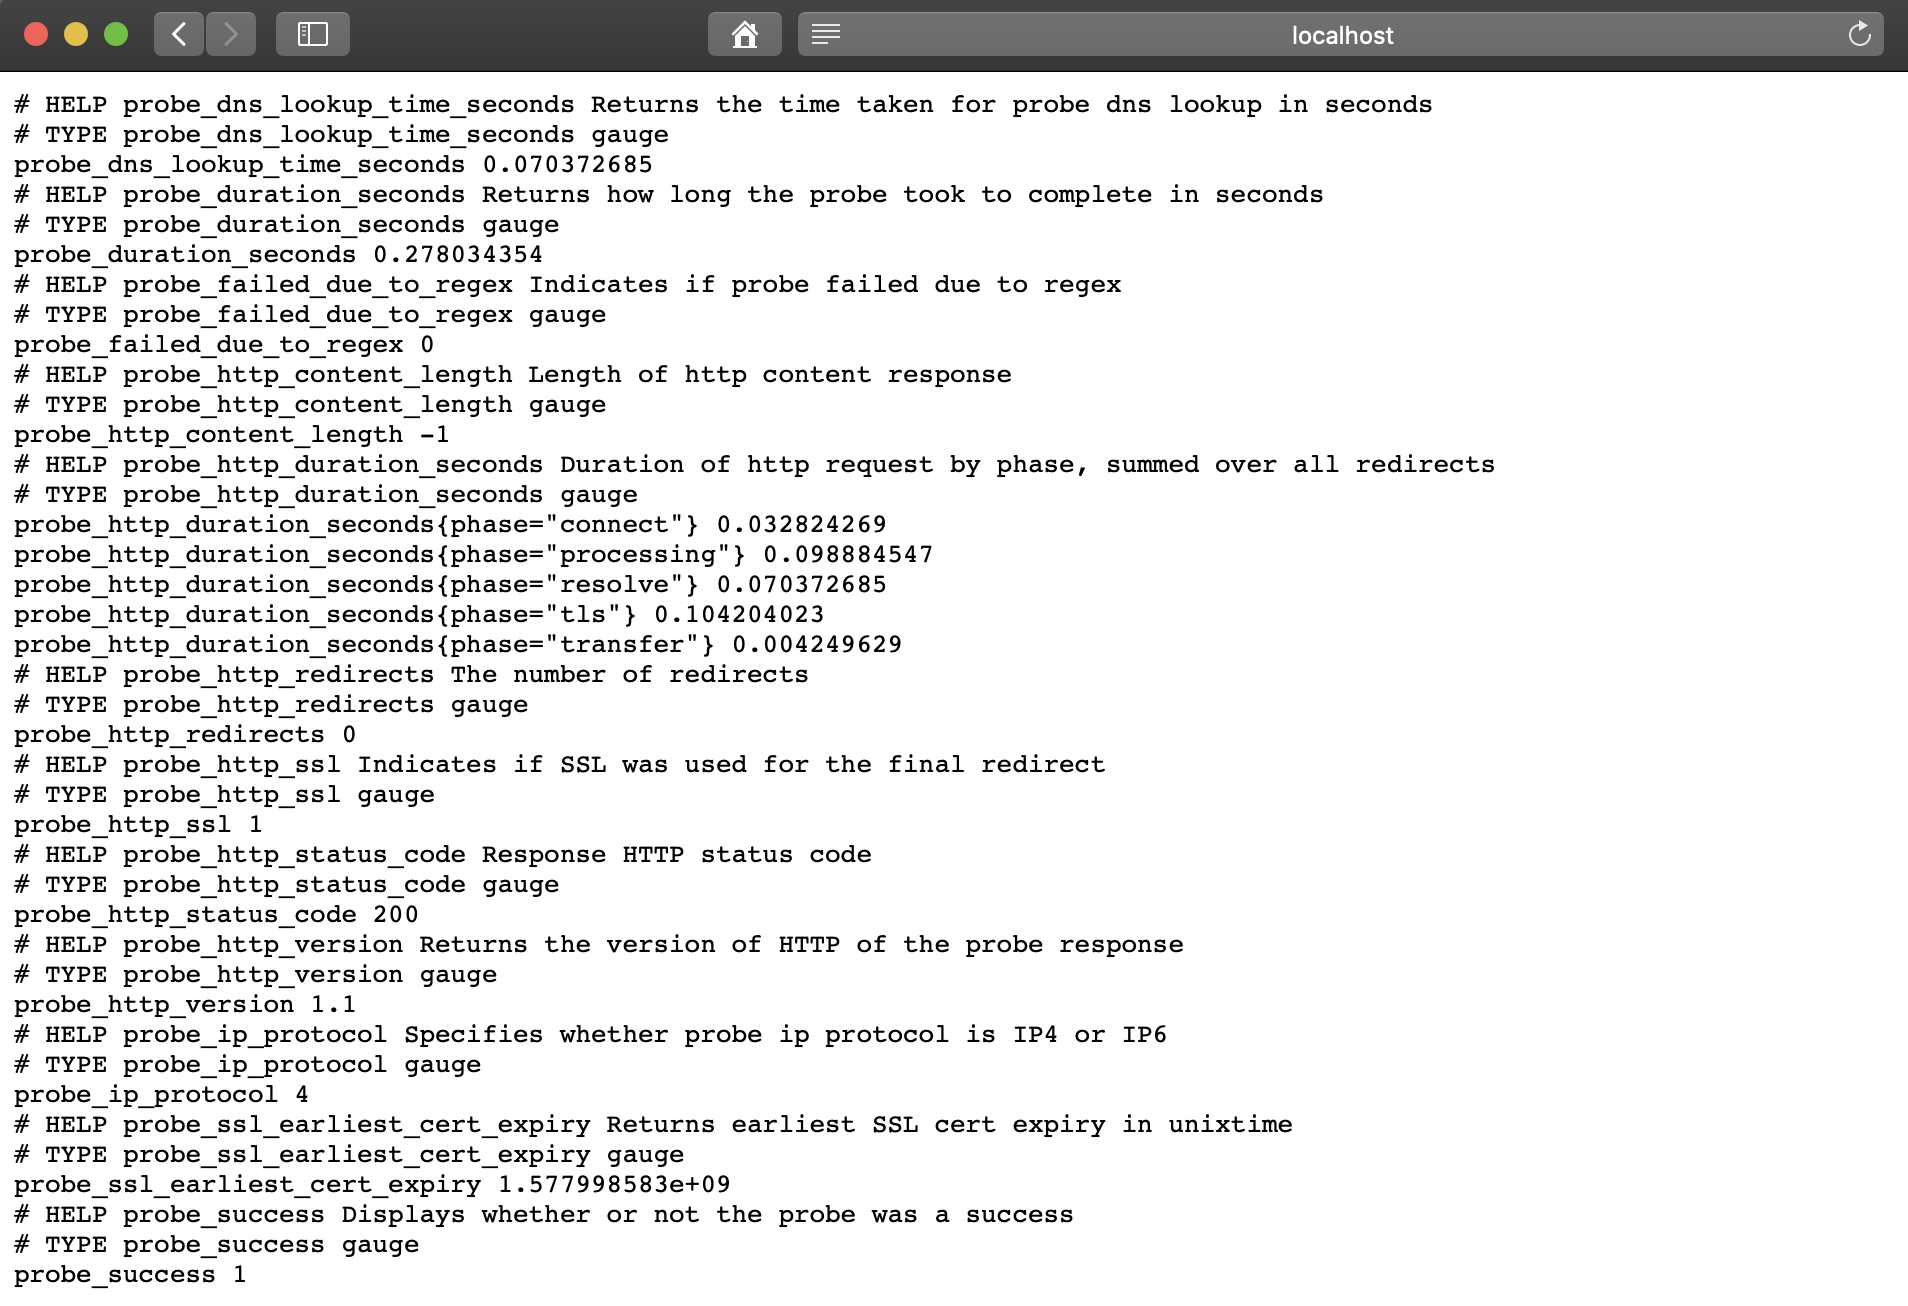 Une
Une probe_successvaleur métrique de 1 signifie une vérification réussie. Une valeur de 0 indique une erreur.Configurer Prometheus
Après avoir déployé l'exportateur BlackBox, configurez Prometheus prometheus-additional.yaml.- job_name: 'kube-api-blackbox'
scrape_interval: 1w
metrics_path: /probe
params:
module: [http_2xx]
static_configs:
- targets:
- https:
- http:
- https:
relabel_configs:
- source_labels: [__address__]
target_label: __param_target
- source_labels: [__param_target]
target_label: instance
- target_label: __address__
replacement: prometheus-blackbox-exporter:9115 # The blackbox exporter.
Générez Secretà l'aide de la commande suivante.PROMETHEUS_ADD_CONFIG=$(cat prometheus-additional.yaml | base64)
cat << EOF | kubectl --namespace=monitoring apply -f -
apiVersion: v1
kind: Secret
metadata:
name: additional-scrape-configs
type: Opaque
data:
prometheus-additional.yaml: $PROMETHEUS_ADD_CONFIG
EOF
Spécifiez additional-scrape-configspour l'opérateur Prometheus à l'aide de additionalScrapeConfigs.kubectl --namespace=monitoring edit prometheuses k8s
...
spec:
additionalScrapeConfigs:
key: prometheus-additional.yaml
name: additional-scrape-configs
Nous allons dans l'interface Web de Prometheus, vérifions les métriques et les objectifs.kubectl --namespace=monitoring port-forward svc/prometheus-k8s 9090:9090
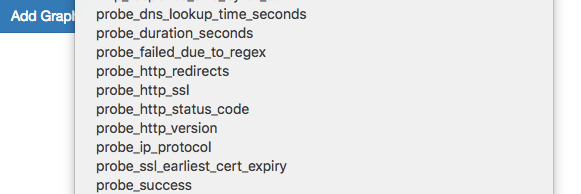
 Nous voyons les métriques et les objectifs de la Blackbox.
Ajout de règles pour les notifications (alerte)
Pour recevoir des notifications de l'exportateur Blackbox, ajoutez les règles à l'opérateur Prometheus.kubectl --namespace=monitoring edit prometheusrules prometheus-k8s-rules
...
- name: blackbox-exporter
rules:
- alert: ProbeFailed
expr: probe_success == 0
for: 5m
labels:
severity: error
annotations:
summary: "Probe failed (instance {{ $labels.instance }})"
description: "Probe failed\n VALUE = {{ $value }}\n LABELS: {{ $labels }}"
- alert: SlowProbe
expr: avg_over_time(probe_duration_seconds[1m]) > 1
for: 5m
labels:
severity: warning
annotations:
summary: "Slow probe (instance {{ $labels.instance }})"
description: "Blackbox probe took more than 1s to complete\n VALUE = {{ $value }}\n LABELS: {{ $labels }}"
- alert: HttpStatusCode
expr: probe_http_status_code <= 199 OR probe_http_status_code >= 400
for: 5m
labels:
severity: error
annotations:
summary: "HTTP Status Code (instance {{ $labels.instance }})"
description: "HTTP status code is not 200-399\n VALUE = {{ $value }}\n LABELS: {{ $labels }}"
- alert: SslCertificateWillExpireSoon
expr: probe_ssl_earliest_cert_expiry - time() < 86400 * 30
for: 5m
labels:
severity: warning
annotations:
summary: "SSL certificate will expire soon (instance {{ $labels.instance }})"
description: "SSL certificate expires in 30 days\n VALUE = {{ $value }}\n LABELS: {{ $labels }}"
- alert: SslCertificateHasExpired
expr: probe_ssl_earliest_cert_expiry - time() <= 0
for: 5m
labels:
severity: error
annotations:
summary: "SSL certificate has expired (instance {{ $labels.instance }})"
description: "SSL certificate has expired already\n VALUE = {{ $value }}\n LABELS: {{ $labels }}"
- alert: HttpSlowRequests
expr: avg_over_time(probe_http_duration_seconds[1m]) > 1
for: 5m
labels:
severity: warning
annotations:
summary: "HTTP slow requests (instance {{ $labels.instance }})"
description: "HTTP request took more than 1s\n VALUE = {{ $value }}\n LABELS: {{ $labels }}"
- alert: SlowPing
expr: avg_over_time(probe_icmp_duration_seconds[1m]) > 1
for: 5m
labels:
severity: warning
annotations:
summary: "Slow ping (instance {{ $labels.instance }})"
description: "Blackbox ping took more than 1s\n VALUE = {{ $value }}\n LABELS: {{ $labels }}"
Dans l'interface Web de Prometheus, accédez à Status => Rules et recherchez les règles d'alerte pour blackbox-exporter.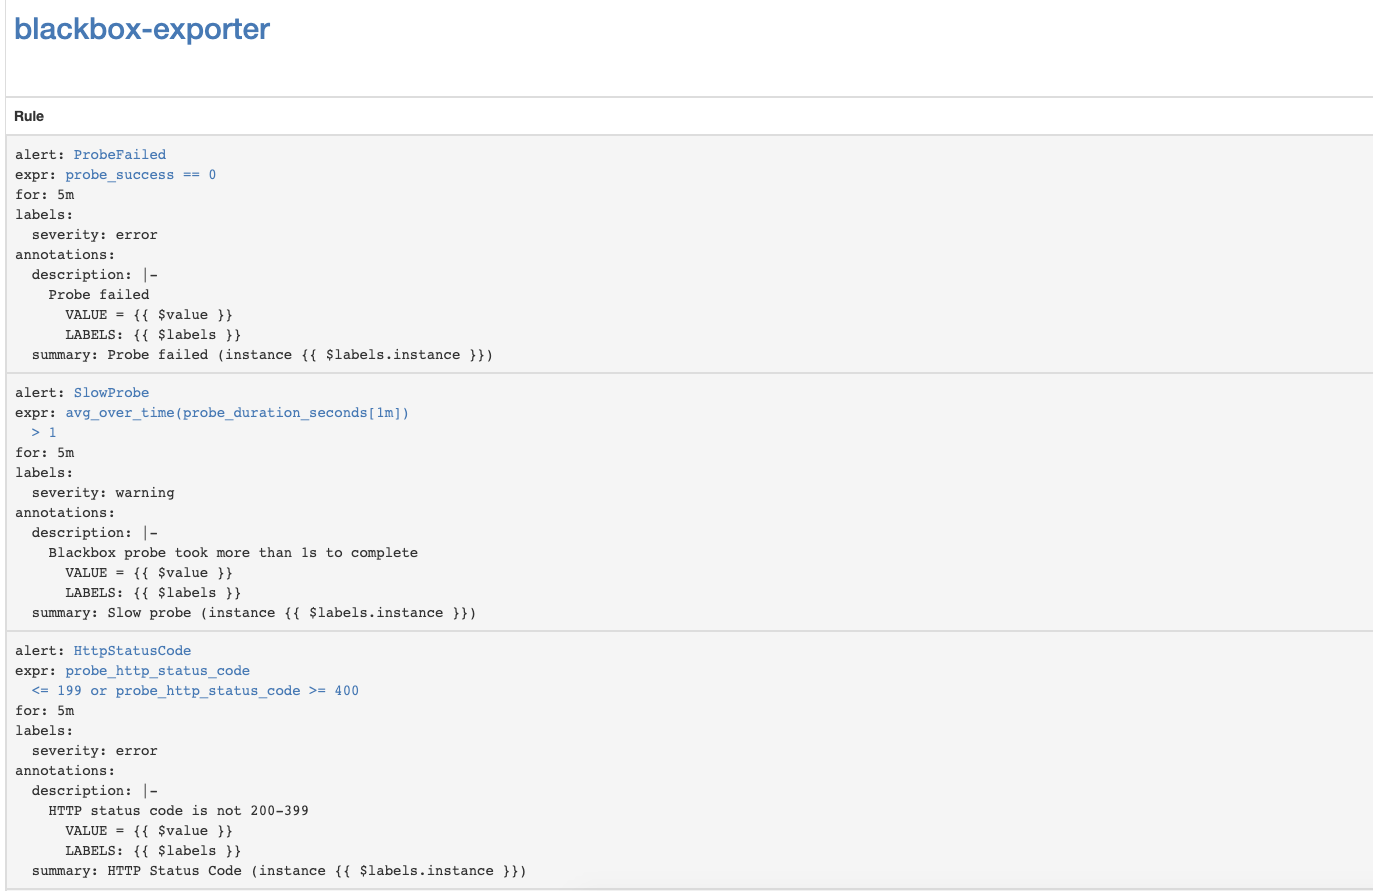
Configurer les notifications d'expiration de certificat SSL du serveur API Kubernetes
Configurons la surveillance de l'expiration des certificats SSL du serveur API Kubernetes. Il enverra des notifications une fois par semaine.Ajoutez le module d'exportation Blackbox pour l'authentification du serveur API Kubernetes.kubectl --namespace=monitoring edit configmap prometheus-blackbox-exporter
...
kube-api:
http:
method: GET
no_follow_redirects: false
preferred_ip_protocol: ip4
tls_config:
insecure_skip_verify: false
ca_file: /var/run/secrets/kubernetes.io/serviceaccount/ca.crt
bearer_token_file: /var/run/secrets/kubernetes.io/serviceaccount/token
valid_http_versions:
- HTTP/1.1
- HTTP/2
valid_status_codes: []
prober: http
timeout: 5s
Ajout de la configuration de raclage Prometheus- job_name: 'kube-api-blackbox'
metrics_path: /probe
params:
module: [kube-api]
static_configs:
- targets:
- https:
relabel_configs:
- source_labels: [__address__]
target_label: __param_target
- source_labels: [__param_target]
target_label: instance
- target_label: __address__
replacement: prometheus-blackbox-exporter:9115 # The blackbox exporter.
Appliquer Prometheus SecretPROMETHEUS_ADD_CONFIG=$(cat prometheus-additional.yaml | base64)
cat << EOF | kubectl --namespace=monitoring apply -f -
apiVersion: v1
kind: Secret
metadata:
name: additional-scrape-configs
type: Opaque
data:
prometheus-additional.yaml: $PROMETHEUS_ADD_CONFIG
EOF
Ajouter des règles d'alertekubectl --namespace=monitoring edit prometheusrules prometheus-k8s-rules
...
- name: k8s-api-server-cert-expiry
rules:
- alert: K8sAPIServerSSLCertExpiringAfterThreeMonths
expr: probe_ssl_earliest_cert_expiry{job="kube-api-blackbox"} - time() < 86400 * 90
for: 1w
labels:
severity: warning
annotations:
summary: "Kubernetes API Server SSL certificate will expire after three months (instance {{ $labels.instance }})"
description: "Kubernetes API Server SSL certificate expires in 90 days\n VALUE = {{ $value }}\n LABELS: {{ $labels }}"
Liens utiles
Surveillance et journalisation dans Docker