Lapins et boasVirus et pythonsTout ce qu'une personne a écrit, l'autre peut le déformer!La presse a beaucoup d'informations sur différents virus - histoires d'horreur, naïf, intrépidité avec folie et textes robotiques francs, mais rien de tout cela ne peut être vérifié. Par conséquent, j'ai décidé de vérifier moi-même comment et quels paramètres affectent l'état, le développement et la dégradation de la structure connectée et d'en tirer des conclusions.Passons aux choses sérieuses, nous avons des nœuds (peut-être des personnes) connectés les uns aux autres. Les nœuds sont dégradants / malades et ils peuvent être traités, mis en quarantaine et ils sont, hélas, parfois désactivés pour toujours.
w_size = 1024 * 32
max_conn = 6
infection_probably = 0.9
pr_recover = 0.75
quarantine = 5
dead = 14
import numpy as np
from tqdm import tqdm
import matplotlib
import matplotlib.pyplot as plt
from termcolor import colored
l_immun = []
l_quar = []
l_died =[]
l_infl = []
map_conn = []
map_stat = np.zeros((w_size), dtype="int16")
for i in range(w_size):
map_conn.append([])
for i in tqdm(range(w_size)):
t = np.random.randint(0, max_conn//2)
tt = np.random.randint(0, w_size, (t))
for j in tt:
map_conn[i].append(j)
map_conn[j].append(i)
for i in range(w_size):
map_conn[i] = list(set(map_conn[i]))
map_stat[:] = 0
map_stat[np.random.randint(1, w_size)] = 1
day = 1
while True:
tmp_map_conn = map_conn.copy()
tmp_map_stat = map_stat.copy()
for i in range(w_size):
if tmp_map_stat[i] < 0:
map_stat[i] = tmp_map_stat[i]
continue
if tmp_map_stat[i] >= quarantine:
map_stat[i] = tmp_map_stat[i] + 1
continue
if tmp_map_stat[i] > 0:
if np.random.rand() < pr_recover:
map_stat[i] = -tmp_map_stat[i]
else:
map_stat[i] = tmp_map_stat[i] + 1
if map_stat[i] >= quarantine:
for j in tmp_map_conn[i]:
if i in map_conn[j]:
map_conn[j].remove(i)
map_conn[i] = []
continue
if tmp_map_stat[i] == 0:
map_stat[i] = 0
for j in tmp_map_conn[i]:
t = np.random.rand()
if (
t < infection_probably
and tmp_map_stat[j] > 0
and tmp_map_stat[j] < quarantine
):
map_stat[i] = 1
break
immun = np.count_nonzero(map_stat < 0)
quar = np.count_nonzero((map_stat >= quarantine) & (map_stat < dead))
died = np.count_nonzero(map_stat >= dead)
infl = np.sum((map_stat > 0) & (map_stat < dead))
print(
"day {0:3d} infected {1:6d} recovered {2:6d} quarantine {3:6d} died {4:6d}".format(
day, infl, immun, quar, died
)
)
l_immun.append(immun)
l_quar.append(quar)
l_died.append(died)
l_infl.append(infl)
if infl == 0:
break
day += 1
print ("\n{:6d} point number ".format(w_size))
print ("{:4d} maximum number of links ".format(max_conn))
print ("{:3.2f} the probability of infection in a single contact ".format(infection_probably))
print ("{:3.2f} chance to recover in one day ".format(pr_recover))
print ("{:4d} the number of days before the detection of the disease and the beginning of quarantine".format(quarantine))
print ("{:4d} number of treatment days to death".format(dead))
t = np.arange(0, day, 1.)
print (colored("the number of recovered ", "red"))
print (colored("the number in quarantine ", "green"))
print ("the number of died ")
print (colored("the number of infected ", "blue"))
fig, ax = plt.subplots()
ax.plot(t, l_immun, color='red')
ax.plot(t, l_quar, color='green')
ax.plot(t, l_died, color='black')
ax.plot(t, l_infl, color='blue')
ax.set(xlabel='time (days)', ylabel='number',
title='virus behavior')
ax.grid()
fig.savefig("test.png")
plt.show()
Voici le temps de dire - alors quoi, qu'une douzaine de lignes de python peuvent ouvrir ça!Le résultat a été intéressant et utile pour moi.day 1 infected 2 recovered 1 quarantine 0 died 0
day 2 infected 4 recovered 2 quarantine 0 died 0
day 3 infected 10 recovered 4 quarantine 0 died 0
day 4 infected 12 recovered 9 quarantine 0 died 0
day 5 infected 11 recovered 20 quarantine 0 died 0
day 6 infected 21 recovered 28 quarantine 0 died 0
day 7 infected 39 recovered 43 quarantine 0 died 0
day 8 infected 66 recovered 72 quarantine 0 died 0
day 9 infected 92 recovered 120 quarantine 0 died 0
day 10 infected 127 recovered 197 quarantine 0 died 0
day 11 infected 211 recovered 292 quarantine 1 died 0
day 12 infected 352 recovered 446 quarantine 1 died 0
day 13 infected 578 recovered 714 quarantine 1 died 0
day 14 infected 949 recovered 1151 quarantine 1 died 0
day 15 infected 1492 recovered 1841 quarantine 1 died 0
day 16 infected 2192 recovered 2954 quarantine 2 died 0
day 17 infected 3045 recovered 4612 quarantine 3 died 0
day 18 infected 3995 recovered 6902 quarantine 8 died 0
day 19 infected 4617 recovered 9889 quarantine 14 died 0
day 20 infected 4595 recovered 13385 quarantine 16 died 1
day 21 infected 3880 recovered 16847 quarantine 26 died 1
day 22 infected 2887 recovered 19722 quarantine 41 died 1
day 23 infected 1834 recovered 21859 quarantine 58 died 1
day 24 infected 1106 recovered 23203 quarantine 67 died 1
day 25 infected 688 recovered 23977 quarantine 75 died 2
day 26 infected 412 recovered 24422 quarantine 85 died 3
day 27 infected 249 recovered 24679 quarantine 83 died 8
day 28 infected 174 recovered 24796 quarantine 80 died 14
day 29 infected 112 recovered 24873 quarantine 81 died 17
day 30 infected 86 recovered 24894 quarantine 71 died 27
day 31 infected 60 recovered 24906 quarantine 58 died 42
day 32 infected 42 recovered 24908 quarantine 41 died 59
day 33 infected 33 recovered 24909 quarantine 32 died 68
day 34 infected 23 recovered 24910 quarantine 23 died 77
day 35 infected 12 recovered 24910 quarantine 12 died 88
day 36 infected 9 recovered 24910 quarantine 9 died 91
day 37 infected 6 recovered 24910 quarantine 6 died 94
day 38 infected 2 recovered 24910 quarantine 2 died 98
day 39 infected 2 recovered 24910 quarantine 2 died 98
day 40 infected 0 recovered 24910 quarantine 0 died 100
32768 point number
6 maximum number of links
0.90 the probability of infection in a single contact
0.75 chance to recover in one day
5 the number of days before the detection of the disease and the beginning of quarantine
14 number of treatment days to death
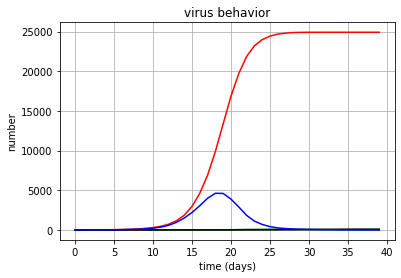 C'est ce qui s'est passé (et je serais heureux si quelqu'un vérifie et pousse une erreur): avec infection_probably = 0.9 et max_conn = 6, c'est-à-dire avec une infectiosité terrible et avec un minimum de communication - 6 contacts par jour - il n'y a pas de dégradation de masse. Une dizaine de lancements ne sont certes pas des statistiques, mais assez pour moi.Mais avec infection_probably = 0,1 et max_conn = 40, la moitié meurt. Ceux. une attaque mal infligée avec une grande cohésion de la communauté détruit la moitié de ses membres. De plus, cela ne dépend pas de la valeur de quarantaine.