I often have to deal with debugging.Sometimes I set a breakpoint, but I understand that it is too late, and we must start all over again.Moreover, before starting debugging, I prepare the data, clear the database of unnecessary records. All in order to forget to go into a seemingly harmless method and start the whole process anew.Complicated by the fact that you have to work with legacy code, which is sometimes difficult to understand.Is it possible to better understand the confusing code? But what if we can understand such code faster than the one who wrote it?MeetPyTrace is a Time-Travel Debugging Tracer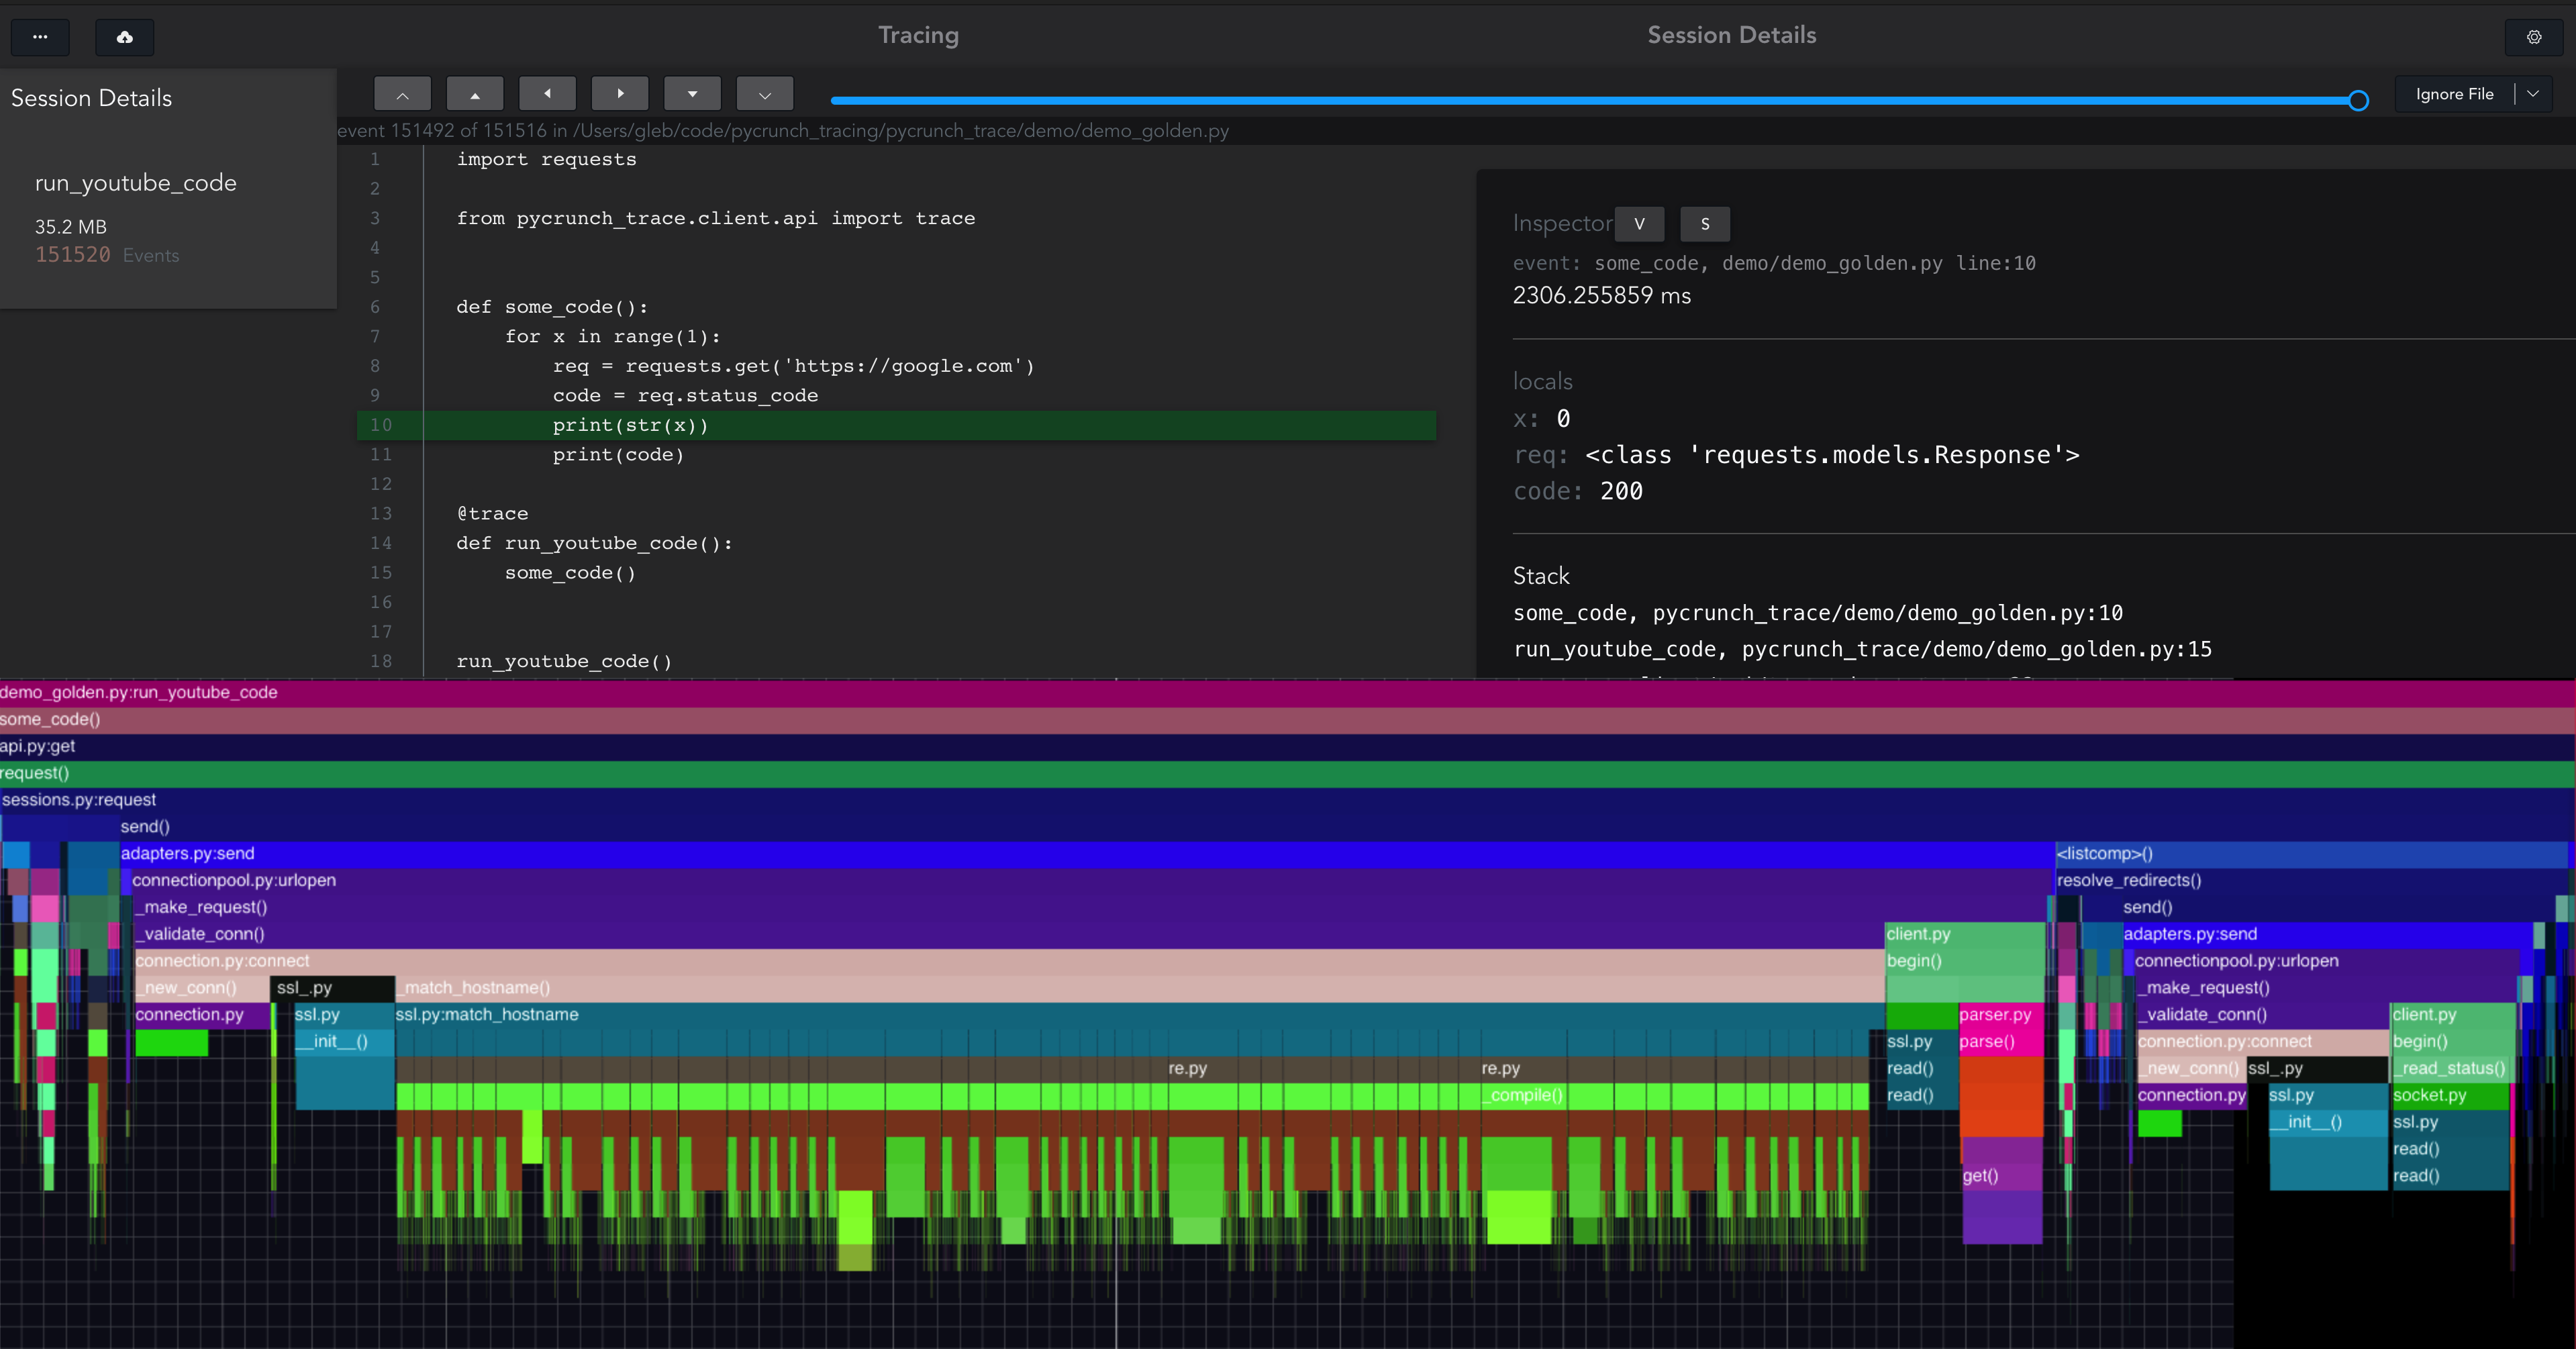 The main differences from the traditional debugger:
- A session is recorded once, and you can play it an infinite number of times.
- Now you can not be afraid to forget to click Step Into, you can always go back and go to the function of interest.
- There is no more point in using `print`. All variables are visible in the inspector at each moment in time.
Also, using the built-in Flame Chart, you can quickly “dive” into the method of interest and see what really happened there: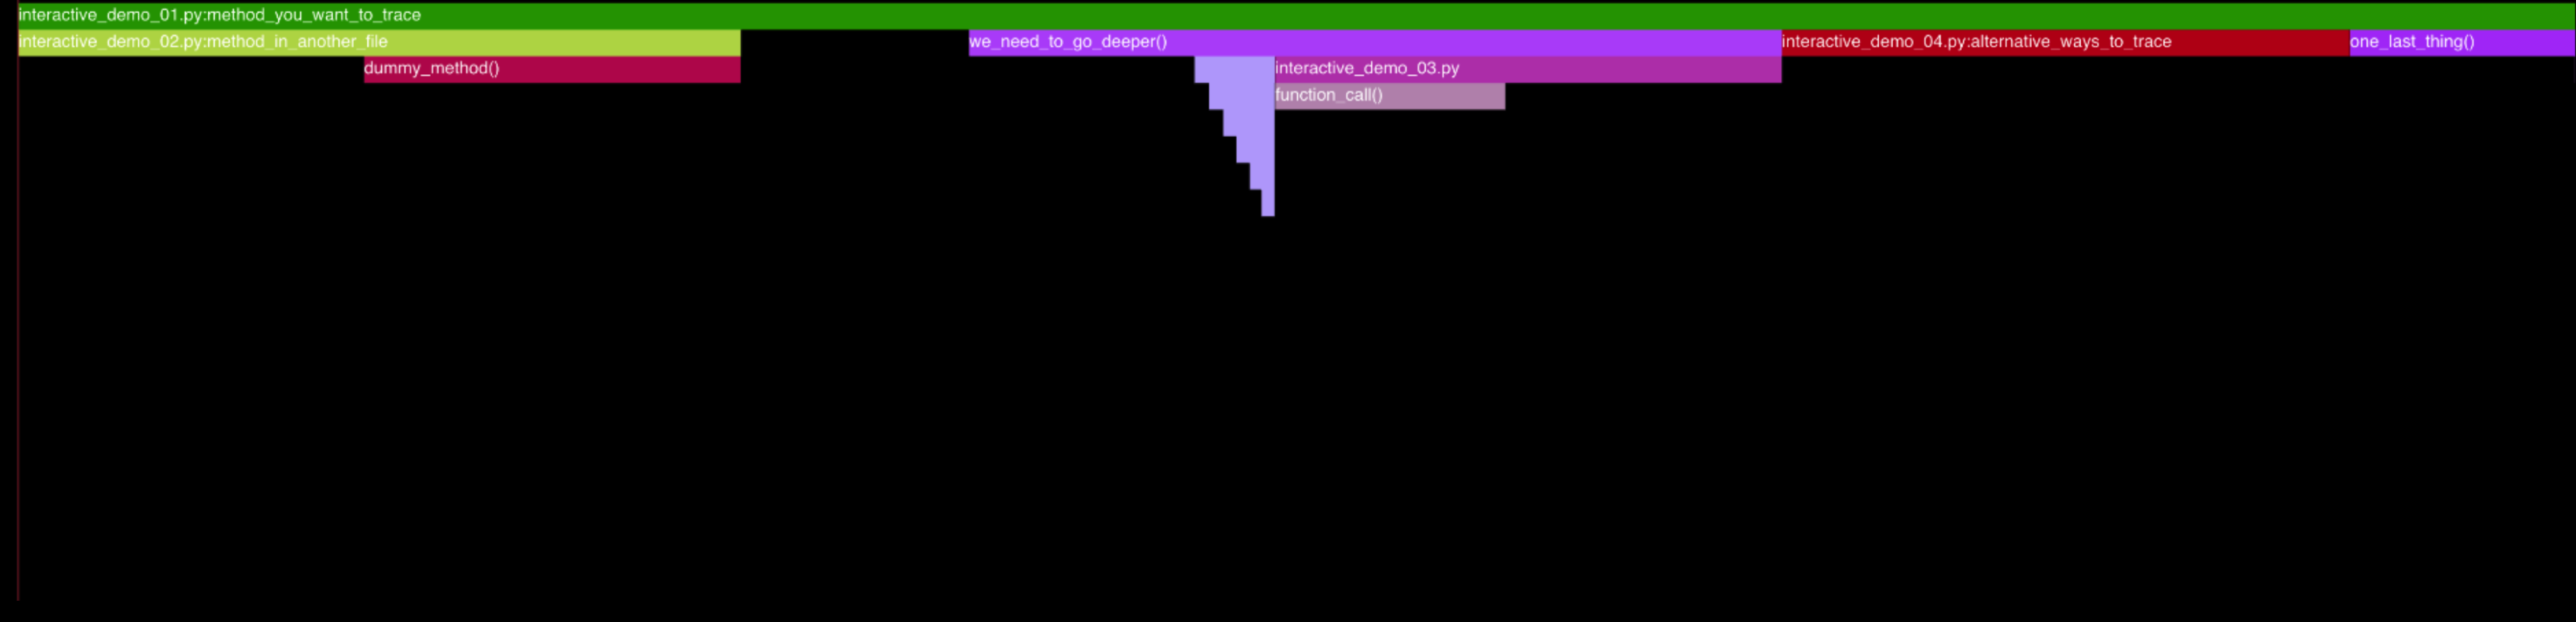 [Command] + Click in order to zoom in on the function of interest[Shift] + Click on the method, transfers for a moment, when the function is about to return.Hot Key Tutorial:( in text form )What is recorded at runtime:
- Local variables
- Incoming and Returning Values
- Time since recording started
- Call stack
Also, the content of the source files is written to the replay file at the time the debugger is started.In order to try on your project:
1. Install the pip package:pip install pycrunch-trace
2. Add decorator trace on the method of interest:from pycrunch_trace.client.api import trace
@trace
def run():
some_code()
3. Run the code!The replay will be recorded in the working directory. It can be viewed using the web application: app.pytrace.com(data is not sent anywhere, all work with the recording occurs locally in the browser)I usually add an @traceattribute to the Django View methods.Interactive demo
I recommend to go through an interactive demo to get acquainted with all the features.References
Github:Pip packageWeb application for viewing recorded sessions.Website:https://pytrace.com/Video of the main functionality: