It often happens that most of the application is made up of various lists and tables. In order not to reinvent the wheel every time, I, like many, often used Angular Material tables .Later, these tables grew, both text data and nested elements were placed in cells. All this grows and becomes a good load on the user's machine. And of course, nobody likes this.In my last home project, there was a table whose cells were mostly filled with various fields (you could even say that it was one big form).And rendering it took about 8 seconds (40 x 40 table).So how can you optimize MatTable for large lists?
Test case
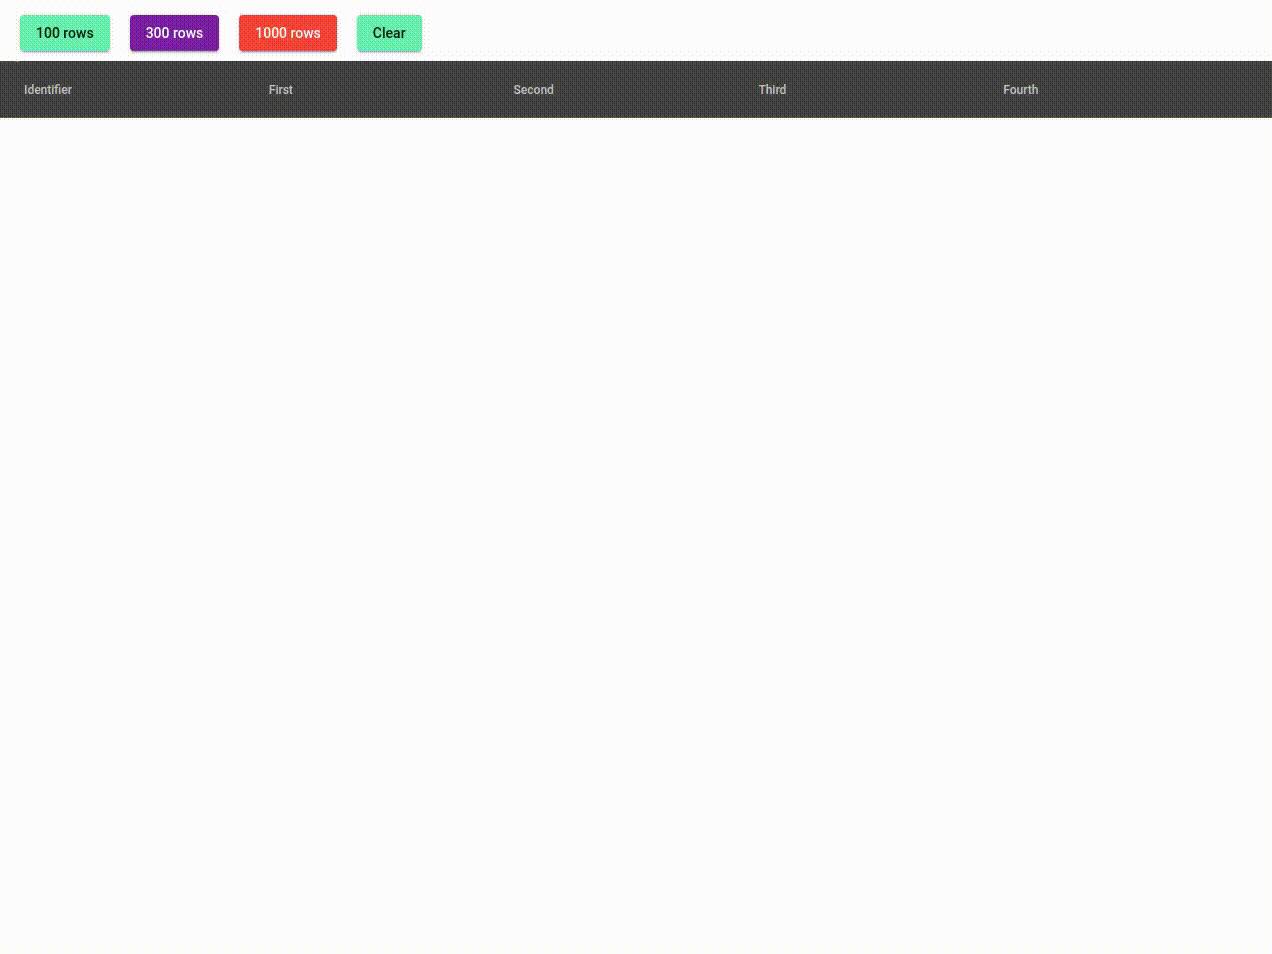
In order to help others deal with this problem, I wrote a small test application. All the same MatTable table, with five columns (the first is the id of the element, the rest are regular MatFormField text fields). It would seem that it is a simple table, but even rendering 100 the drain of such a table takes neither more nor less than 2 seconds (Oh, this material and its "top" performance).
 The rendering itself in this case took only (860 ms), however, the page froze for 2.2 seconds and the user was upset.Well, let's try rendering a table with 300 rows. And the drum roll, we are waiting a bit and we see that almost 10 seconds were spent on scripting and rendering in total. That is, in the case when the user wants to display such a table in 300 rows, his page will freeze for 10 seconds. This is very scary and amazing (actually not).
 In fact, I was still trying to make a measurement of the time it would take to draw 1000 elements, but my pathetic i7 could not stand it and the page was constantly falling off.We will try to do this later with the solution already applied.
Solution to the problem
And so, everyone can take measurements using browser-based utilities, but there is no solution to this problem.This decision was led to me by reasoning over the very essence of the problem.a correct understanding of the problem is already at least half of its solution.
I think everyone understands that this is happening because the table data is first processed by scripts and then spit out in one piece . In turn, this is precisely why we see a characteristic suspension.Problem found. Now it remains to figure out how to solve it. The very first solution comes to mind. If the problem is processing all the data at once, then you need to make the table process the data in parts.But how to do that?Let's think what we have for this out of the box. The first thing that comes to mind is the Track By function. When changing the datasource, the entire table will not be re-rendered, but only its changes.Let's add this function to our table:<mat-table [trackBy]="trackByFn" [dataSource]="commonDataSource">
Well, but we don’t have such a condition that the table data is somehow changing, and this is not what the conversation is about now. But what if we write Pipe, which, when initializing the data source, will break the data and give it to the table in batches. In turn, the trackBy function will help to avoid a full renderer.@Pipe({
name: 'splitSchedule'
})
export class SplitPipe implements PipeTransform {
public transform(value: any, takeBy: number = 4, throttleTime: number = 40): Observable<Array<any>> {
return Array.isArray(value)
? this.getSplittedThread(value, takeBy, throttleTime)
: of(value);
}
private getSplittedThread(data: Array<any>, takeBy: number, throttleTime: number): Observable<Array<any>> {
const repeatNumber = Math.ceil(data.length / takeBy);
return timer(0, throttleTime).pipe(
map((current) => data.slice(0, takeBy * ++current)),
take(repeatNumber)
);
}
}
Here is such a small piece of code that will help your hardware render such large tables.Apply this pipe to our data source.
<mat-table [trackBy]="trackByFn"
           [dataSource]="commonDataSource | splitSchedule | async">
Now let's try to take measurements. Render 100, 300 and 1000 elements.

 And what do we see? What really success is not what we expected:
- 300 elements rendered 1 second faster
- 1000 rendered in 11 seconds and the tab didn't die
- and 100 elements generally rendered 150 ms longer
But do not rush to draw conclusions, let's first look at the behavior of the page in both cases.
 As you can see, in the usual case, the page freezes for a few seconds and the user can do nothing at this moment, while using our pipe with a link to trackBy gives the user almost instantaneous table initialization and does not cause any discomfort while using the application.Hope this article helps someone.The source code for the test application is on Stack Blitz .