In a previous article, where I talked about monitoring a PostgreSQL database , there was such a phrase:Grow wait- the application has "rested" on someone 's locks . If this is a past one-time anomaly - an occasion to understand the original reason.
This situation is one of the most unpleasant for the DBA:- at first glance, the base is working
- no server resources are exhausted
- ... but some of the requests "slow down"
 The chances of catching the locks “in the moment” are extremely small, and they can last only a few seconds, but worsening the planned execution time of the request tens of times. But you just don’t want to sit and catch what is happening online, but in a relaxed atmosphere to figure out after the fact
 which of the developers to punish what exactly was the problem - who, with whom and because of which resource of the database came into conflict.But how? Indeed, in contrast to the request with its plan, which allows you to understand in detail what the resources went for and how long it took, the lock does not leave such obvious traces ...Unless a short log entry: But let's try to catch it!process ... still waiting for ...
We catch the lock in the log
But even for at least this line to appear in the log, the server must be correctly configured:log_lock_waits = 'on'
... and set a minimum border for our analysis:deadlock_timeout = '100ms'
When the parameter is enabled log_lock_waits, this parameter also determines after what time messages about waiting for blocking will be written to the server log. If you are trying to investigate the delays caused by locks, it makes sense to reduce it compared to the usual value deadlock_timeout.
All deadlocks that do not have time to "untie" during this time will be torn. And here are the “usual” locks - dumped into the log by several entries:2019-03-27 00:06:46.026 MSK [38162:84/166010018] [inside.tensor.ru] [local] csr-inside-bl10:10081: MergeRequest LOG: process 38162 still waiting for ExclusiveLock on advisory lock [225382138,225386226,141586103,2] after 100.047 ms
2019-03-27 00:06:46.026 MSK [38162:84/166010018] [inside.tensor.ru] [local] csr-inside-bl10:10081: MergeRequest DETAIL: Process holding the lock: 38154. Wait queue: 38162.
2019-03-27 00:06:46.026 MSK [38162:84/166010018] [inside.tensor.ru] [local] csr-inside-bl10:10081: MergeRequest CONTEXT: SQL statement "SELECT pg_advisory_xact_lock( '""'::regclass::oid::integer, 141586103::integer )"
PL/pgSQL function inline_code_block line 2 at PERFORM
2019-03-27 00:06:46.026 MSK [38162:84/166010018] [inside.tensor.ru] [local] csr-inside-bl10:10081: MergeRequest STATEMENT: DO $$ BEGIN
PERFORM pg_advisory_xact_lock( '""'::regclass::oid::integer, 141586103::integer );
EXCEPTION
WHEN query_canceled THEN RETURN;
END; $$;
…
2019-03-27 00:06:46.077 MSK [38162:84/166010018] [inside.tensor.ru] [local] csr-inside-bl10:10081: MergeRequest LOG: process 38162 acquired ExclusiveLock on advisory lock [225382138,225386226,141586103,2] after 150.741 ms
This example shows that we had only 50ms from the moment the lock appeared in the log to the moment of its resolution. Only in this interval can we get at least some information about it, and the faster we are able to do this, the more locks we can analyze.Here the most important information for us is the PID of the process that is waiting for the lock. It is on it that we can compare information between the log and the state of the database. And at the same time to find out how problematic a particular lock was - that is, how long it "hung".To do this, we only need a couple of RegExp on the content LOGrecord:const RE_lock_detect = /^process (\d+) still waiting for (.*) on (.*) after (\d+\.\d{3}) ms(?: at character \d+)?$/;
const RE_lock_acquire = /^process (\d+) acquired (.*) on (.*) after (\d+\.\d{3}) ms(?: at character \d+)?$/;
We get to the log
Actually, it remains a little - to take the log, learn how to monitor it and respond accordingly.We already have everything for this - an online log parser and a pre-activated database connection, which I talked about in an article about our PostgreSQL monitoring system :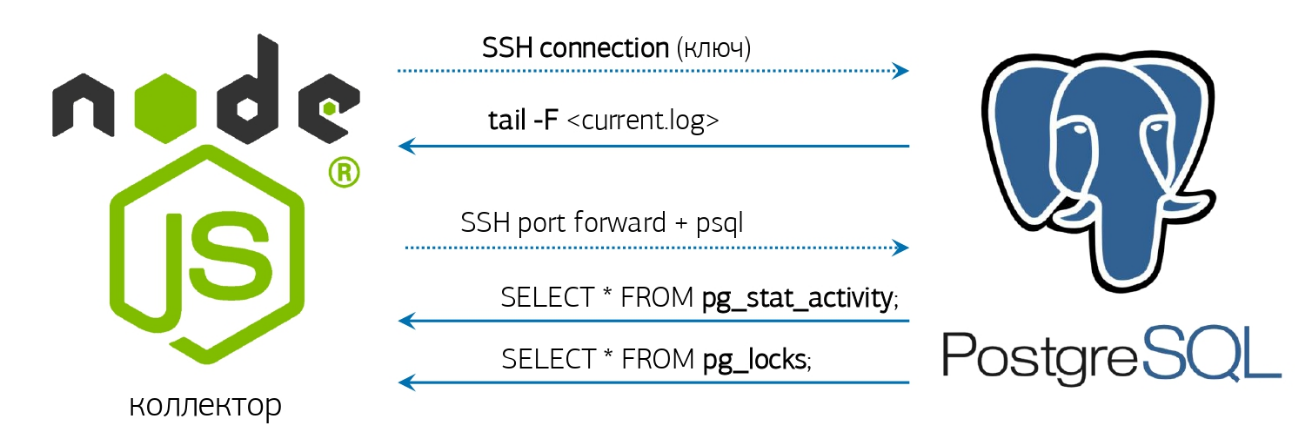 But if you don’t have any similar system deployed, then it’s okay, we’ll do everything "Right from the console"!If the installed version of PostgreSQL 10 and higher is lucky, because there appeared the function pg_current_logfile () , which explicitly gives the name of the current log file. Getting it from the console will be easy enough:
psql -U postgres postgres -t -A -c "SELECT CASE WHEN substr(current_setting('log_directory'), 1, 1) <> '/' THEN current_setting('data_directory') ELSE '' END || '/' || pg_current_logfile()"
If the version is suddenly younger - everything will turn out, but a little more complicated:ps uw -U postgres \
| grep [l]ogger \
| awk '{print "/proc/"$2"/fd"}' \
| xargs ls -l \
| grep `cd; psql -U postgres postgres -t -A -c "SELECT CASE WHEN substr(current_setting('log_directory'), 1, 1) = '/' THEN current_setting('log_directory') ELSE current_setting('data_directory') || '/' || current_setting('log_directory') END"` \
| awk '{print $NF}'
We tail -fget the full file name, which we give in and will catch the appearance there 'still waiting for'.Well, as soon as something arose in this thread, we call ...Parsing Request
Alas, the object of blocking in the log is by no means always the resource that caused the conflict. For example, if you try to create an index of the same name in parallel, there will only be something like that in the log still waiting for ExclusiveLock on transaction 12345.Therefore, we will have to remove the state of all locks from the database for the process of interest to us. And information only about a pair of processes (who put the lock on / who expects it) is not enough, because often there is a “chain” of expectations of different resources between transactions:tx1 [resA] -> tx2 [resA]
tx2 [resB] -> tx3 [resB]
...
Classic: “Grandfather for turnip, grandmother for grandfather, granddaughter for grandmother, ...”Therefore, we will write a request that will tell us exactly who became the root cause of troubles along the entire chain of locks for a specific PID:WITH RECURSIVE lm AS (
SELECT
rn
, CASE
WHEN lm <> 'Share' THEN row_number() OVER(PARTITION BY lm <> 'Share' ORDER BY rn)
END rx
, lm || 'Lock' lm
FROM (
SELECT
row_number() OVER() rn
, lm
FROM
unnest(
ARRAY[
'AccessShare'
, 'RowShare'
, 'RowExclusive'
, 'ShareUpdateExclusive'
, 'Share'
, 'ShareRowExclusive'
, 'Exclusive'
, 'AccessExclusive'
]
) T(lm)
) T
)
, lt AS (
SELECT
row_number() OVER() rn
, lt
FROM
unnest(
ARRAY[
'relation'
, 'extend'
, 'page'
, 'tuple'
, 'transactionid'
, 'virtualxid'
, 'object'
, 'userlock'
, 'advisory'
, ''
]
) T(lt)
)
, lmx AS (
SELECT
lr.rn lrn
, lr.rx lrx
, lr.lm lr
, ld.rn ldn
, ld.rx ldx
, ld.lm ld
FROM
lm lr
JOIN
lm ld ON
ld.rx > (SELECT max(rx) FROM lm) - lr.rx OR
(
(lr.rx = ld.rx) IS NULL AND
(lr.rx, ld.rx) IS DISTINCT FROM (NULL, NULL) AND
ld.rn >= (SELECT max(rn) FROM lm) - lr.rn
)
)
, lcx AS (
SELECT DISTINCT
(lr.locktype, lr.database, lr.relation, lr.page, lr.tuple, lr.virtualxid, lr.transactionid::text::bigint, lr.classid, lr.objid, lr.objsubid) target
, ld.pid ldp
, ld.mode ldm
, lr.pid lrp
, lr.mode lrm
FROM
pg_locks ld
JOIN
pg_locks lr ON
lr.pid <> ld.pid AND
(lr.locktype, lr.database, lr.relation, lr.page, lr.tuple, lr.virtualxid, lr.transactionid::text::bigint, lr.classid, lr.objid, lr.objsubid) IS NOT DISTINCT FROM (ld.locktype, ld.database, ld.relation, ld.page, ld.tuple, ld.virtualxid, ld.transactionid::text::bigint, ld.classid, ld.objid, ld.objsubid) AND
(lr.granted, ld.granted) = (TRUE, FALSE)
JOIN
lmx ON
(lmx.lr, lmx.ld) = (lr.mode, ld.mode)
WHERE
(ld.pid, ld.granted) = ($1::integer, FALSE)
)
SELECT
lc.locktype "type"
, CASE lc.locktype
WHEN 'relation' THEN ARRAY[relation::text]
WHEN 'extend' THEN ARRAY[relation::text]
WHEN 'page' THEN ARRAY[relation, page]::text[]
WHEN 'tuple' THEN ARRAY[relation, page, tuple]::text[]
WHEN 'transactionid' THEN ARRAY[transactionid::text]
WHEN 'virtualxid' THEN regexp_split_to_array(virtualxid::text, '/')
WHEN 'object' THEN ARRAY[classid, objid, objsubid]::text[]
WHEN 'userlock' THEN ARRAY[classid::text]
WHEN 'advisory' THEN ARRAY[classid, objid, objsubid]::text[]
END target
, lc.pid = lcx.ldp "locked"
, lc.pid
, regexp_replace(lc.mode, 'Lock$', '') "mode"
, lc.granted
, (lc.locktype, lc.database, lc.relation, lc.page, lc.tuple, lc.virtualxid, lc.transactionid::text::bigint, lc.classid, lc.objid, lc.objsubid) IS NOT DISTINCT FROM lcx.target "conflict"
FROM
lcx
JOIN
pg_locks lc ON
lc.pid IN (lcx.ldp, lcx.lrp);
Problem # 1 - Slow Start
As you can see in the example from the log, next to the line signaling the occurrence of a lock ( LOG), there are 3 more lines ( DETAIL, CONTEXT, STATEMENT) reporting extended information.First, we waited for the formation of a complete “package” of all 4 entries and only after that we turned to the database. But we can complete the formation of the package only when the next (already 5th!) Record arrives, with the details of another process, or by timeout. It is clear that both options provoke unnecessary waiting.To get rid of these delays, we switched to stream processing of lock records . That is, now we turn to the target database as soon as we have sorted the first record, and realized that it was the lock described there.Problem # 2 - slow request
But still, some of the locks did not have time to be analyzed. They began to dig deeper - and found out that on some servers our analyzing request is executed for 15-20ms !The reason turned out to be commonplace - the total number of active locks on the base, reaching several thousand: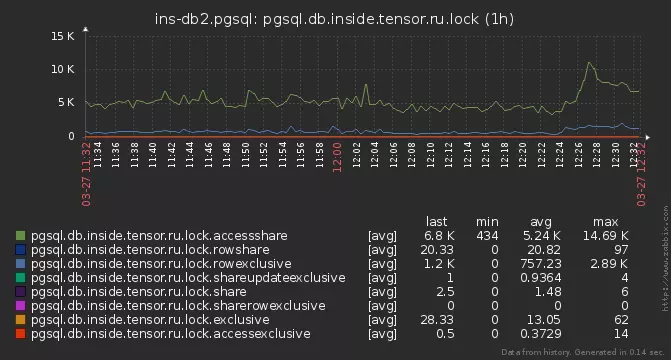
pg_locks
Here it should be noted that locks in PostgreSQL are not “stored” anywhere, but are presented only in the system view pg_locks , which is a direct reflection of the function pg_lock_status. And in our request we read from it three times ! In the meantime, we read these thousands of lock instances, and discard those that are not related to our PID, the lock itself managed to "resolve" ... Thesolution was to "materialize" the state of pg_locks in the CTE - after that, you can run through it as many times as you like, it’s already does not change. Moreover, after sitting on the algorithm, it was possible to reduce everything to just two of its scans.Excessive Dynamics
And if even a little closer look at the query above, we can see that the CTE lmand lmxnot in any way tied to the data, but simply calculate always the same "static" matrix definition of conflict between modes blocking . So let's just set it as a quality VALUES.Problem # 3 - neighbors
But part of the locks were still skipped. Usually this happened according to the following scheme - someone blocked a popular resource, and several processes quickly and quickly ran into it or along a chain further .As a result, we caught the first PID, went to the target base (and in order not to overload it, we keep only one connection), did the analysis, returned with the result, took the next PID ... But life is not worth it on the base, and PID lock # 2 is already gone!Actually, why do we need to go to the database for each PID separately, if we still filter the locks from the general list in the request? Let's take immediately the entire list of conflicting processes directly from the database and distribute their locks across all PIDs that fell during the execution of the request:WITH lm(ld, lr) AS (
VALUES
('AccessShareLock', '{AccessExclusiveLock}'::text[])
, ('RowShareLock', '{ExclusiveLock,AccessExclusiveLock}'::text[])
, ('RowExclusiveLock', '{ShareLock,ShareRowExclusiveLock,ExclusiveLock,AccessExclusiveLock}'::text[])
, ('ShareUpdateExclusiveLock', '{ShareUpdateExclusiveLock,ShareLock,ShareRowExclusiveLock,ExclusiveLock,AccessExclusiveLock}'::text[])
, ('ShareLock', '{RowExclusiveLock,ShareUpdateExclusiveLock,ShareRowExclusiveLock,ExclusiveLock,AccessExclusiveLock}'::text[])
, ('ShareRowExclusiveLock', '{RowExclusiveLock,ShareUpdateExclusiveLock,ShareLock,ShareRowExclusiveLock,ExclusiveLock,AccessExclusiveLock}'::text[])
, ('ExclusiveLock', '{RowShareLock,RowExclusiveLock,ShareUpdateExclusiveLock,ShareLock,ShareRowExclusiveLock,ExclusiveLock,AccessExclusiveLock}'::text[])
, ('AccessExclusiveLock', '{AccessShareLock,RowShareLock,RowExclusiveLock,ShareUpdateExclusiveLock,ShareLock,ShareRowExclusiveLock,ExclusiveLock,AccessExclusiveLock}'::text[])
)
, locks AS (
SELECT
(
locktype
, database
, relation
, page
, tuple
, virtualxid
, transactionid::text::bigint
, classid
, objid
, objsubid
) target
, *
FROM
pg_locks
)
, ld AS (
SELECT
*
FROM
locks
WHERE
NOT granted
)
, lr AS (
SELECT
*
FROM
locks
WHERE
target::text = ANY(ARRAY(
SELECT DISTINCT
target::text
FROM
ld
)) AND
granted
)
, lcx AS (
SELECT DISTINCT
lr.target
, ld.pid ldp
, ld.mode ldm
, lr.pid lrp
, lr.mode lrm
FROM
ld
JOIN
lr
ON lr.pid <> ld.pid AND
lr.target IS NOT DISTINCT FROM ld.target
)
SELECT
lc.locktype "type"
, CASE lc.locktype
WHEN 'relation' THEN
ARRAY[relation::text]
WHEN 'extend' THEN
ARRAY[relation::text]
WHEN 'page' THEN
ARRAY[relation, page]::text[]
WHEN 'tuple' THEN
ARRAY[relation, page, tuple]::text[]
WHEN 'transactionid' THEN
ARRAY[transactionid::text]
WHEN 'virtualxid' THEN
regexp_split_to_array(virtualxid::text, '/')
WHEN 'object' THEN
ARRAY[classid, objid, objsubid]::text[]
WHEN 'userlock' THEN
ARRAY[classid::text]
WHEN 'advisory' THEN
ARRAY[classid, objid, objsubid]::text[]
END target
, lc.pid = lcx.ldp as locked
, lc.pid
, regexp_replace(lc.mode, 'Lock$', '') "mode"
, lc.granted
, lc.target IS NOT DISTINCT FROM lcx.target as conflict
FROM
lcx
JOIN
locks lc
ON lc.pid IN (lcx.ldp, lcx.lrp);
Now we have time to analyze even the locks that exist only 1-2 ms after getting into the log.Analyze this
Actually, why did we try so long? What does this give us as a result? ..type | target | locked | pid | mode | granted | conflict
---------------------------------------------------------------------------------------
relation | {225388639} | f | 216547 | AccessShare | t | f
relation | {423576026} | f | 216547 | AccessShare | t | f
advisory | {225386226,194303167,2} | t | 24964 | Exclusive | f | t
relation | {341894815} | t | 24964 | AccessShare | t | f
relation | {416441672} | f | 216547 | AccessShare | t | f
relation | {225964322} | f | 216547 | AccessShare | t | f
...
In this plate, values targetwith a type are useful to us relation, because each such value is an OID of a table or index . Now there is very little left - to learn to interrogate the database for OIDs still unknown to us, in order to translate them into a human-readable form:SELECT $1::oid::regclass;
Now, knowing the full “matrix” of locks and all the objects on which they were superimposed by each of the transactions, we can conclude “what happened at all” and what resource caused the conflict, even if the request was blocked, we were not known. This can easily happen, for example, when the execution time of a blocking request is not long enough to get to the log, but the transaction was active after its completion and created problems for a long time.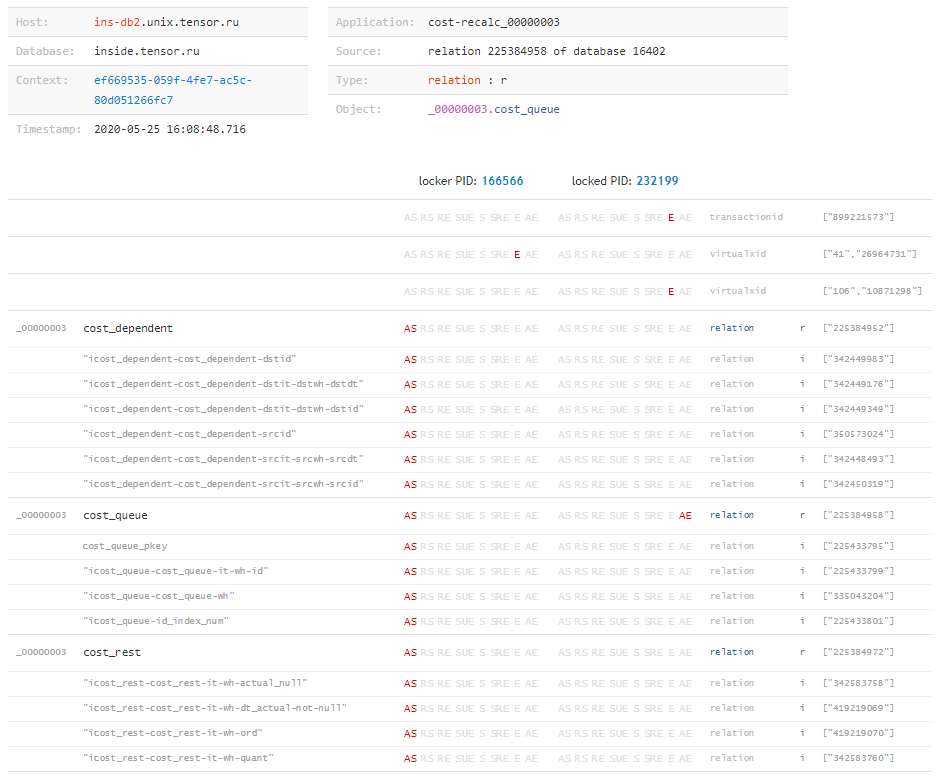 But about this - in another article.
"All by itself"
In the meantime, we will collect the full version of “monitoring”, which will automatically remove the status of locks for our archive as soon as something suspicious appears in the log:ps uw -U postgres \
| grep [l]ogger \
| awk '{print "/proc/"$2"/fd"}' \
| xargs ls -l \
| grep `cd; psql -U postgres postgres -t -A -c "SELECT CASE WHEN substr(current_setting('log_directory'), 1, 1) = '/' THEN current_setting('log_directory') ELSE current_setting('data_directory') || '/' || current_setting('log_directory') END"` \
| awk '{print $NF}' \
| xargs -l -I{} tail -f {} \
| stdbuf -o0 grep 'still waiting for' \
| xargs -l -I{} date '+%Y%m%d-%H%M%S.%N' \
| xargs -l -I{} psql -U postgres postgres -f detect-lock.sql -o {}-lock.log
And next to detect-lock.sqlput the last request. Run - and get a bunch of files with the desired content inside:# cat 20200526-181433.331839375-lock.log
type | target | locked | pid | mode | granted | conflict
---------------+----------------+--------+--------+--------------+---------+----------
relation | {279588430} | t | 136325 | RowExclusive | t | f
relation | {279588422} | t | 136325 | RowExclusive | t | f
relation | {17157} | t | 136325 | RowExclusive | t | f
virtualxid | {110,12171420} | t | 136325 | Exclusive | t | f
relation | {279588430} | f | 39339 | RowExclusive | t | f
relation | {279588422} | f | 39339 | RowExclusive | t | f
relation | {17157} | f | 39339 | RowExclusive | t | f
virtualxid | {360,11744113} | f | 39339 | Exclusive | t | f
virtualxid | {638,4806358} | t | 80553 | Exclusive | t | f
advisory | {1,1,2} | t | 80553 | Exclusive | f | t
advisory | {1,1,2} | f | 80258 | Exclusive | t | t
transactionid | {3852607686} | t | 136325 | Exclusive | t | f
extend | {279588422} | t | 136325 | Exclusive | f | t
extend | {279588422} | f | 39339 | Exclusive | t | t
transactionid | {3852607712} | f | 39339 | Exclusive | t | f
(15 rows)
Well, then - sit down and analyze ...