Recently, I decided on a very strange purchase for myself. Yes, I bought a treadmill.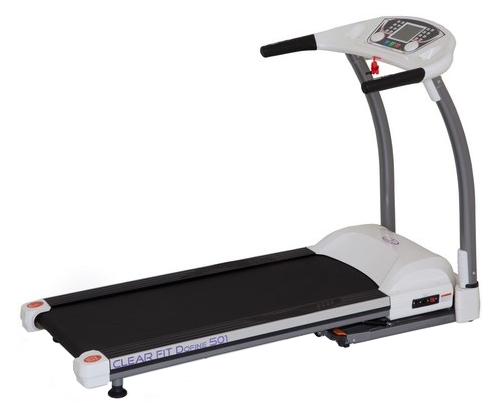 And soon the realization came to me that there was not enough detailed statistics like when riding a bike. In the case of a bicycle, the application on the phone writes my speed, heart rate, cadence, and lift. It is very curious to control all these parameters during training, to be able to look at charts and compare your results from time to time.So I decided to do something similar with the treadmill: connect it to a smartphone or tablet in order to collect and display statistics.As usual, my story is in the form of a traditional text article, and through video. As you like more.
Video
Article
Design
Even at the moment when I was collecting the treadmill, I noticed that the remote control and the running belt itself connected only four wires. Apparently, some of them are used to power the console, because the canvas itself is connected to the 220 volt network, and the remaining wires are needed to transmit control signals in the opposite direction - from the console to the canvas, they control the speed and angle of the track.I connected the oscilloscope parallel to these wires, trying different combinations.As a result, I found out that everything was about the same as I expected. One of the wires is ground, and another is 12 volt power. The rest transmit digital data.In one of them, the signal changes when switching speed and angle. This is exactly what I need! The signal amplitude is about four volts. But the protocol doesn’t look like something standard, and the signal is very noisy, when the track is on, you need to filter it somehow. The last wire is just pulses with a constant frequency. Apparently, for the console to see the connection to the running belt. If you disconnect this wire, the remote control immediately gives an error.Indications from the pulse sensor on these wires are clearly not transmitted, but it is not necessary. It is better to connect a separate chest sensor, which I have been using for a long time when riding a bicycle. In addition, it turned out that the heart rate sensor on the treadmill itself is lying a lot, underestimating the readings.
Device assembly
So, the next task is to assemble a board that connects in parallel to these wires, reads the current readings of the speed and angle, and somehow transfers them wirelessly to a tablet or smartphone.Once again, I decided to use the Onion Omega2 single-board computer. He must do an excellent job. It is only necessary to lower the supply voltage to 3.3 volts and filter the data from interference.To reduce the voltage, I now use these ready-made boards with a DC-DC converter. They cost some penny, can withstand up to a couple of amperes, and the output voltage is adjusted with a twist.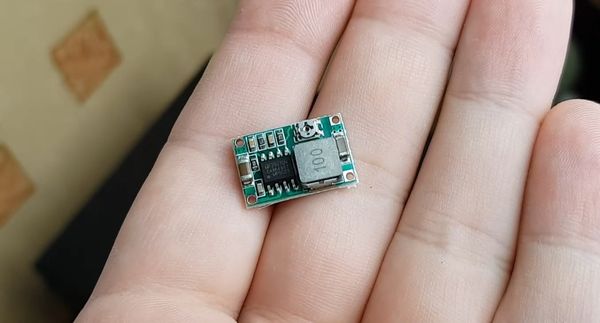 At the same time, this board has conclusions to solder directly to another board, it is very convenient. The main thing is not to twist the voltage twist after installation in the circuit.To filter the noise on the data line, I made a regular RC filter: a 2.2 kilo-ohm resistor and a 22 picofarad capacitor. This should filter out the high frequency noise, leaving a low frequency signal.It turned out quite a small scarf.
 I connected it to the treadmill wires to see how well the signal is filtered when it is turned on and, apparently, the waveform has become almost perfect.
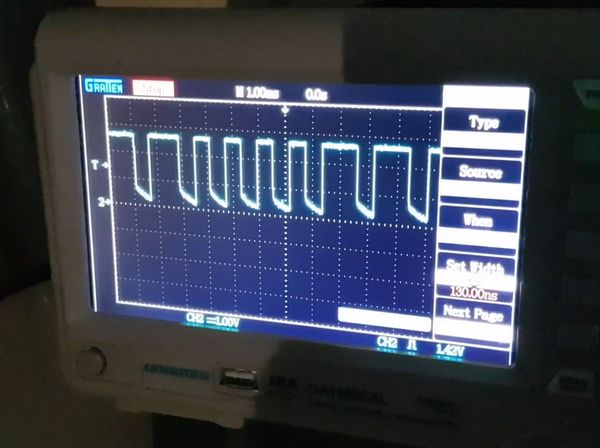
Kernel module
However, it is not so easy to check the performance of iron. As we sawearlier on the oscilloscope, the signals go very fast, and we do not use a microcontroller, but a single-board Omega2 computer with Linux on board. Under Linux, we will not be able to process signals from user space so quickly. But from the core we can! Therefore, it's time to write a Linux kernel module!To do this, you need to download the Linux kernel sources, in our case this is an OpenWRT assembly for Omega2, and create a directory with the source code of our module in them.Writing module code is a lot like programming a microcontroller. We also write in C, also everything is low-level, we also work with interrupts and also turn to the GPIO conclusions. Only here, besides all of the above, we are still interacting with user space through a pseudo-file. Thus, our kernel module becomes a kind of adapter between the hardware and ordinary applications. Actually, this is called the driver.At first, I did not know how to decode the signals, so I simply deduced their duration.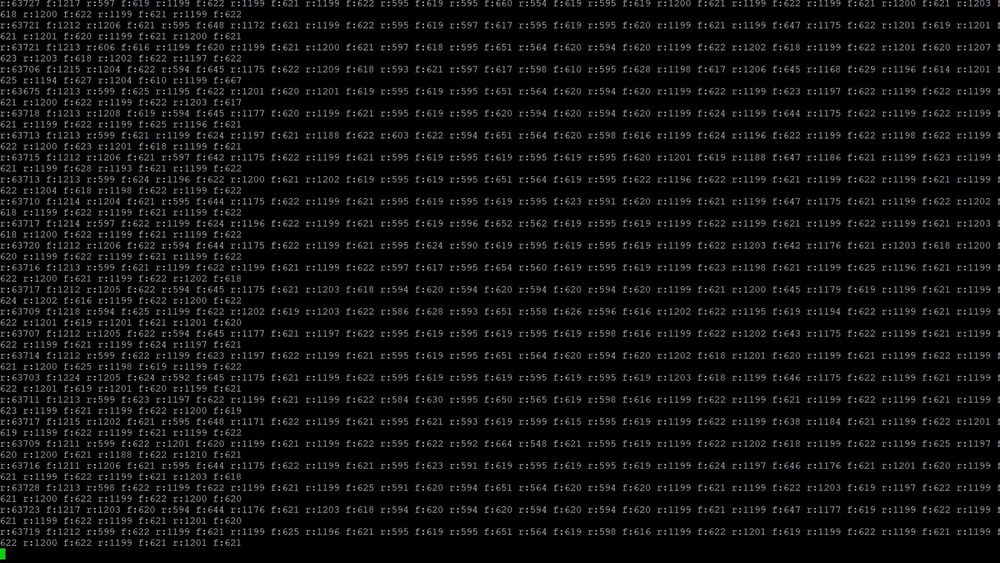 It soon became clear that the signals were encoded with high-level duration. It is either 600 microseconds long or 1200 microseconds long. The low level is always 600 microseconds long except for the initial sequence.A total of 17 such such drops up and down. Apparently, this is 16 bits of data plus the initial sequence. I made their decoding, taking as a basis that long high differences are a logical zero, and short ones are a logical unit and I got what happened. I immediately saw the data I needed!
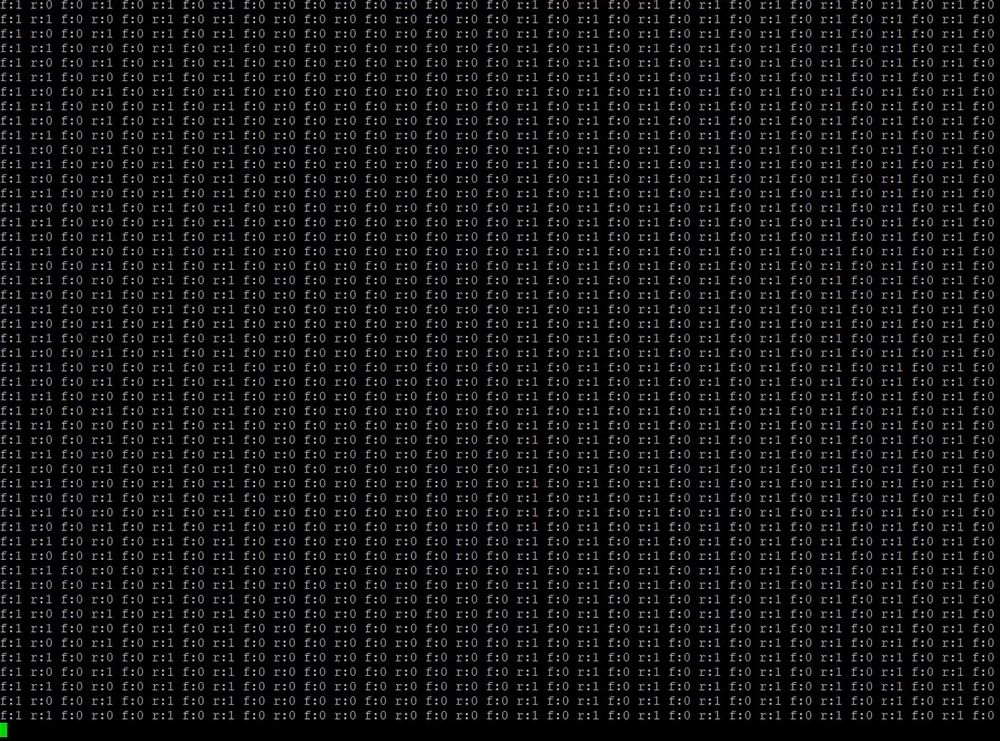 16 bits are, as you know, two bytes. The first byte indicates the type of data being transmitted: the angle of inclination or speed, and the second byte the data itself. The driver is extremely simple.The only driver parameter is the port number.
static u8 receive_pin = 11;
module_param(receive_pin, byte, S_IRUGO);
MODULE_PARM_DESC(receive_pin,"Treadmill receiver pin number (default 11)");
When initializing, configure it for input and set the interrupt, which will be triggered every time the level on it changes.
data_recv_timer = kzalloc(sizeof(struct hrtimer), GFP_KERNEL);
if (!data_recv_timer) {
pr_err("treadmill: can't allocate memory for timer\n");
treadmill_free();
return -1;
}
hrtimer_init(data_recv_timer, CLOCK_MONOTONIC, HRTIMER_MODE_REL);
data_recv_timer->function = recv_timer_callback;
In this interruption, we first look at the current time. Next, we use this value to calculate how much time has passed since the last interrupt triggered and put it into an array. Of course, we remember the current time for calculation the next time. In addition, you must restart the special timer.
static irq_handler_t treadmill_irq_handler(unsigned int irq,
void *dev_id, struct pt_regs *regs)
{
u64 now = ktime_to_us(ktime_get_boottime());
u8 value = gpio_get_value(receive_pin);
u64 time_passed;
reset_recv_timer();
if ((timings_pos & 1) == value)
{
time_passed = now - last_time;
if (timings_pos < TIMINGS_BUFFER_SIZE)
{
timings[timings_pos] = time_passed;
timings_pos++;
}
last_time = now;
}
return (irq_handler_t) IRQ_HANDLED;
}
The trick is that if the timer still works, it means that there were no level drops on the pin for a long time, and accordingly it is time to process the collected information. In the function that the timer calls, it is checked that there were exactly 34 drops, after which we look at how long each interval was. If there is 600 microseconds, then 1200 microseconds, then we take 900 abroad. If the interval is less, then we write one in the result, shifting it by one bit. After processing each interval, we send the result to open pseudo-files, thus transferring data to user space.
static enum hrtimer_restart recv_timer_callback(struct hrtimer *timer)
{
int i, p;
u16 data;
if (timings_pos != 34) {
pr_debug("treadmill: invalid edges count: %d", timings_pos);
timings_pos = 0;
return HRTIMER_NORESTART;
}
data = 0;
for (i = 2; i < timings_pos; i += 2)
{
data >>= 1;
if (timings[i] < 900)
data |= 0x8000;
}
for (p = 0; p < 2; p++) {
for (i = 0; i < treadmill_number_opens; i++) {
if (!(opened_files[i]->f_mode & FMODE_READ)) continue;
((struct cfile_t*)opened_files[i]->private_data)->receiver_buffer[
((struct cfile_t*)opened_files[i]->private_data)->receiver_write_pos++
% RECEIVER_BUFFER_SIZE] = (data >> (8 * p)) & 0xFF;
}
};
wake_up_interruptible(&wq_data);
timings_pos = 0;
return HRTIMER_NORESTART;
}
Python server and speed detection
Then it remains to write a Python script that will read them from the pseudo-file and send them over the network as JSON strings. It would seem that everything is fairly straightforward. However, if everything is simple with the angle of inclination, and the value in the second byte exactly corresponds to the angle of inclination as a percentage, then with speed everything turned out to be much more confusing.A value of 9 corresponds to one kilometer per hour, and a value of 160 corresponds to 18 kilometers per hour. That is, the dependence of data on real speed is not at all obvious. I wrote out all the values manually, drove them into Excel, plotted and got a very uneven curve.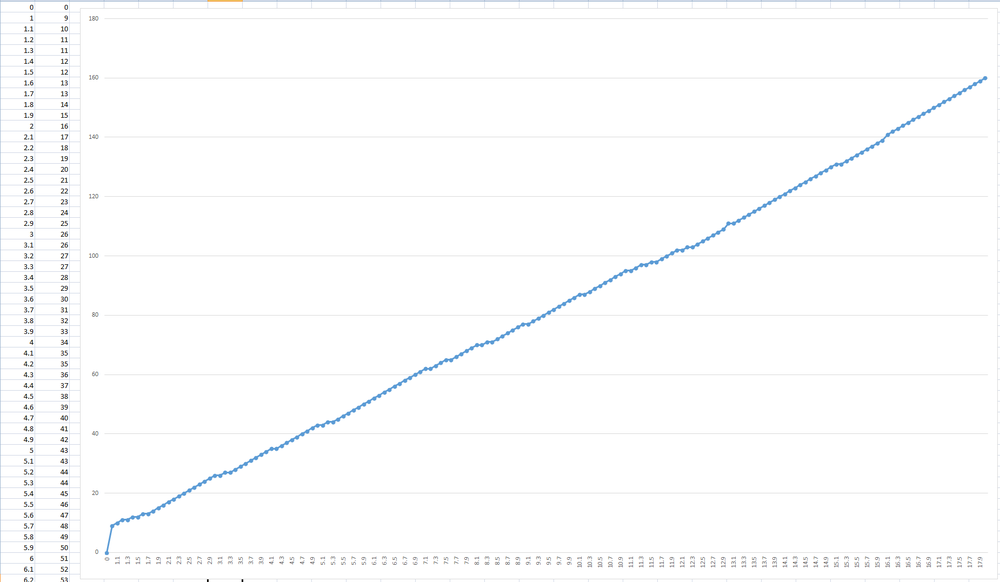 And there are speeds when the readings on the remote are different, but the data and speed of the track itself remain the same! For example, 5.2 km / h and 5.3 km / h are actually the same speeds. Everywhere cheating. I wonder what speed really is there? Measure it somehow, but leave it for later.Apart from this transfer of parrots to kilometers per hour, the script turned out to be extremely simple. We read the data from the Linux pseudo-file, decode it, accept network connections and transfer the data to the clients connected over the network as a JSON string.
class TreadmillServer:
    def __init__(self, device = "/dev/treadmill", port = 11010, interface = '0.0.0.0'):
        self._device = device
        self._port = port
        self._interface = interface
        self._working = False
        self._clients = []
        self._server_sock = None
        self.incline = 0
        self.speed = 0

    def start(self):
        self._working = True
        self._server_sock = socket.socket(socket.AF_INET, socket.SOCK_STREAM)
        self._server_sock.bind((self._interface, self._port))
        self._server_sock.listen(10)
        print("Listening port", self._port)
        Thread(target=self._port_listener, name="Treadmill port listener", daemon=True).start()
        Thread(target=self._device_listener, name="Treadmill device listener", daemon=True).start()

    def stop(self):
        self._working = False
        if self._server_sock != None:
            try:
                self._server_sock.close()
            except:
                pass
            self._server_sock = None

    def __del__(self):
        self.stop()

    def _port_listener(self):
        while self._working and self._server_sock:
            try:
                conn, addr = self._server_sock.accept()
                print('Connected: {0}'.format(addr))
                TreadmillClientConnection(self, conn, addr)
            except Exception as e:
                print("Error:", e)
I think no authorization and security are needed here. The state of the treadmill is not the kind of data that I would like to protect from hackers.We put this script into startup and remove the board inside the treadmill. Alas, it only fit in a metal pipe connecting the console to the running belt.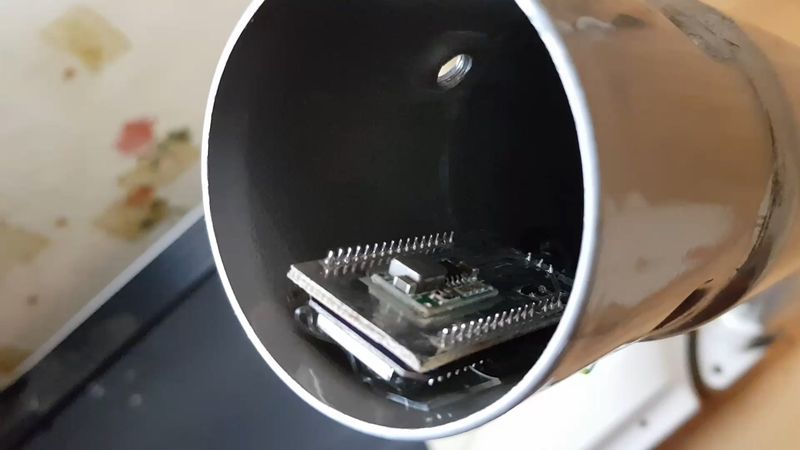 As you know, metal shields the radio signal, so I brought the Wi-Fi antenna out of the pipe, but under a plastic casing that hides the wires.
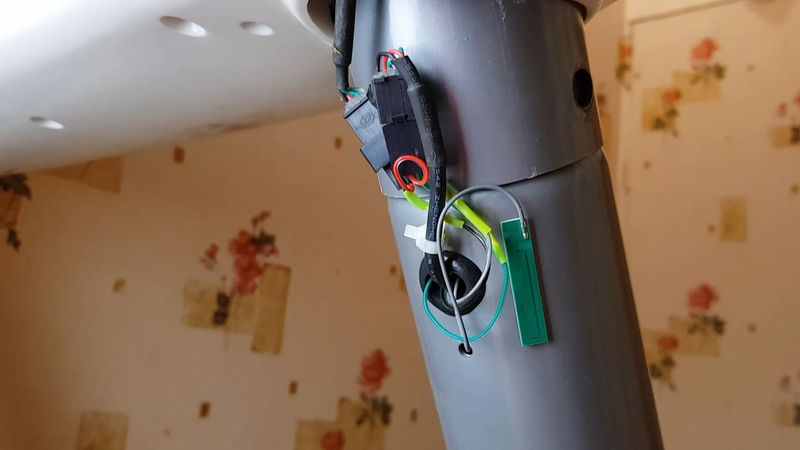 On this directly “smart” treadmill is ready. She already knows how to distribute statistics over the network. It remains only to write a client for her!
Android client
What in my opinion should be such a client. This is an Android application that I will run on a tablet or smartphone and put it on top of the display of the treadmill itself, respectively, it should display all the information on the exercises on the screen, replacing the display of the treadmill itself. The application should be able to work in the background, so that I can watch the video without any problems while jogging. Also, it should keep detailed statistics on runs, synchronizing everything with the cloud and drawing graphs of the dependence of the pulse on speed and angle of inclination.The heart of such an application should be a service that runs in the background, connects to the treadmill in an endless loop, receives data and decodes them. There are no particular difficulties in this.Heart rate sensor
The most difficult thing was suddenly working with a heart rate sensor. Many pitfalls were discovered. I have such a chest heart rate monitor here: I have been using it for a long time when I ride a bicycle. It is quite standard, it works on BLE a la Bluetooth Low Enegy, it can be paired with both a phone and a Garmin navigator without any problems. I could not even think that working with it from my application would be so unobvious. Such sensors have standard GUIDs for different readings.To start receiving a heart rate, you must first configure your heart rate monitor to periodically send readings. I could do this only by studying non-working examples and by typing.As a result, I wrote a class for working with a heart rate sensor, which automatically tries to connect to it and periodically reports the current heart rate.
Samsung Health SDK
As for statistics and graphs. I decided not to reinvent the wheel, but to use what I already use when riding a bike, namely to somehow make friends with the wonderful Samsung Health app.Now it will probably look like I'm advertising Samsung again. But on a bike, this application has really proven itself really well. To my surprise, it connects to all sensors without problems, shows both the cadence and wheel speeds, and dictates the statistics in the headphones, it shows the same statistics with graphs, and gives out achievements, and stores everything in the cloud.The search showed that Samsung Health has its own SDK, which, although not entirely intelligible, is still documented: img-developer.samsung.com/onlinedocs/health/android/data/index.htmlWorking with it is essentially working with a database that stores a variety of readings from steps taken and heart rate measurements to blood sugar and sleep phases. But now we are interested in records of exercises, which include both scalar values like the type of exercise, time, distance, duration, calories burned, and arrays of live data like the history of heart rate, speed and coordinates.All these data must be correctly stored and prepared. Some need to be calculated.Height calculation
For example, lifting height. From the treadmill, we know the angle of climb at each point in time, which is measured in percent. The percentage of elevation angle is the ratio of the distance traveled to the climb. It turns out that the vertical speed is equal to the usual speed times the slope as a percentage and divided by one hundred. Knowing the vertical speed, we can calculate the current height at each moment in time. As a result, it must be entered into the current coordinates, despite the fact that during the exercise they do not change and are not taken into account.In response to this data, the Samsung Health app will show how much I supposedly climbed, as well as the vertical speed at each moment of training.Calorie Counting
But how to count calories? Moreover, calorie counting is a must for Samsung Health. At the same time, calories burned is a very inaccurate indicator, which depends on many different factors. Not sure if it makes sense to count them.I did not come up with something of my own and just google the calculator (https://42.195km.net/e/treadsim/) and copied the algorithm from my javascript (https://42.195km.net/e/treadsim/treadsim107 .js). At the entrance, he takes the distance traveled, the angle of elevation and ... weight.I could set my weight manually, but since we are working with Samsung Health, I can take my current weight from there. After all, I use smart scales from Xiaomi, which are synchronized with Google Fit on my phone, Google FIt through a separate application is synchronized with Samsung Health, Samsung Health through the cloud is synchronized with itself on the tablet, where my application is already receiving it.App appearance
Visually, the task of the application is to large-scale display of the main indications: speed, angle, heart rate, distance, calories. It’s better to do this in white on a black background so that the battery consumption when using the AMOLED screen is minimal, because of course we indicate that when displaying our activity, the screen should be turned on constantly.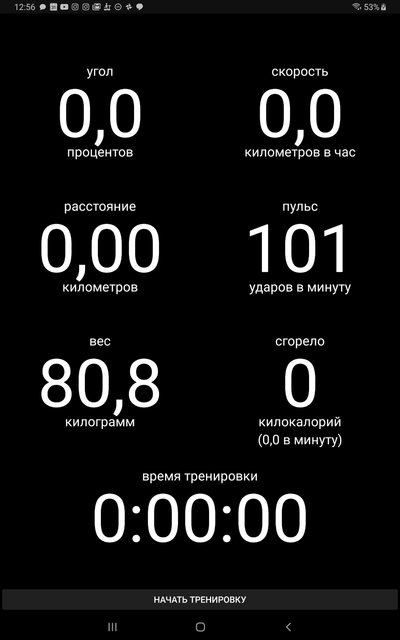 The buttons are automatically hidden when the treadmill is active. You can start and stop training only at zero speed.And of course, you need to make support for the “picture in picture” mode. This is done in just a few lines. You just need to indicate in the manifest that activity supports this mode, and in the code go into it when minimizing the application. As a result, you can watch, for example, YouTube and see treadmill readings in a corner of the screen. It turned out very convenient.
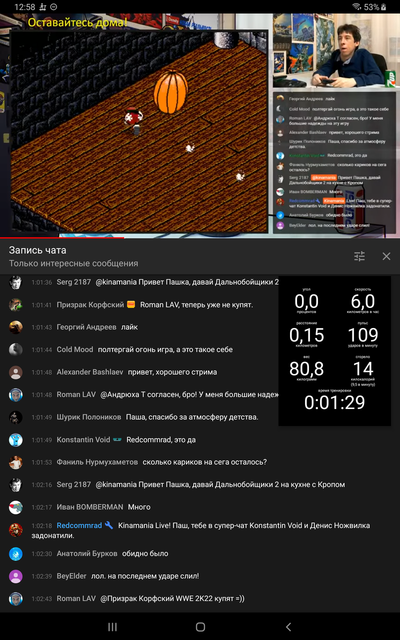 But at this stage I was finally overtaken by the pain of the Android developer, because I already get four different screen sizes: the phone and the tablet are in normal mode and they are also in the “picture in picture” mode. And it so happened that if I select the normal font size for one screen size, then in other cases everything is too small, then too large.When developing for Android, there are several categories of screens, and you can make different settings apply automatically for them, but in my case this was not enough.As a result, I had to calculate and set the font sizes in the code, which I think is very wrong. However, it works perfectly as a result.
Result
And here is the result. We open the application, wait for the connection with the treadmill and the heart rate sensor, start the training and use the treadmill as usual.At the end of the workout, we stop the treadmill. Upon reaching zero speed, the button “finish training” will appear. Click it, and the statistics are sent to Samsung Health. Open it and see all the data.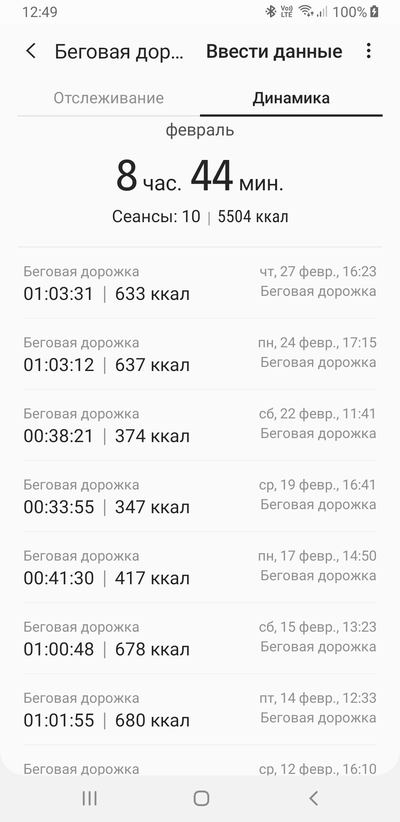
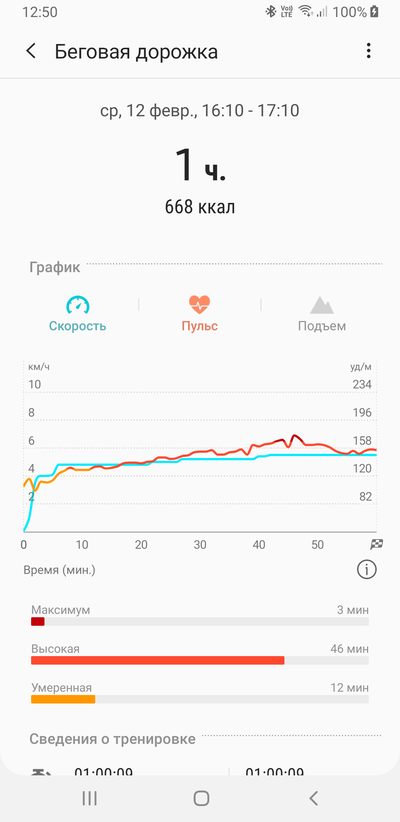
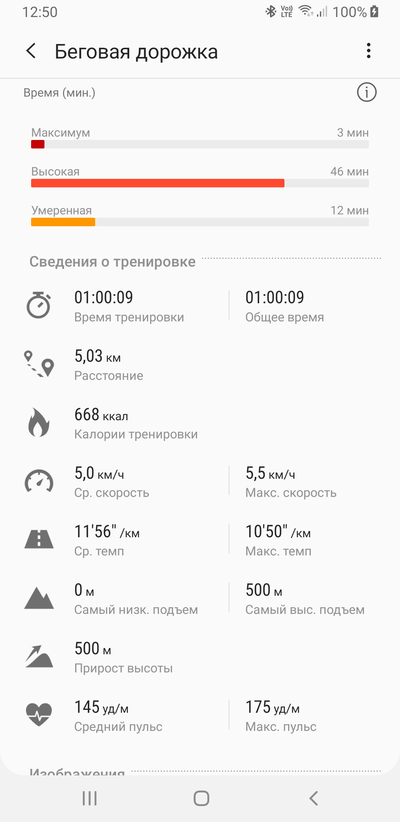 You can see the graph of the pulse, speed and rise, compare your progress at different time intervals, all this is stored in the cloud and is accessible from all devices.You can synchronize it with Google Fit. The beauty. I am pleased with the result. Now the main thing is not to throw classes. You can add to the functionality of the application so that it resembles training if I am lazy for a long time. But I am already too lazy to do this function.