Good afternoon. Recently, I needed to deal with the Windows trace service. This service appeared in Windows 2000, however, there were very few articles on this service on the Internet. So the idea of writing this article appeared. So, let's begin!Today I will try to talk about:- Windows Tracing Service Theory
- Creating Your ETW Session
- Using event tracing API to work with ETW
- Using tracerpt and xperf to work with ETW
Windows Tracing Service Theory
Event Tracing for Windows (ETW) is a service that allows you to receive events from one or more event providers in real time or from a * .etl file for a certain time period. Unclear? Now let's figure it out!In order to understand how ETW works, you need to understand the structure of this service.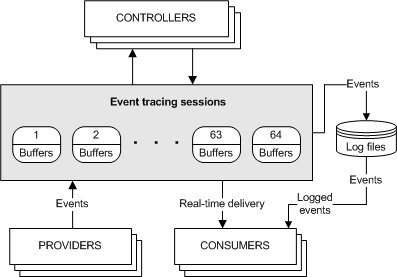 ETW architecture includes 4 elements
- event providers
- event consumers
- ETW controllers
- ETW sessions (event tracing sessions)
The principle of operation is as follows.A number of event providers are registered in the system, i.e. applications that can share their experiences with ETW sessions. Also in this system there is a certain number of active ETW sessions that can consume events from one or more providers and provide them to the user either in real time or write all events from suppliers to a log file (* .etl). And controllers control this whole movement.And now we will consider each element of the architecture considered above in more detail to finally understand the principle of work!Event Providers
Event providers are applications that contain event tracking tools. After the provider has registered, the controller can enable or disable event tracking in the provider. The provider determines its interpretation of on or off. Typically, an enabled provider generates events, but a disabled provider does not. This allows you to add event tracking to our application without requiring it to generate events all the time.One vendor can share their events with multiple ETW sessions at once.Each event consists of two elements: a header and data! The event header includes information about the event: provider identifier, event identifier, timestamp, etc. The rest of the data is determined by a specific provider: ETW receives any data and writes it to the buffer, and their interpretation is assigned to the consumers of information.There are four main types of providers:MOF providers (classic)providers WPPproviders based on the manifestproviders TraceLogging.Event providers differ in the types of fields that they store in event payloads.Event providers seem to be sorted out. Move on!Controllers
A controller is an application that is responsible for the operation of one or more ETW sessions. It is the controller that determines the size and location of the log file, starts and stops event tracing sessions (ETW sessions), and allows providers to record events in the session. As mentioned earlier, it is the controller that allows the provider to share their events!Consumers
Consumers are applications that receive and process events from one or more trace sessions at the same time. Consumers can receive events stored in log files or from sessions that deliver events in real time. As we already know, one ETW session can have several suppliers. The question arises: will there be confusion? How will events from the various ETW sessions relate to each other? Events are sorted by the time they occur, i.e. the system delivers events in chronological order!ETW Sessions
Event tracking sessions (ETW sessions) record events from one or more providers that the controller permits. The session is also responsible for managing and flushing buffers.Event Tracing supports up to 64 events tracing sessions running simultaneously. Of these sessions, there are two special-purpose sessions. The remaining sessions are available for general use. Two special-purpose sessions:- Global logger session
- NT Kernel Logger Session
A Global Logger event trace session records events that occur at the beginning of the operating system boot process, such as those generated by device drivers.The NT Event Tracking Session Kernel Logger records predefined system events generated by the operating system, such as disk I / O events or page failures.So, now let's get to practice !!!Creating Your ETW Session
Before starting work, we need knowledge of several utilities, namely: alist of providers available on a particular OSlogman query providers
get full information about the providerwevtutil gp < > /ge /gm
list of all active ETW sessionsxperf -loggers
Also, for viewing files, it is advisable to have Notepad ++.After looking at the list of providers on your computer (and there are more than 1000 on Windows 10), we will choose one of them for our session: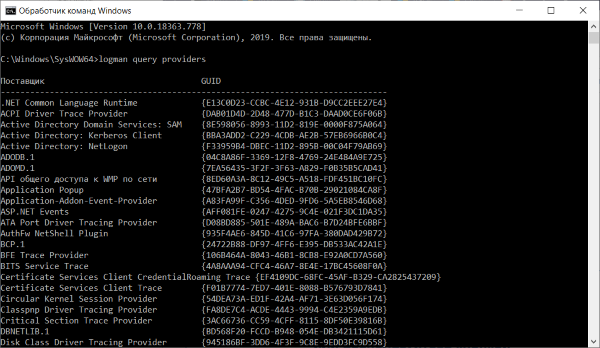 I chose Microsoft-Windows-WinINet (this service records all our actions when working in the Microsoft Edge browser).1. Win + R -> compmgmt.msc2. "Performance"3. "Data Collector Sets"4. "Event Trace Sessions"5. “New”6. “Data Collector Set”7. Specify the name of the data collector8. “Create manually (Advanced)” (Add manually (for experienced) ")
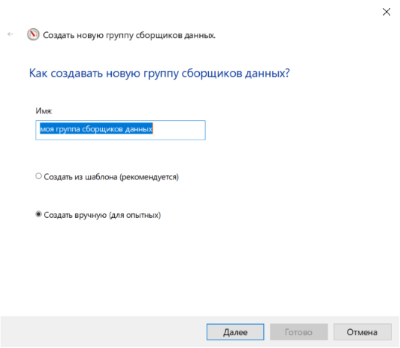 9. Add interesting us providers per session10. Specify the keywords of interest to us in the “Keywords (Any)” field - 0xFFFFFFFFFFFFFFFFFF11. Specify the logging level 0xFF=
  12. Select the path where the session log file will be saved13. Select the “ Start this data collector set now ”(“ Run the group of data collectors now ”)Now the session that we created works. Microsoft Edge needs some work to get the session to gather information about us!After some time has passed, we go to the place where we saved the log file. We execute the following command there.
tracerpt " .etl" -o -report -summary -lr
After executing this command, 4 files will be generated.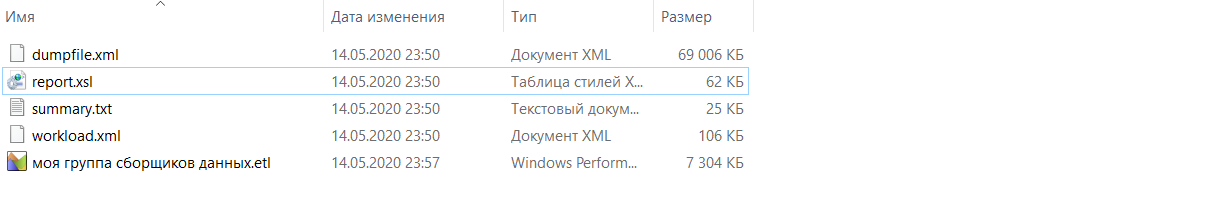 We are currently interested in dumpfile.xml. You can open this file either through notepad ++, you can also do this in Excel.Having carefully studied this file, you can see that this session collected almost all the information about our movement on the Internet !!! You can read more about it here. We study ETW and extract profits .Well, and we move on. We just created a session with a single event provider. Received session data from the log file. It's time to code!
Using event tracing API to work with ETW
On habr there is an interesting article, the Worst API ever created .In this article you will find answers to many questions that you most likely will have when writing applications!We will code in C ++.Let's start with the simplest.Configure and start an event tracking session
First, consider the general idea.To start a trace session, you must:1) Set the structure EVENT_TRACE_PROPERTIES2) Start the session using StartTraceNext, enable the event providers3) Enable the providers using EnableTrace | EnableTraceEx | EnableTraceEx2To stop the trace session, you must:4) Before stopping the trace session, you must disable the providers using EnableTrace | EnableTraceEx | EnableTraceEx2, passing EVENT_CONTROL_CODE_DISABLE_PROVIDER5) Call the ControlTrace function and pass it EVENT_TRACE_CONTROL_STOPIn the example below, I am creating a session called MyEventTraceSession. The log file in the current directory is called WriteThePuth.etl.The event provider is Microsoft-Windows-Kernel-Process. You can find out his GUID usingwevtutil gp Microsoft-Windows-Kernel-Process /ge /gm
Directly code:#include <windows.h>
#include <stdio.h>
#include <conio.h>
#include <strsafe.h>
#include <wmistr.h>
#include <evntrace.h>
#include <iostream>
#define LOGFILE_PATH L"WriteThePuth.etl"
#define LOGSESSION_NAME L"MyEventTraceSession"
static const GUID SessionGuid =
{ 0xae44cb98, 0xbd11, 0x4069, { 0x80, 0x93, 0x77, 0xe, 0xc9, 0x25, 0x8a, 0x12 } };
static const GUID ProviderGuid =
{ 0xd22FB2CD6, 0x0E7B, 0x422B, {0xA0, 0xC7, 0x2F, 0xAD, 0x1F, 0xD0, 0xE7, 0x16 } };
void wmain(void)
{
setlocale(LC_ALL, "ru");
ULONG status = ERROR_SUCCESS;
TRACEHANDLE SessionHandle = 0;
EVENT_TRACE_PROPERTIES* pSessionProperties = NULL;
ULONG BufferSize = 0;
BOOL TraceOn = TRUE;
BufferSize = sizeof(EVENT_TRACE_PROPERTIES) + sizeof(LOGFILE_PATH) + sizeof(LOGSESSION_NAME);
pSessionProperties = (EVENT_TRACE_PROPERTIES*)malloc(BufferSize);
if (NULL == pSessionProperties)
{
wprintf(L"Unable to allocate %d bytes for properties structure.\n", BufferSize);
goto cleanup;
}
ZeroMemory(pSessionProperties, BufferSize);
pSessionProperties->Wnode.BufferSize = BufferSize;
pSessionProperties->Wnode.Flags = WNODE_FLAG_TRACED_GUID;
pSessionProperties->Wnode.ClientContext = 1;
pSessionProperties->Wnode.Guid = SessionGuid;
pSessionProperties->LogFileMode = EVENT_TRACE_FILE_MODE_SEQUENTIAL;
pSessionProperties->MaximumFileSize = 1024;
pSessionProperties->LoggerNameOffset = sizeof(EVENT_TRACE_PROPERTIES);
pSessionProperties->LogFileNameOffset = sizeof(EVENT_TRACE_PROPERTIES) + sizeof(LOGSESSION_NAME);
StringCbCopy((LPWSTR)((char*)pSessionProperties + pSessionProperties->LogFileNameOffset), sizeof(LOGFILE_PATH), LOGFILE_PATH);
status = StartTrace((PTRACEHANDLE)&SessionHandle, LOGSESSION_NAME, pSessionProperties);
if (ERROR_SUCCESS != status)
{
wprintf(L"StartTrace() failed with %lu\n", status);
goto cleanup;
}
status = EnableTraceEx2(
SessionHandle,
(LPCGUID)&ProviderGuid,
EVENT_CONTROL_CODE_ENABLE_PROVIDER,
TRACE_LEVEL_INFORMATION,
0,
0,
0,
NULL
);
if (ERROR_SUCCESS != status)
{
wprintf(L"EnableTrace() failed with %lu\n", status);
TraceOn = FALSE;
goto cleanup;
}
wprintf(L"Run the provider application. Then hit any key to stop the session.\n");
_getch();
cleanup:
if (SessionHandle)
{
if (TraceOn)
{
status = EnableTraceEx2(
SessionHandle,
(LPCGUID)&ProviderGuid,
EVENT_CONTROL_CODE_DISABLE_PROVIDER,
TRACE_LEVEL_INFORMATION,
0,
0,
0,
NULL
);
}
status = ControlTrace(SessionHandle, LOGSESSION_NAME, pSessionProperties, EVENT_TRACE_CONTROL_STOP);
if (ERROR_SUCCESS != status)
{
wprintf(L"ControlTrace(stop) failed with %lu\n", status);
}
}
if (pSessionProperties)
{
free(pSessionProperties);
pSessionProperties = NULL;
}
}
We will analyze the above program in more detail.1) Set the EVENT_TRACE_PROPERTIES structureTo configure an event trace session, you must use the EVENT_TRACE_PROPERTIES structure to specify session properties. The memory you allocate for the EVENT_TRACE_PROPERTIES structure must be large enough to also contain the names of the session and log files that follow the structure in memory.2) Start the session using StartTraceAfter you specify the properties of the session, call the StartTrace function to start the session. If the function succeeds, the SessionHandle parameter will contain the session descriptor, and the LoggerNameOffset property will contain the session name offset.3) Turn on providers using EnableTrace | EnableTraceEx | EnableTraceEx2To enable the providers whom you want to allow recording events in your session, call the EnableTrace function to enable classic providers, and the EnableTraceEx function to enable manifest-based providers. In other cases - EnableTraceEx2.4) Before stopping the trace session, you must disable providers using EnableTrace | EnableTraceEx | EnableTraceEx2 by passing EVENT_CONTROL_CODE_DISABLE_PROVIDERTo stop the trace session after collecting events, call the ControlTrace function and pass EVENT_TRACE_CONTROL_STOP as the control code. To specify a session to stop, you can pass the event trace session descriptor obtained from an earlier call to the StartTrace function, or the name of a previously started session. Be sure to disconnect all providers before stopping the session. If you stop the session before turning off the provider for the first time, ETW will disconnect the provider and try to call the provider callback control function. If the application that started the session terminates without disconnecting the provider or calling the ControlTrace function, the provider remains turned on.5) To stop the trace session, call the ControlTrace function and pass it EVENT_TRACE_CONTROL_STOPAs we saw in the example above, using the Event Tracing API is not the easiest. Depending on what you do, you can continue to write events providers or write event consumers. However, both of these tasks are quite voluminous and will not be considered in this article! Additional complexity is created by 4 types of event providers, and, accordingly, 4 options for writing events and 4 options for their consumption. The work with the Event Tracing API is described in great detail and well on the official Microsoft Website Using Event TracingAfter working for some time with the Event Tracing API, I had a question: are there any utilities that will simplify my life?Using tracerpt and xperf to work with ETW
In this chapter, I will not consider these utilities from a theoretical point of view.You can use the Tracerpt command to analyze event trace logs, log files generated by the performance monitor, and real-time event trace providers. It creates dump files, report files, and report schemas. This utility has a large number of parameters, but the following "minimum" is suitable for starting worktracerpt " 1- .etl" ... " n- .etl" -o < > -report < > -summary< >
The xperf.exe utility is a full-fledged controller. It supports command line arguments for managing ETW providers and sessions. Controllers can request the status of currently active sessions and receive lists of all providers registered in the system. For example, to get all active sessions, use the following command:C:\>xperf -loggers
and to get a list of all providers registered in the system, use the command:C:\>xperf -providers
Controllers have a few more key features. They can update sessions and flush buffers to disk.That's all for now!Unfortunately, in this article I did not address a number of interesting issues (for example, the consumption of events in real time or working with special-purpose sessions).You can read about it on the following sites:Event Tracing - official Microsoft documentation.We study ETW and extract the benefits ofEvent Tracing for Windows on the evil side. But this is not exactly theworst API ever created