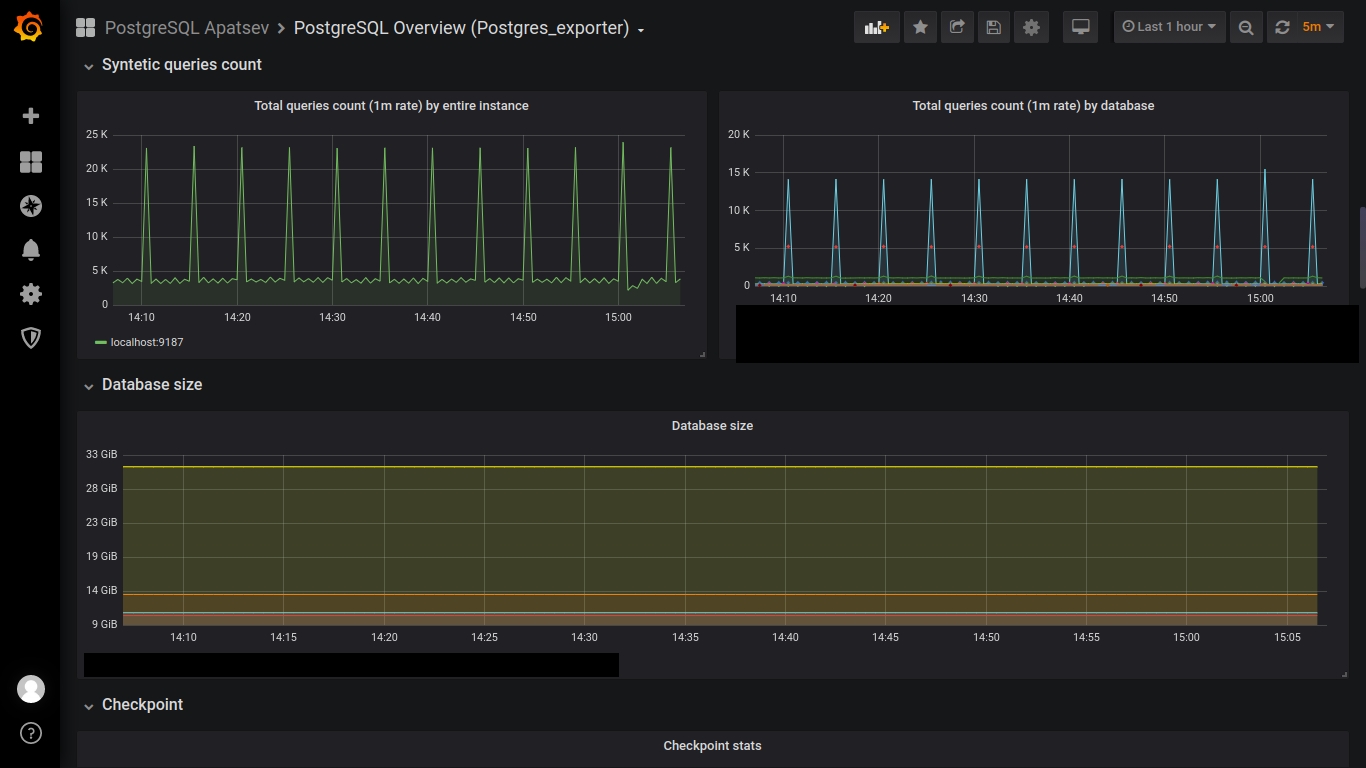
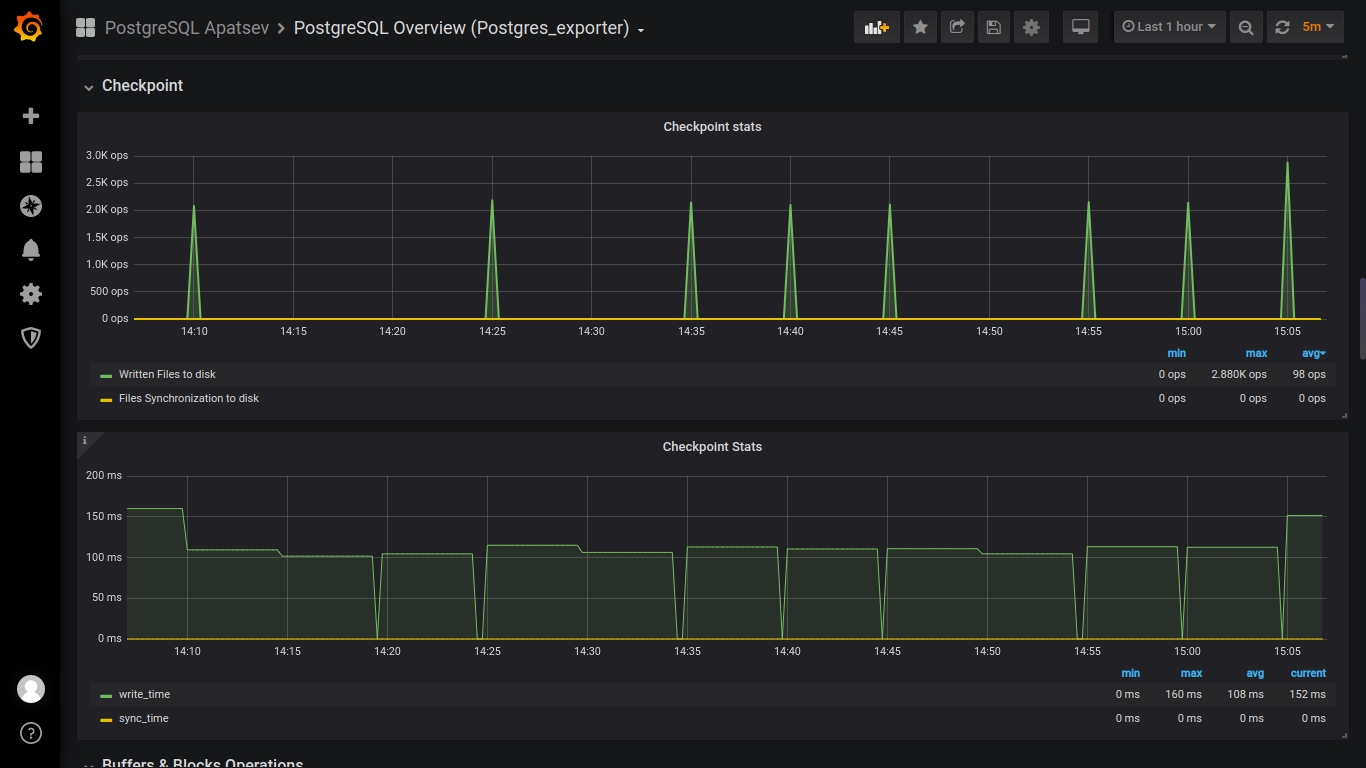
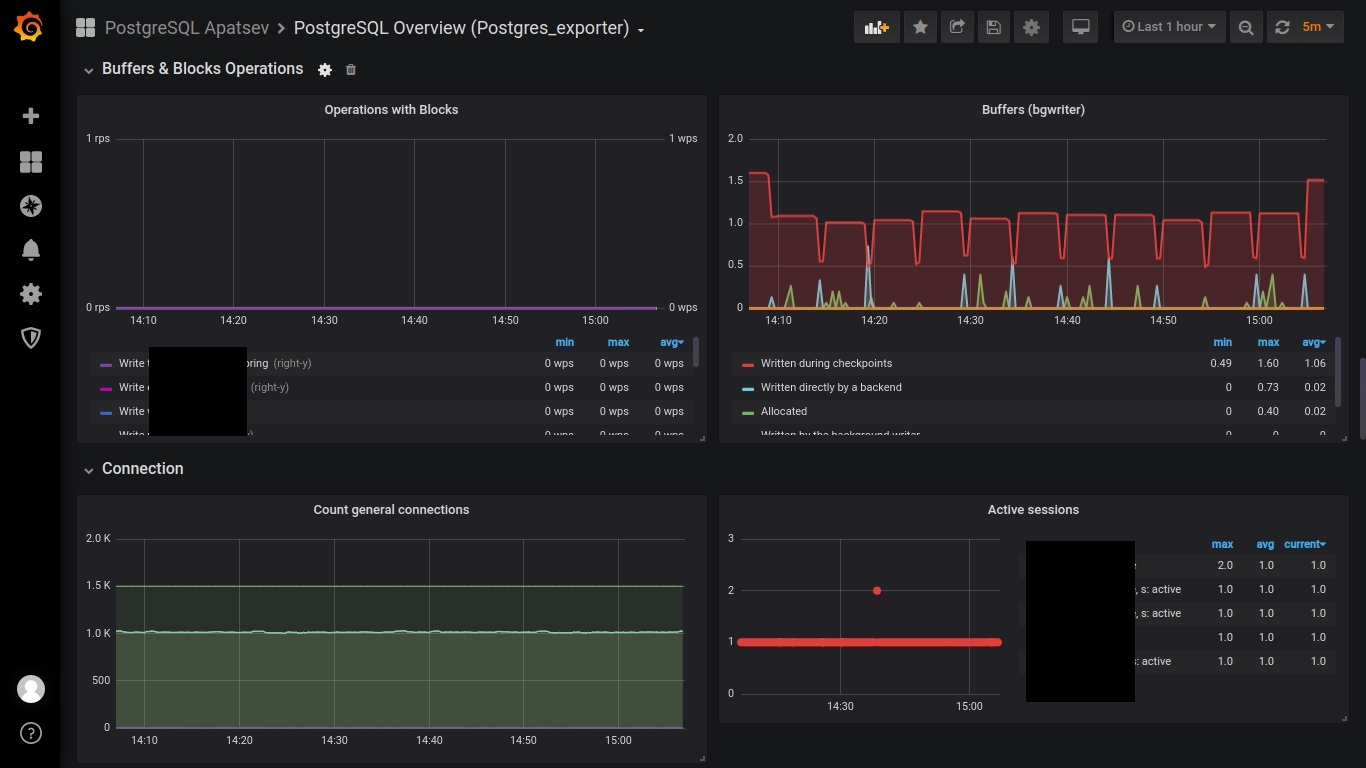
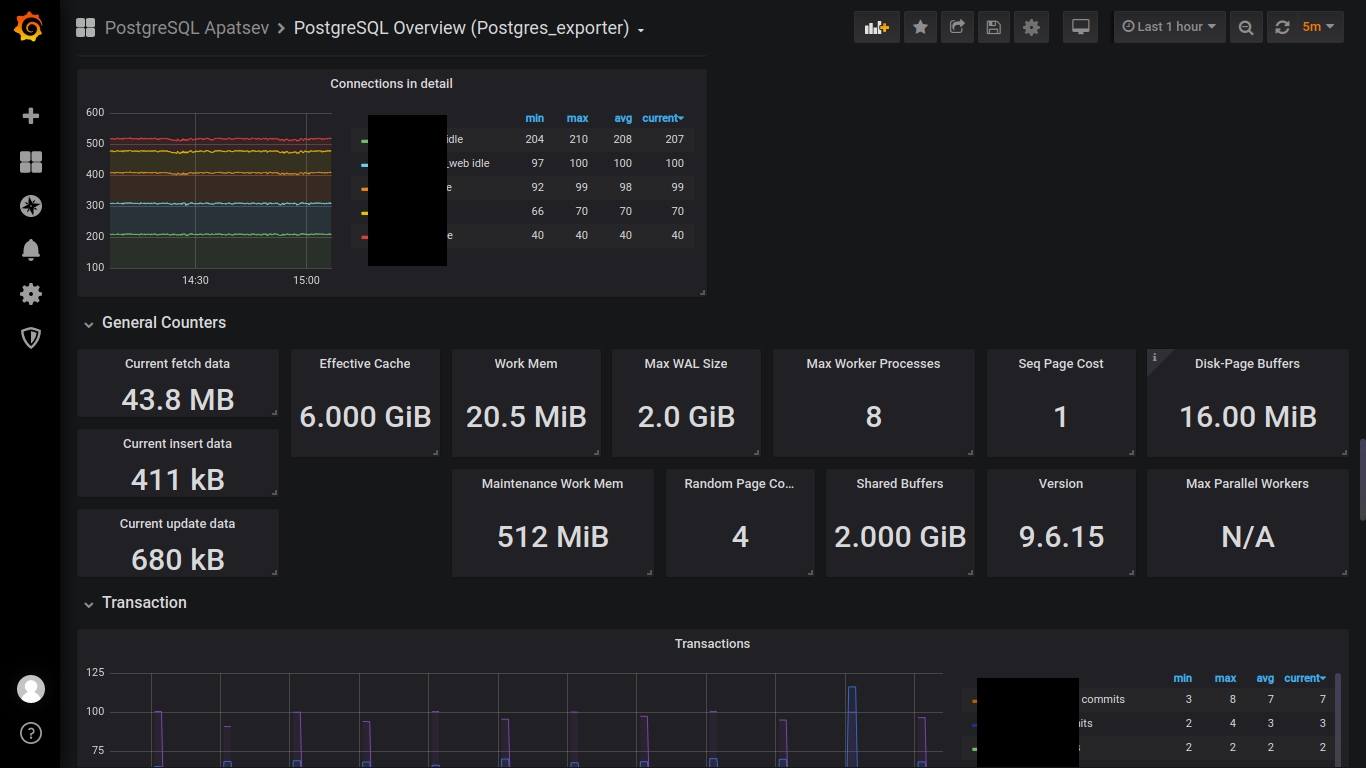
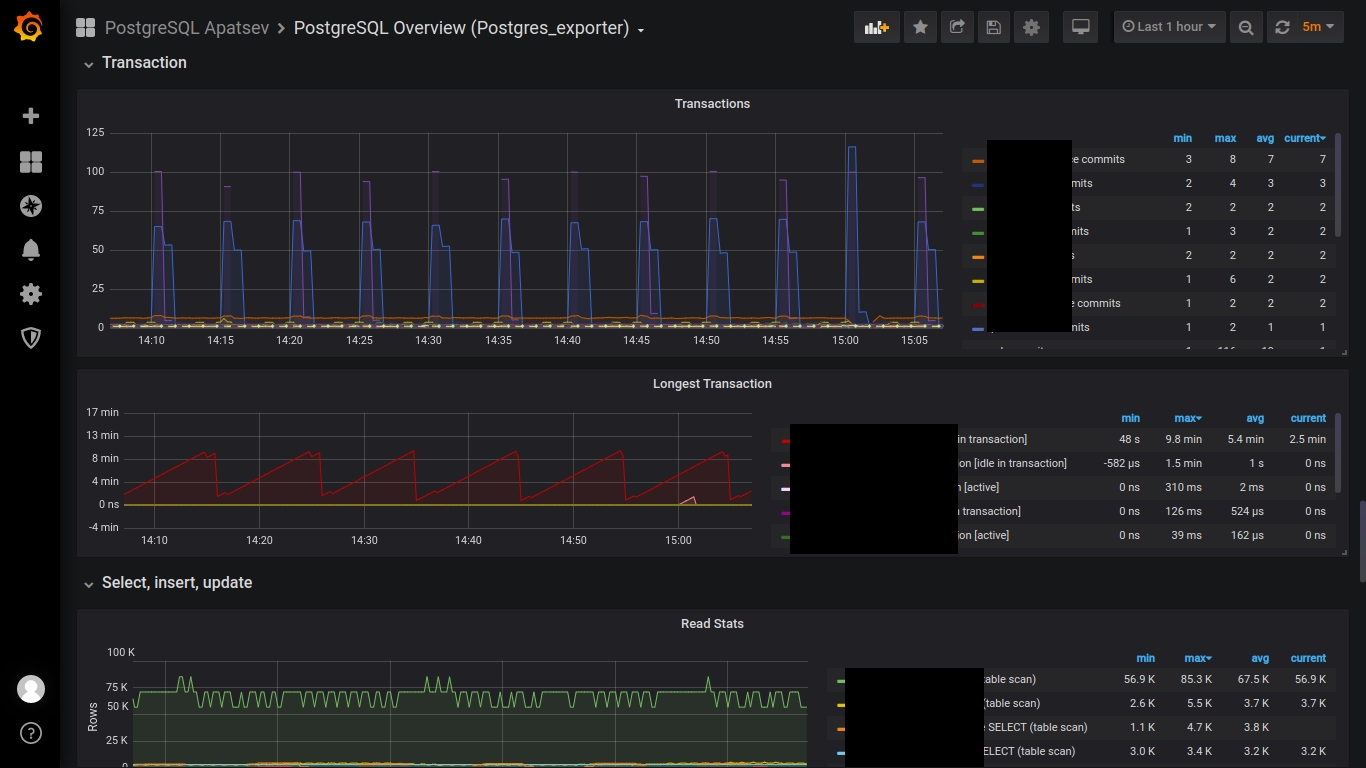
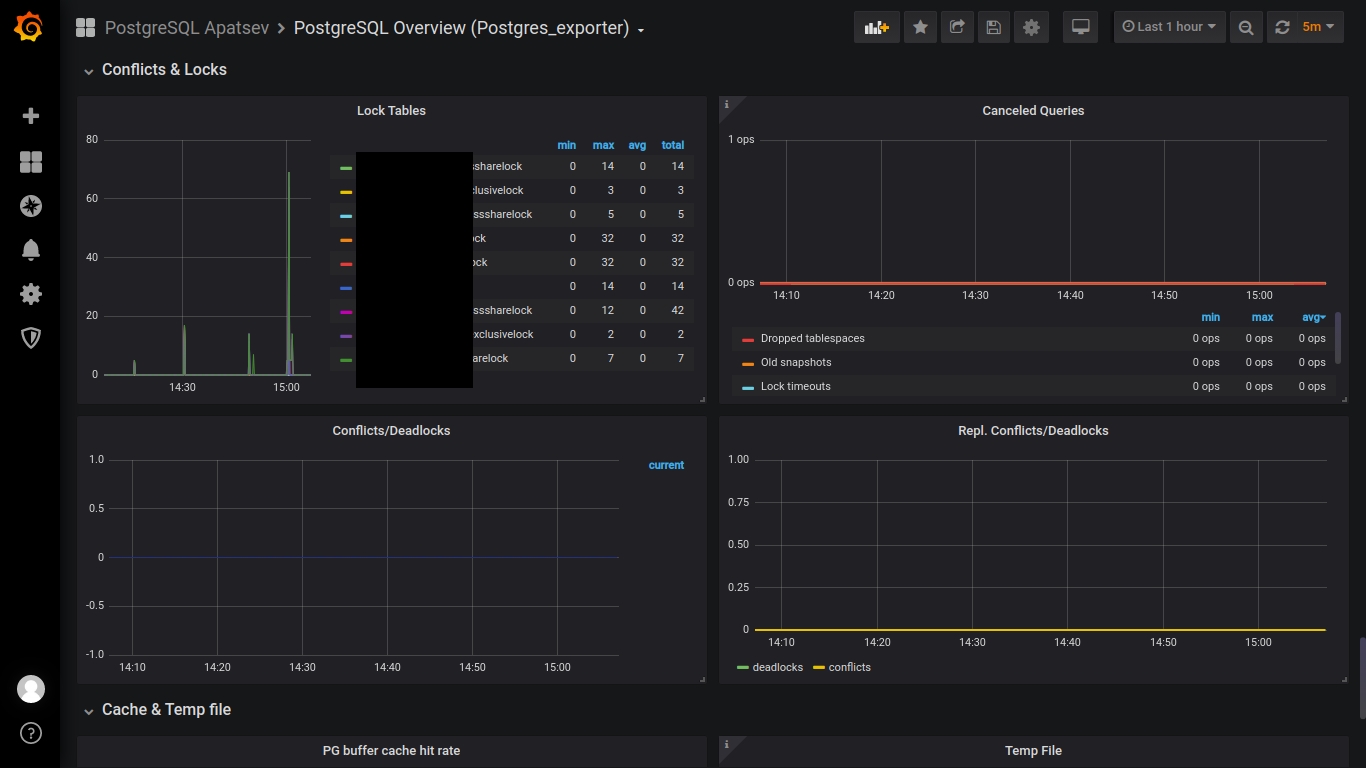
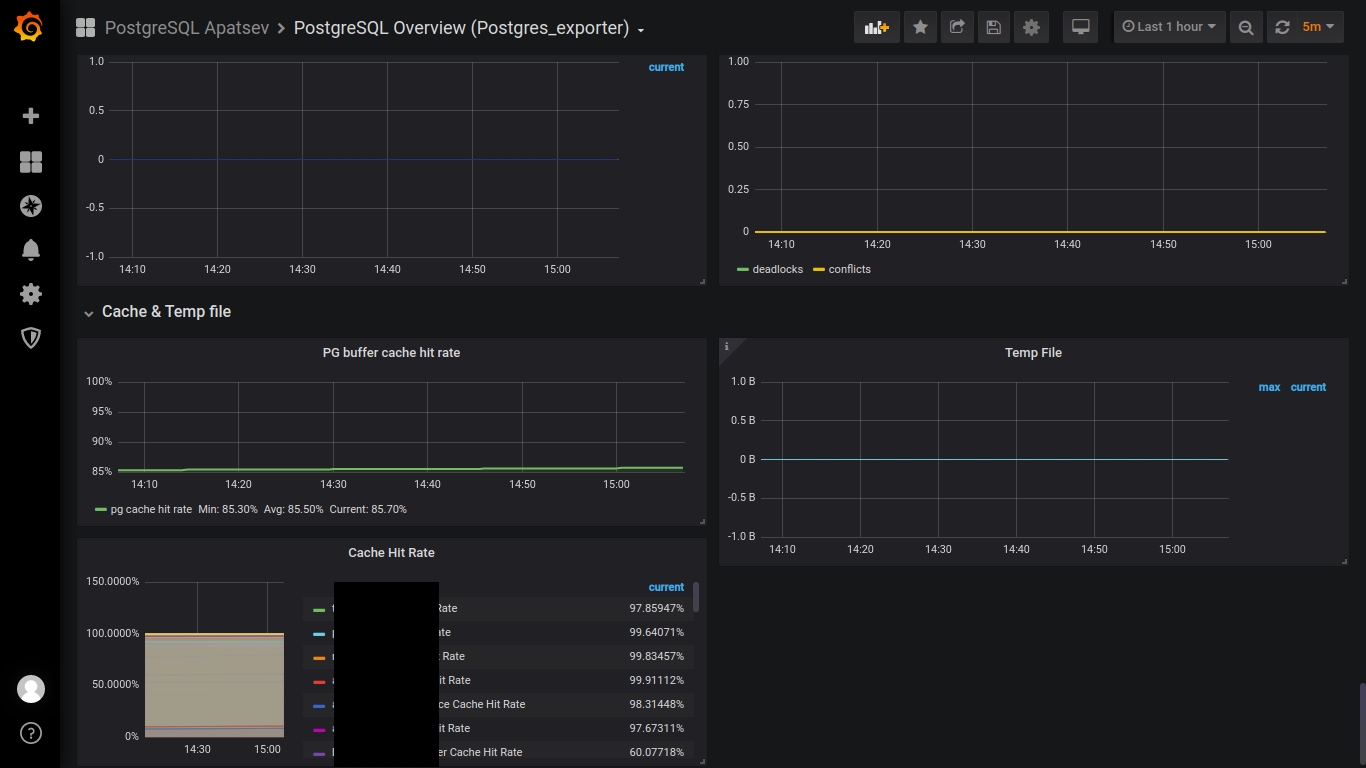
Made a dashboard Postgresql overview for postgres_exporter .
What is the difference from other postgres_exporter dashboards?
I combined all the other postgres_exporter dashboards into one.
This dashboard shows general information about the cluster.
Screenshots and short installation instructions: postgresql, postgres_exporter, prometheus, grafana under the cat.
Why not use pgwatch2 with influxdb ?
About InfluxDB1.7 ( , CORE team ):
- . . , . DB , .
- . , .
SHOW TAG KEYS FROM ALL SHOW EXACT SERIES CARDINALITY .- . 256 RAM, 320GB OOM — ( 6- , , (InMem)).
- ( OSS 0.9 (December 8, 2014) 1.0 (September 26, 2014), Enterprise ).
- breaking changes. 3 5+ ( 0.9 (December 8, 2014)). Breaking Changes — Influx 2.0, \ Buckets, Flux.
- , ifql (Flux) Continuous Queries ( task, Flux-) Chronograf( C TICK), .
- .
- — - cli, . restore backup . merge .
- TICK( T), , 1.3.2 (
[a-z]). , , Retention Policy (input,output).kafka, .. metrics -> telegraf -> kafka -> telegraf -> influx . - ( K TICK), , InfluxDB. RAM , , "", . .
PostgreSQL
yum install -y https://download.postgresql.org/pub/repos/yum/reporpms/EL-7-x86_64/pgdg-redhat-repo-latest.noarch.rpm
yum install -y postgresql96 postgresql96-server postgresql96-contrib
Initialize PostgreSQL.
/usr/pgsql-9.6/bin/postgresql96-setup initdb
In PostgreSQL, add the extension pg_stat_statements to postgresql.conf
shared_preload_libraries = 'pg_stat_statements'
Starting PostgreSQL
systemctl start postgresql-9.6
After that in the database, run the following command:
CREATE EXTENSION pg_stat_statements
Postgres_exporter and Prometheus
Clarification. Who will install postgres_exporter from binaries We install Postgres_exporter and Prometheus for Redhat systems from this repository: https://github.com/lest/prometheus-rpm
Create a file /etc/yum.repos.d/prometheus.repowith the following contents:
[prometheus]
name=prometheus
baseurl=https://packagecloud.io/prometheus-rpm/release/el/$releasever/$basearch
repo_gpgcheck=1
enabled=1
gpgkey=https://packagecloud.io/prometheus-rpm/release/gpgkey
       https://raw.githubusercontent.com/lest/prometheus-rpm/master/RPM-GPG-KEY-prometheus-rpm
gpgcheck=1
metadata_expire=300
Install prometheus2 and postgres_exporter
yum install -y prometheus2 postgres_exporter
In the prometheus.yml file for working with postgres_exporter in scrape_configs add the following section:
scrape_configs:
  - job_name: postgresql
    static_configs:
      - targets: ['ip--prometheus:9187']
        labels:
          alias: postgres
Run prometheus2 and postgres_exporter
systemctl start prometheus
systemctl start postgres_exporter
Grafana
Create a file /etc/yum.repos.d/grafana.repowith the following contents:
[grafana]
name=grafana
baseurl=https://packages.grafana.com/oss/rpm
repo_gpgcheck=1
enabled=1
gpgcheck=1
gpgkey=https://packages.grafana.com/gpg.key
sslverify=1
sslcacert=/etc/pki/tls/certs/ca-bundle.crt
Install grafana
yum -y install grafana initscripts urw-fonts wget
Launch grafana
systemctl start grafana-server
Take the dashboard here
https://grafana.com/grafana/dashboards/12273
Source code here:
https://github.com/patsevanton/postgresql_overview_postgres_exporter


PS In this dashboard I lack knowledge in promql and postgresql. Therefore, I hope that you will help me with advice on how to improve the dashboard or make a pull request.
PS. As hands reach, I plan to make a dashboard for information on a specific database inside PostgreSQL.