It happens that systems are buggy, slow down, break down. The larger the system, the more difficult it is to find the cause. To find out why something is not working as expected, to fix or prevent future problems, you need to look inside. For this, systems must possess the property of observability , which is achieved by instrumentation in the broad sense of the word.At HighLoad ++, Peter Zaitsev (Percona) reviewed the available infrastructure for tracing in Linux and talked about bpfTrace, which (as the name implies) provides many advantages. We made a text version of the report, so that it would be convenient for you to review the details and additional materials were always at hand.Instrumentation can be divided into two large blocks:- Static , when the collection of information is wired into code: recording logs, counters, time, etc.
- Dynamic , when the code is not instrumented by itself, but it is possible to do it when necessary.
Another classification option is based on the approach to recording data:- Tracing - events are generated if a certain code has worked.
- Sampling - the status of the system is checked, for example, 100 times per second and it determines what is happening in it.
Static instrumentation has existed for many years and is in almost everything. On Linux, many standard tools like Vmstat or top use it. They read data from procfs, where, roughly speaking, different timers and counters are written from the kernel code.But you cannot insert too many of these counters; you cannot cover everything in the world with them. Therefore, dynamic instrumentation can be useful, which allows you to watch exactly what you need. For example, if there are any problems with the TCP / IP stack, then you can go very deep and instruct specific details.
Dtrace
DTrace is one of the first known dynamic tracing frameworks created by Sun Microsystems. It began to be made back in 2001, and for the first time it was released in Solaris 10 in 2005. The approach turned out to be very popular and later went into many other distributions.Interestingly, DTrace allows you to instrument both kernel space and user space. You can put traces on any function calls and specifically instruct programs: introduce special DTrace tracepoints, which for users can be more understandable than the function names.This was especially important for Solaris, because it is not an open operating system. It was not possible to just look into the code and understand that tracepoint needs to be put on such a function, as it can now be done in the new open source Linux software.One of the unique, especially at that time, features of DTrace is that while tracing is not enabled, it costs nothing . It works in such a way that it simply replaces some CPU instructions with a DTrace call, which executes these instructions when it returns.In DTrace, instrumentation is written in a special D language, similar to C and Awk.Later DTrace appeared almost everywhere except Linux: on MacOS in 2007, on FreeBSD in 2008, in NetBSD in 2010. Oracle in 2011 included DTrace in Oracle Unbreakable Linux. But few people use Oracle Linux, and DTrace never entered the main Linux.Interestingly, in 2017, Oracle finally licensed DTrace under GPLv2, which in principle made it possible to include it in mainline Linux without licensing difficulties, but it was already too late. At that time, Linux had good BPF, which was mainly used for standardization.DTrace is even going to be included in Windows; now it is available in some test versions.Linux tracing
What is in Linux instead of DTrace? In fact, in Linux there is a lot of things in the best (or worst) manifestation of the open source spirit, a bunch of different tracing frameworks have accumulated over this time. Therefore, figuring out what's what is not so simple.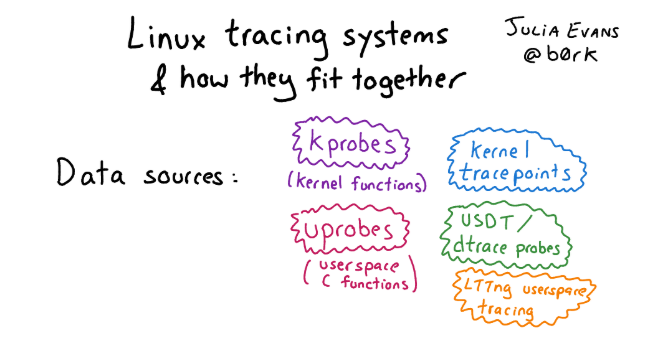 If you want to get acquainted with this variety and are interested in history, see the article with pictures and a detailed description of approaches for tracing in Linux.If we talk about the infrastructure for tracing in Linux in general, there are three levels:
- Interface for kernel instrumentation: Kprobe, Uprobe, Dtrace probe, etc.
- «», . , probe, , user space . : , user space, Kernel Module, - , eBPF.
- -, , : Perf, SystemTap, SysDig, BCC .. bpfTtrace , , .
eBPF — Linux
With all of these frameworks, eBPF has become the standard on Linux in recent years. This is a more advanced, highly flexible and effective tool that allows almost everything.What is eBPF and where did it come from? In fact, eBPF is an Extended Berkeley Packet Filter, and BPF was developed in 1992 as a virtual machine for efficient packet filtering by a firewall. Initially, he had no relation to monitoring, observability, or tracing.In more modern versions, eBPF has been expanded (hence the word extended), as a common framework for handling events . Current versions are integrated with the JIT compiler for greater efficiency.Differences of eBPF from classical BPF:- registers added;
- a stack has appeared;
- There are additional data structures (maps).
 Now people most often forget that there was an old BPF, and eBPF is simply called BPF. In most modern expressions, eBPF and BPF are one and the same. Therefore, the tool is called bpfTrace, not eBpfTrace.eBPF has been included in mainline Linux since 2014 and is gradually included in many Linux tools, including Perf, SystemTap, SysDig. There is a standardization.Interestingly, development is still underway. Modern kernels support eBPF better and better.
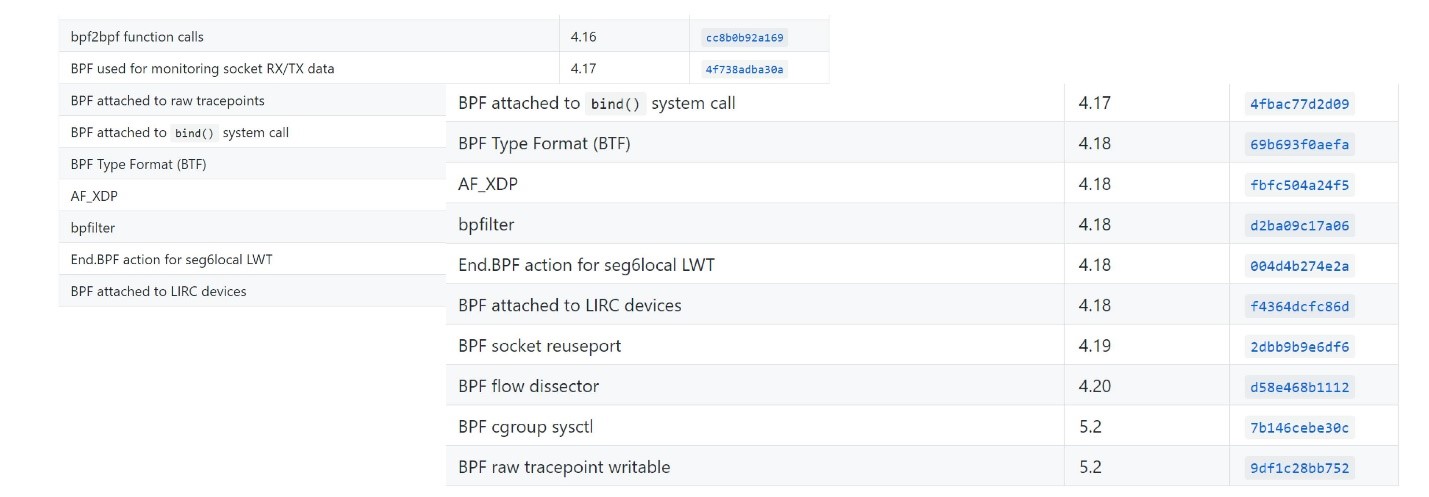 You can see what modern kernel versions have appeared here .
EBPF Programs
So what is eBPF and why is it interesting?eBPF is a program in its special bytecode , which is included directly in the kernel and performs the processing of trace events. Moreover, the fact that it is made in a special bytecode allows the kernel to carry out certain verification that the code is quite safe. For example, check that it does not use loops, because the loop in the critical section in the kernel can hang the whole system.But this does not allow to be completely secure. For example, if you write a very complex eBPF program, insert it into an event in the kernel that occurs 10 million times per second, then everything can slow down very much. But at the same time, eBPF is much safer than the old approach, when just some Kernel Modules were inserted through insmod, and anything could be in these modules. If someone made a mistake, or simply because of binary incompatibility, the whole core could fall.The eBPF code can be compiled by LLVM Clang, that is, by and large, use a subset of C to create eBPF programs, which, of course, is quite complicated. And it’s important that compilation depends on the kernel: headers are used to understand what structures are used and what they are used for, etc. This is not very convenient in the sense that either some modules related to a specific core are always supplied, or need to be recompiled.The diagram shows how eBPF works. http://www.brendangregg.com/ebpf.htmlThe user creates an eBPF program. Further, the kernel, for its part, checks and loads it. After that, eBPF can connect to various tools for traces, process information, save it in maps (data structure for temporary storage). Then the user program can read statistics, receive perf-events, etc.It shows which eBPF features in which versions of Linux kernels.
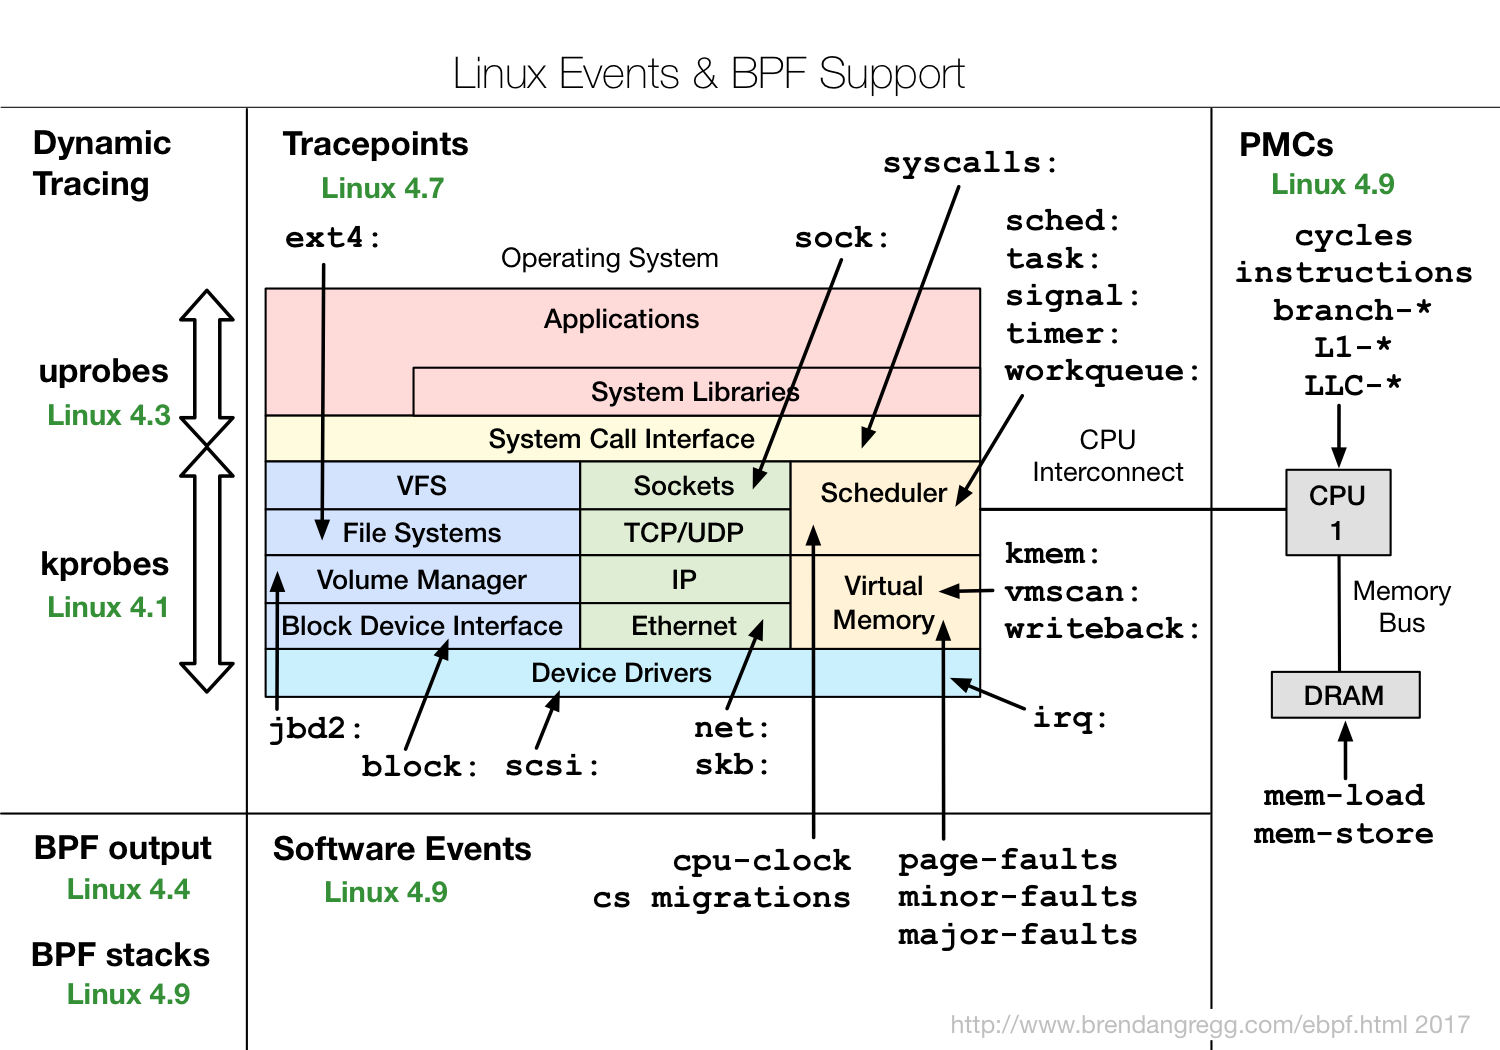 It can be seen that almost all subsystems of the Linux kernel are covered, plus there is good integration with hardware data, eBPF has access to all kinds of cache miss or branch miss prediction, etc.If you're interested in eBPF, check out the IO Visor project, it contains most of the tools. IO Visor company is engaged in their development, they will have the latest versions and very good documentation. More and more eBPF tools are appearing on Linux distributions, so I would recommend that you always use the latest available versions.
EBPF performance
In terms of performance, eBPF is quite effective. To understand how much and whether there is overhead, you can add a probe, which twitches several times per second, and check how long it takes to execute it. The guys from Cloudflare made a benchmark . A simple eBPF probe took them about 100 ns, while a more complex one took 300 ns. This means that even a complex probe can be called up on a single core about 3 million times per second. If probe jerks 100 thousand or a million times per second on a multi-core processor, then this will not affect performance too much.
Frontend for eBPF
If you're interested in eBPF and the topic of Observability in general, you've probably heard of Brendan Gregg. He writes and talks a lot about this and made such a beautiful picture that shows tools for eBPF. Here you can see that, for example, you can use Raw BPF - just write bytecode - this will give a full range of features, but it will be very difficult to work with it. Raw BPF is about how to write a web application in assembler - in principle, it is possible, but without the need to do it.Interestingly, bpfTrace, on the one hand, allows you to get almost everything from BCC and raw BPF, but it is much easier to use.In my opinion, two tools are most useful:
- BCC. Despite the fact that according to Gregg's scheme, BCC is complex, it includes many ready-made functions that can be simply launched from the command line.
- BpfTrace . It allows you to simply write your own toolkit or use ready-made solutions.
You can imagine how much easier it is to write on bpfTrace if you look at the code of the same tool in two versions.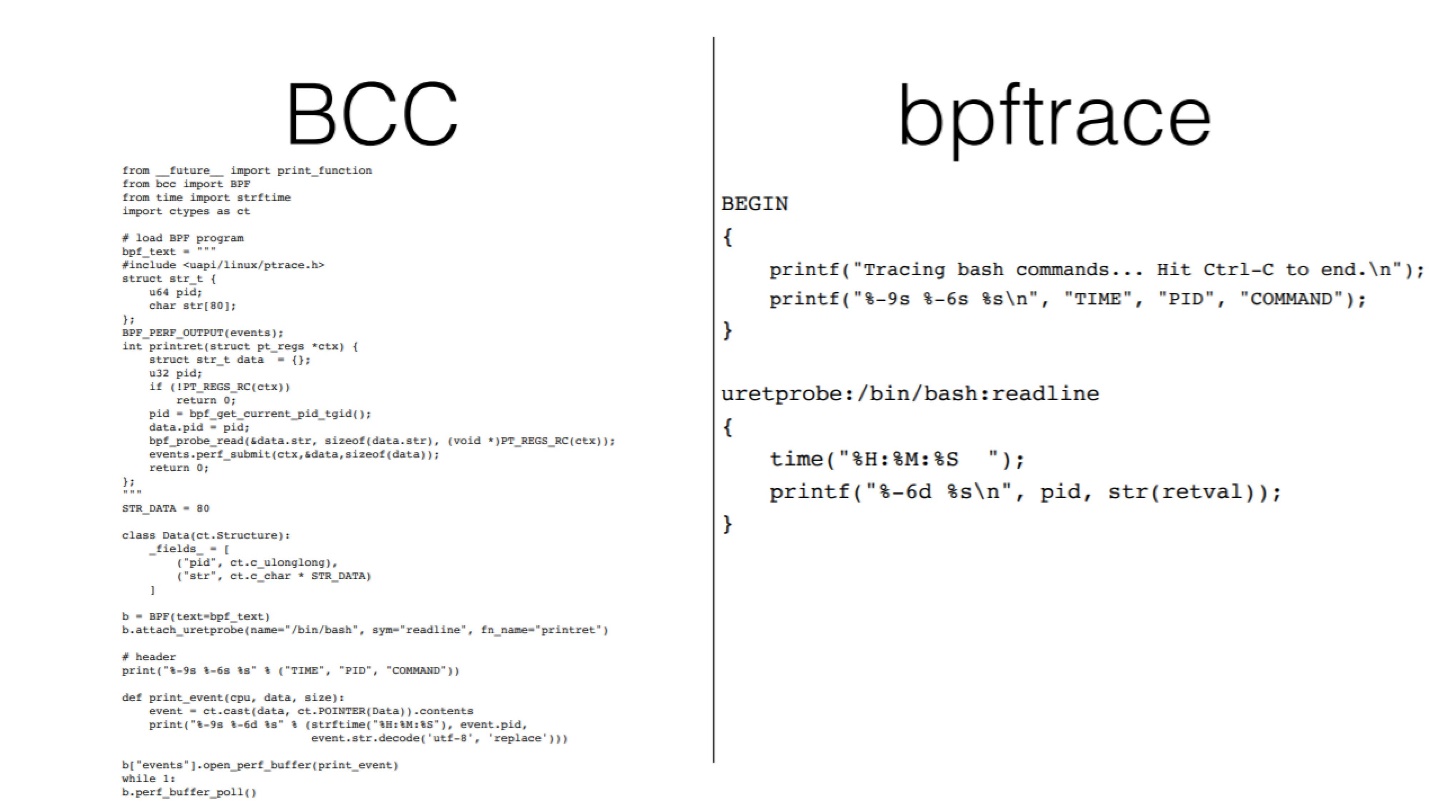
DTrace vs bpfTrace
In general, DTrace and bpfTrace are used for the same thing. http://www.brendangregg.com/blog/2018-10-08/dtrace-for-linux-2018.htmlThe difference is that there is also a BCC in the BPF ecosystem that can be used for complex tools. There is no BCC equivalent in DTrace, therefore, to make complex toolkits, usually use the Shell + DTrace bundle.When creating bpfTrace, there was no task to fully emulate DTrace. That is, you cannot take a DTrace script and run it on bpfTrace. But this doesn’t make much sense, because the logic in the lower level tools is quite simple. It is usually more important to understand which tracepoints you need to connect to, and the names of the system calls and what they directly do at a low level differ in Linux, Solaris, FreeBSD. That is where the difference arises.In this case, bpfTrace is made 15 years after DTrace. It has some additional features that DTrace does not have. For example, he can do stack traces.But of course, much is inherited from DTrace. For example, function names and syntax are similar , although not completely equivalent.The DTrace and bpfTrace scripts are close in code size and similar in complexity and language capabilities.
bpfTrace
Let's see in more detail what is in bpfTrace, how it can be used and what is needed for this.Linux requirements for using bpfTrace: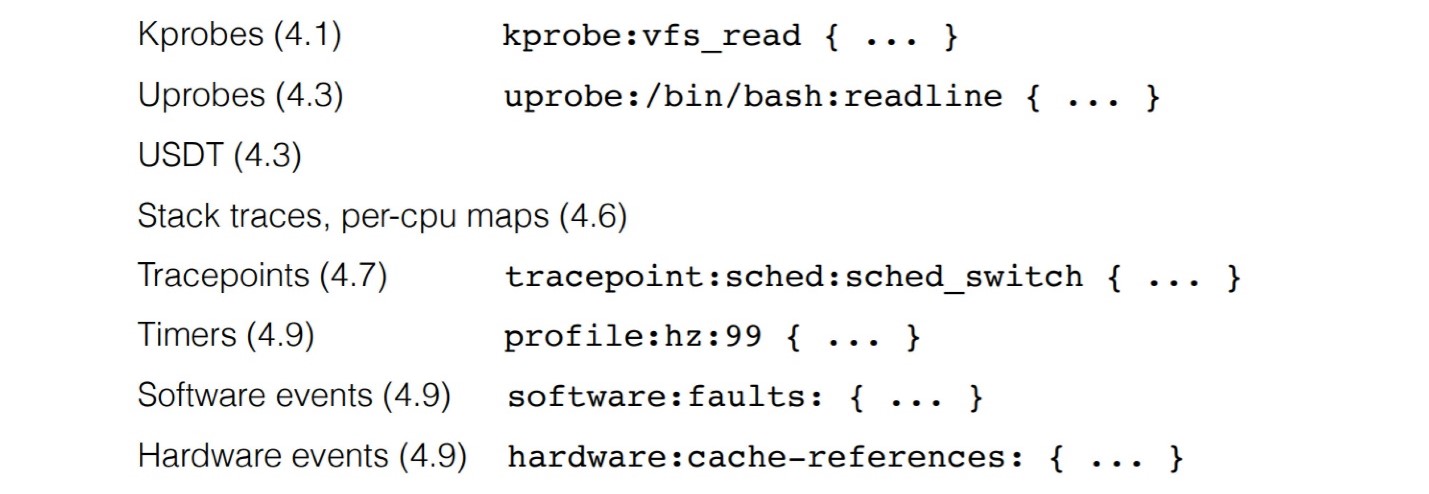 To use all the features, you need a version of at least 4.9. BpfTrace allows you to make a lot of different probes, starting with uprobe for instrumenting a function call in a user application, kernel-probes, etc.
 Interestingly, there is an uretprobe equivalent for a custom uprobe function. For kernel, the same thing is kprobe and kretprobe. This means that in fact in the tracing framework you can generate events when the function is called and upon completion of this function - this is often used for timing. Or you can analyze the values that the function returned and group them according to the parameters with which the function was called. If you catch a function call and return from it, you can do a lot of cool things.Inside bpfTrace it works like this: we write a bpf program that is parsed, converted to C, then processed through Clang, which generates bpf byte code, after which the program loads.
 The process is quite difficult, so there are limitations. On powerful servers, bpfTrace works well. But dragging Clang to a small embedded device to figure out what's going on is not a good idea. Ply is suitable for this . It, of course, does not have all the features of bpfTrace, but it generates bytecode directly.
Linux support
A stable version of bpfTrace was released about a year ago, so it is not available on older Linux distributions. It is best to take packages or compile the latest version that IO Visor distributes.Interestingly, the latest Ubuntu LTS 18.04 does not have bpfTrace, but it can be delivered using the snap package. On the one hand, this is convenient, but on the other hand, due to the way snap packages are made and isolated, not all functions will work. For kernel-tracing, a package with snap works well; for user-tracing, it may not work correctly.
Process Tracing Example
Consider the simplest example that allows you to get statistics on IO requests:bpftrace -e 'kprobe:vfs_read { @start[tid] = nsecs; }
kretprobe:vfs_read /@start[tid]/ { @ns[comm] = hist(nsecs - @start[tid]); delete(@start[tid]); }'
Here we connect to the function vfs_read, both kretprobe and kprobe. Further for each thread ID (tid), that is, for each request, we track the beginning and end of its execution. Data can be grouped not only by the totality of the entire system, but also by different processes. Below is the IO output for MySQL. The classic bimodal I / O distribution is visible. A large number of fast requests are data that is read from the cache. The second peak is reading data from disk, where latency is much higher.You can save this as a script (the bt extension is usually used), write comments, format it and just use it further
 #bpftrace read.bt.// read.bt file
tracepoint:syscalls:sys_enter_read
{
@start[tid] = nsecs;
}
tracepoint:syscalls:sys_exit_read / @start[tid]/
{
@times = hist(nsecs - @start[tid]);
delete(@start[tid]);
}
The general concept of the language is quite simple.- Syntax: select probe to connect
probe[,probe,...] /filter/ { action }. - Filter: specify a filter, for example, only data on a given process of a given Pid.
- Action: a mini-program that converts directly to a bpf program and runs when bpfTrace is called.
More details can be found here .Bpftrace tools
BpfTrace also has a toolbox. Many fairly simple tools on BCC are now implemented on bpfTrace. The collection is still small, but there is something that is not in the BCC. For example, killsnoop allows you to track the signals caused by kill ().If you are interested in looking at the bpf code, then in bpfTrace you can
 -vsee the generated byte code through . This is useful if you want to understand a heavy probe or not. Having looked at the code and just having estimated its size (one page or two), you can understand how complicated it is.
MySQL tracing example
Let me show you an example of MySQL, how it works. MySQL has a function dispatch_commandin which all MySQL query executions occur.bpftrace -e 'uprobe:/usr/sbin/mysqld:dispatch_command { printf("%s\n", str(arg2)); }'
failed to stat uprobe target file /usr/sbin/mysqld: No such file or directory
I just wanted to connect an uprobe to print the text of queries that come to MySQL - a primitive task. Got a problem - says that there is no such file. Like not when here it is:root@mysql1:/# ls -la /usr/sbin/mysqld
-rwxr-xr-x 1 root root 60718384 Oct 25 09:19 /usr/sbin/mysqld
These are just surprises with snap. If set via snap, then there may be problems at the application level.Then I installed through the apt version, a newer Ubuntu, started again:root@mysql1:~# bpftrace -e 'uprobe:/usr/sbin/mysqld:dispatch_command { printf("%s\n", str(arg2)); }'
Attaching 1 probe...
Could not resolve symbol: /usr/sbin/mysqld:dispatch_command
“There is no such symbol” - how not ?! I look through nmwhether there is such a symbol or not:root@mysql1:~# nm -D /usr/sbin/mysqld | grep dispatch_command
00000000005af770 T
_Z16dispatch_command19enum_server_commandP3THDPcjbb
root@localhost:~# bpftrace -e 'uprobe:/usr/sbin/mysqld:_Z16dispatch_command19enum_server_commandP3THDPcjbb { printf("%s\n", str(arg2)); }'
Attaching 1 probe...
select @@version_comment limit 1
select 1
There is such a symbol, but since MySQL is compiled from C ++, mangling is used there. In fact, the present name of the function that is used in this command, the following: _Z16dispatch_command19enum_server_commandP3THDPcjbb. If you use it in a function, then you can connect and get the result. In the perf ecosystem, many tools make unmangling automatic, and bpfTrace is not yet able.Also pay attention to the flag -Dfor nm. It is important because MySQL, and now many other packages, come without dynamic symbols (debug symbols) - they come in other packages. If you want to use these characters, you need a flag -D, otherwise nm will not see them.: ++ 25–26 , . , , .
: ++ Online . 5 900 , , -.
: DevOpsConf 2019 HighLoad++ 2019 — , .
— , .