Hello everyone. In May, OTUS launches a workshop on monitoring and logging , both infrastructure and applications, using Zabbix, Prometheus, Grafana and ELK. In this regard, we traditionally share useful material on the topic.
Blackbox exporter for Prometheus allows you to monitor external services through HTTP, HTTPS, DNS, TCP, ICMP. In this article, I will show you how to configure HTTP / HTTPS monitoring using the Blackbox exporter. We will launch Blackbox exporter in Kubernetes.Environment
We will need the following:- Kubernetes
- Prometheus operator
Blackbox exporter configuration
We configure Blackbox through ConfigMapto configure httpthe web services monitoring module.apiVersion: v1
kind: ConfigMap
metadata:
name: prometheus-blackbox-exporter
labels:
app: prometheus-blackbox-exporter
data:
blackbox.yaml: |
modules:
http_2xx:
http:
no_follow_redirects: false
preferred_ip_protocol: ip4
valid_http_versions:
- HTTP/1.1
- HTTP/2
valid_status_codes: []
prober: http
timeout: 5s
The module is http_2xxused to verify that the web service returns an HTTP 2xx status code. The configuration of the blackbox exporter is described in more detail in the documentation .Deploy blackbox exporter in Kubernetes cluster
Describe Deploymentand Servicefor deployment in Kubernetes.---
kind: Service
apiVersion: v1
metadata:
name: prometheus-blackbox-exporter
labels:
app: prometheus-blackbox-exporter
spec:
type: ClusterIP
ports:
- name: http
port: 9115
protocol: TCP
selector:
app: prometheus-blackbox-exporter
---
apiVersion: apps/v1
kind: Deployment
metadata:
name: prometheus-blackbox-exporter
labels:
app: prometheus-blackbox-exporter
spec:
replicas: 1
selector:
matchLabels:
app: prometheus-blackbox-exporter
template:
metadata:
labels:
app: prometheus-blackbox-exporter
spec:
restartPolicy: Always
containers:
- name: blackbox-exporter
image: "prom/blackbox-exporter:v0.15.1"
imagePullPolicy: IfNotPresent
securityContext:
readOnlyRootFilesystem: true
runAsNonRoot: true
runAsUser: 1000
args:
- "--config.file=/config/blackbox.yaml"
resources:
{}
ports:
- containerPort: 9115
name: http
livenessProbe:
httpGet:
path: /health
port: http
readinessProbe:
httpGet:
path: /health
port: http
volumeMounts:
- mountPath: /config
name: config
- name: configmap-reload
image: "jimmidyson/configmap-reload:v0.2.2"
imagePullPolicy: "IfNotPresent"
securityContext:
runAsNonRoot: true
runAsUser: 65534
args:
- --volume-dir=/etc/config
- --webhook-url=http:
resources:
{}
volumeMounts:
- mountPath: /etc/config
name: config
readOnly: true
volumes:
- name: config
configMap:
name: prometheus-blackbox-exporter
The blackbox exporter can be deployed using the following command. The namespace monitoringrefers to the Prometheus Operator.kubectl --namespace=monitoring apply -f blackbox-exporter.yaml
Verify that all services are running using the following command:kubectl --namespace=monitoring get all --selector=app=prometheus-blackbox-exporter
Check Blackbox
You can access the exporter Blackbox web interface with port-forward:kubectl --namespace=monitoring port-forward svc/prometheus-blackbox-exporter 9115:9115
Connect to the exporter's Blackbox web interface through a web browser at localhost : 9115.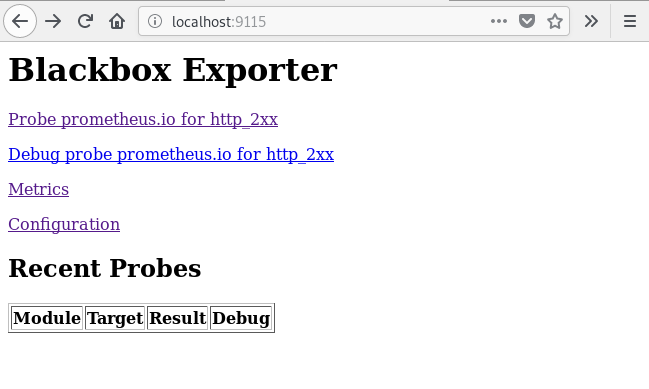 If you go to the address http: // localhost: 9115 / probe? Module = http_2xx & target = https: //www.google.com , you will see the result of checking the specified URL ( https://www.google.com ).
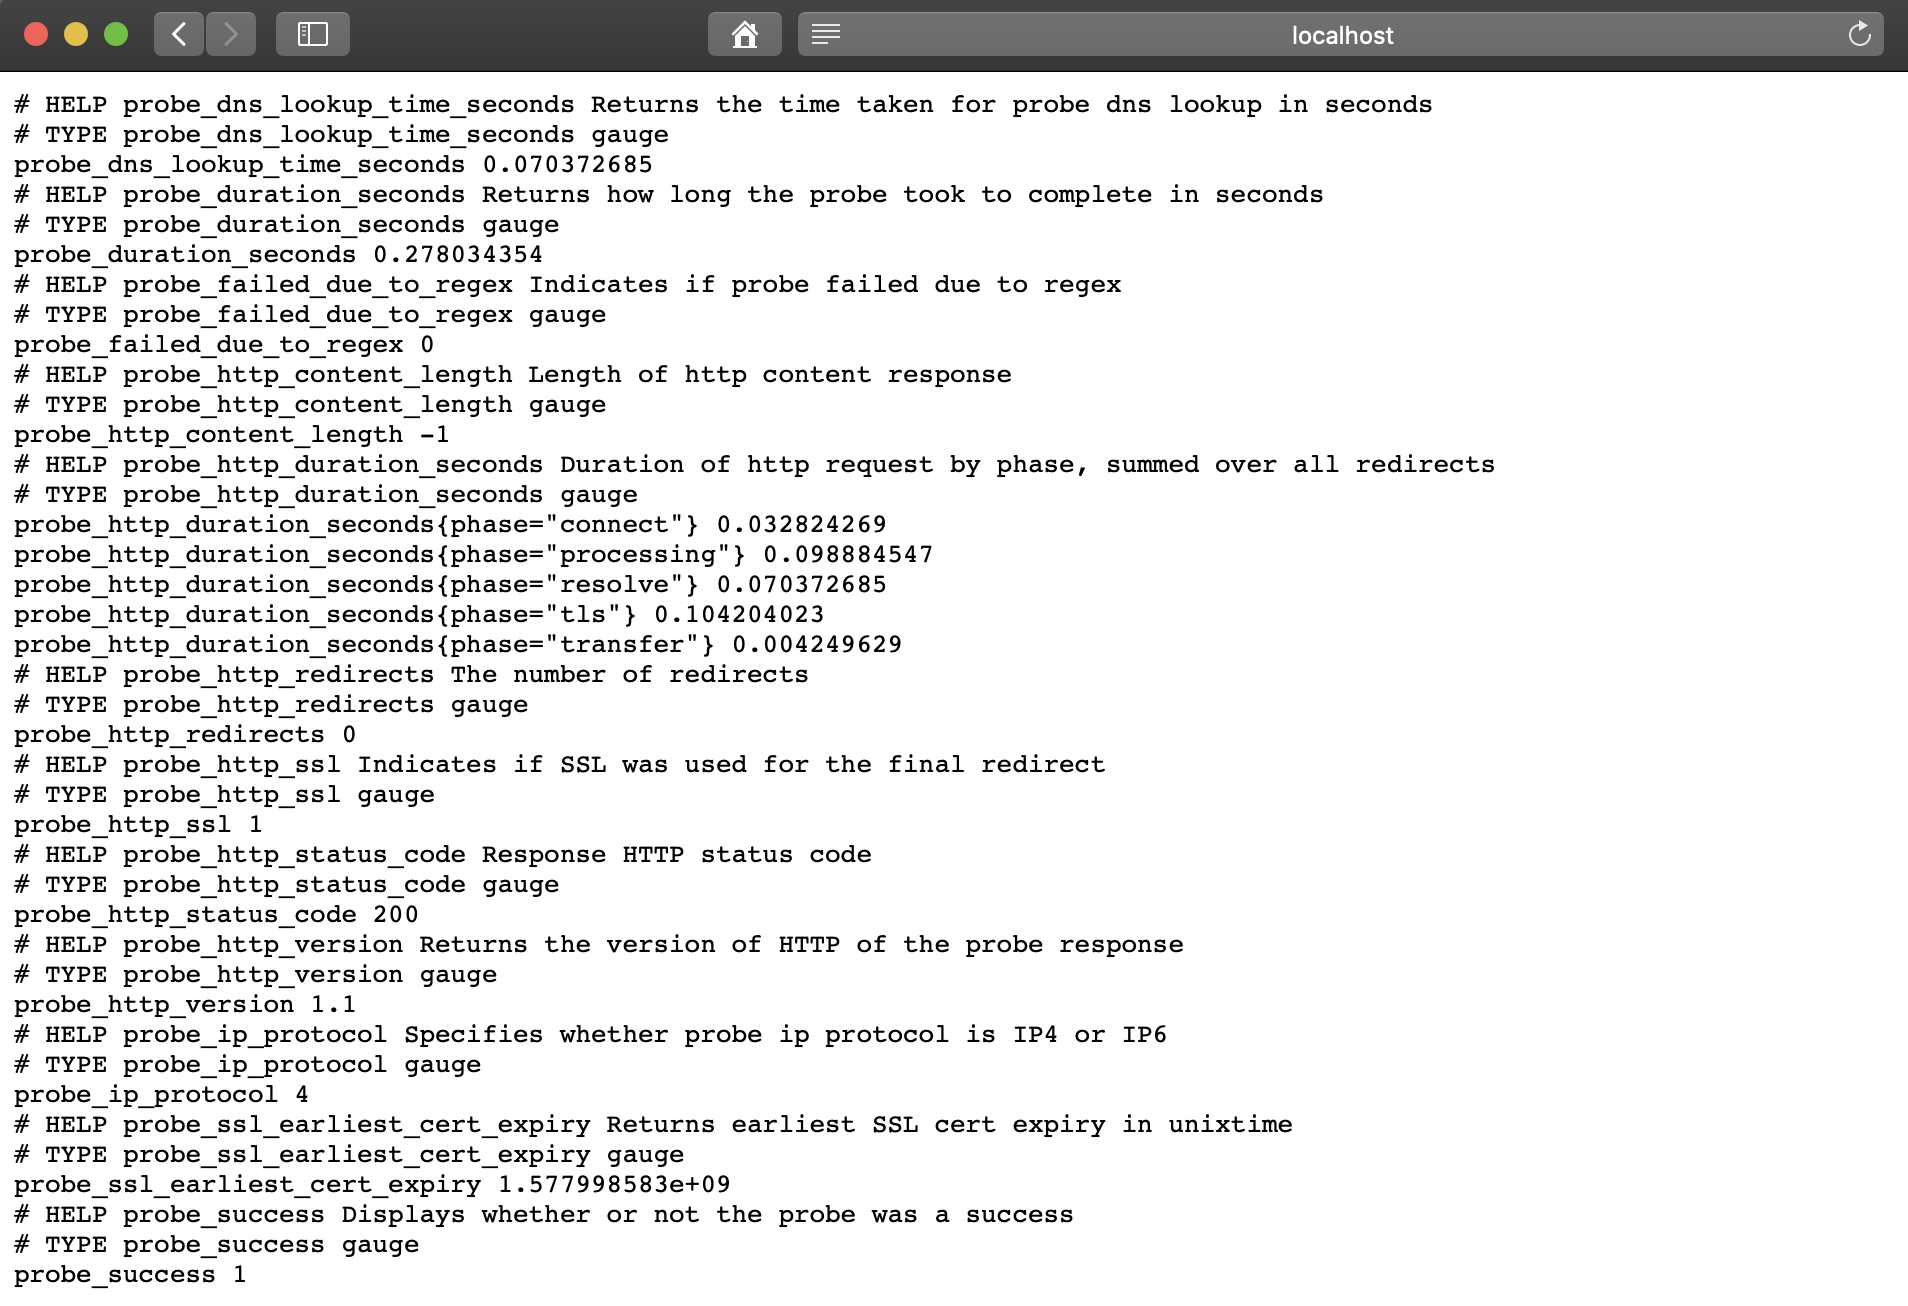 A metric
 probe_successvalue of 1 means a successful check. A value of 0 indicates an error.Setting up Prometheus
After deploying the BlackBox exporter, configure Prometheus prometheus-additional.yaml.- job_name: 'kube-api-blackbox'
scrape_interval: 1w
metrics_path: /probe
params:
module: [http_2xx]
static_configs:
- targets:
- https:
- http:
- https:
relabel_configs:
- source_labels: [__address__]
target_label: __param_target
- source_labels: [__param_target]
target_label: instance
- target_label: __address__
replacement: prometheus-blackbox-exporter:9115 # The blackbox exporter.
Generate Secretusing the following command.PROMETHEUS_ADD_CONFIG=$(cat prometheus-additional.yaml | base64)
cat << EOF | kubectl --namespace=monitoring apply -f -
apiVersion: v1
kind: Secret
metadata:
name: additional-scrape-configs
type: Opaque
data:
prometheus-additional.yaml: $PROMETHEUS_ADD_CONFIG
EOF
Specify additional-scrape-configsfor the Prometheus Operator using additionalScrapeConfigs.kubectl --namespace=monitoring edit prometheuses k8s
...
spec:
additionalScrapeConfigs:
key: prometheus-additional.yaml
name: additional-scrape-configs
We go into the Prometheus web interface, check metrics and goals.kubectl --namespace=monitoring port-forward svc/prometheus-k8s 9090:9090
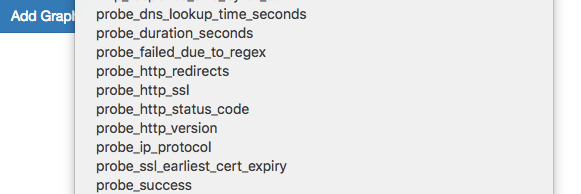
 We see the metrics and goals of the Blackbox.
Adding rules for notifications (alert)
To receive notifications from the Blackbox exporter, add the rules to the Prometheus Operator.kubectl --namespace=monitoring edit prometheusrules prometheus-k8s-rules
...
- name: blackbox-exporter
rules:
- alert: ProbeFailed
expr: probe_success == 0
for: 5m
labels:
severity: error
annotations:
summary: "Probe failed (instance {{ $labels.instance }})"
description: "Probe failed\n VALUE = {{ $value }}\n LABELS: {{ $labels }}"
- alert: SlowProbe
expr: avg_over_time(probe_duration_seconds[1m]) > 1
for: 5m
labels:
severity: warning
annotations:
summary: "Slow probe (instance {{ $labels.instance }})"
description: "Blackbox probe took more than 1s to complete\n VALUE = {{ $value }}\n LABELS: {{ $labels }}"
- alert: HttpStatusCode
expr: probe_http_status_code <= 199 OR probe_http_status_code >= 400
for: 5m
labels:
severity: error
annotations:
summary: "HTTP Status Code (instance {{ $labels.instance }})"
description: "HTTP status code is not 200-399\n VALUE = {{ $value }}\n LABELS: {{ $labels }}"
- alert: SslCertificateWillExpireSoon
expr: probe_ssl_earliest_cert_expiry - time() < 86400 * 30
for: 5m
labels:
severity: warning
annotations:
summary: "SSL certificate will expire soon (instance {{ $labels.instance }})"
description: "SSL certificate expires in 30 days\n VALUE = {{ $value }}\n LABELS: {{ $labels }}"
- alert: SslCertificateHasExpired
expr: probe_ssl_earliest_cert_expiry - time() <= 0
for: 5m
labels:
severity: error
annotations:
summary: "SSL certificate has expired (instance {{ $labels.instance }})"
description: "SSL certificate has expired already\n VALUE = {{ $value }}\n LABELS: {{ $labels }}"
- alert: HttpSlowRequests
expr: avg_over_time(probe_http_duration_seconds[1m]) > 1
for: 5m
labels:
severity: warning
annotations:
summary: "HTTP slow requests (instance {{ $labels.instance }})"
description: "HTTP request took more than 1s\n VALUE = {{ $value }}\n LABELS: {{ $labels }}"
- alert: SlowPing
expr: avg_over_time(probe_icmp_duration_seconds[1m]) > 1
for: 5m
labels:
severity: warning
annotations:
summary: "Slow ping (instance {{ $labels.instance }})"
description: "Blackbox ping took more than 1s\n VALUE = {{ $value }}\n LABELS: {{ $labels }}"
In the Prometheus web interface, go to Status => Rules and find the alert rules for blackbox-exporter.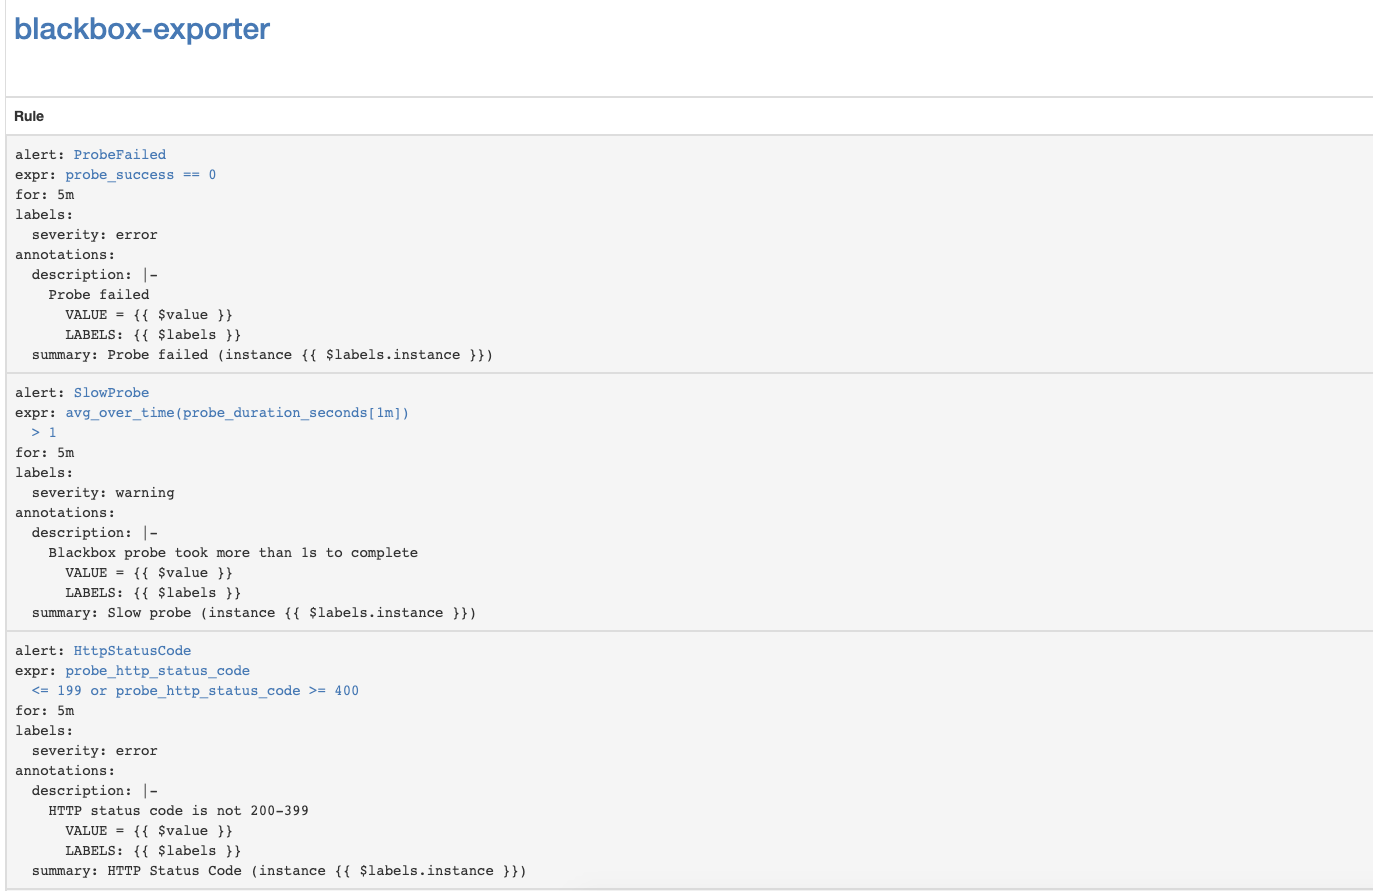
Configure Kubernetes API Server SSL Certificate Expiration Notifications
Let's set up monitoring the expiration of Kubernetes API Server SSL certificates. He will send notifications once a week.Add the Blackbox exporter module for Kubernetes API Server Authentication.kubectl --namespace=monitoring edit configmap prometheus-blackbox-exporter
...
kube-api:
http:
method: GET
no_follow_redirects: false
preferred_ip_protocol: ip4
tls_config:
insecure_skip_verify: false
ca_file: /var/run/secrets/kubernetes.io/serviceaccount/ca.crt
bearer_token_file: /var/run/secrets/kubernetes.io/serviceaccount/token
valid_http_versions:
- HTTP/1.1
- HTTP/2
valid_status_codes: []
prober: http
timeout: 5s
Adding the Prometheus scrape configuration- job_name: 'kube-api-blackbox'
metrics_path: /probe
params:
module: [kube-api]
static_configs:
- targets:
- https:
relabel_configs:
- source_labels: [__address__]
target_label: __param_target
- source_labels: [__param_target]
target_label: instance
- target_label: __address__
replacement: prometheus-blackbox-exporter:9115 # The blackbox exporter.
Apply Prometheus SecretPROMETHEUS_ADD_CONFIG=$(cat prometheus-additional.yaml | base64)
cat << EOF | kubectl --namespace=monitoring apply -f -
apiVersion: v1
kind: Secret
metadata:
name: additional-scrape-configs
type: Opaque
data:
prometheus-additional.yaml: $PROMETHEUS_ADD_CONFIG
EOF
Add alert ruleskubectl --namespace=monitoring edit prometheusrules prometheus-k8s-rules
...
- name: k8s-api-server-cert-expiry
rules:
- alert: K8sAPIServerSSLCertExpiringAfterThreeMonths
expr: probe_ssl_earliest_cert_expiry{job="kube-api-blackbox"} - time() < 86400 * 90
for: 1w
labels:
severity: warning
annotations:
summary: "Kubernetes API Server SSL certificate will expire after three months (instance {{ $labels.instance }})"
description: "Kubernetes API Server SSL certificate expires in 90 days\n VALUE = {{ $value }}\n LABELS: {{ $labels }}"
useful links
Monitoring and logging in Docker