Introduction
In the previous articlewe have examined with you the issue of integrating the Webix framework into Electron and creating a simple GUI application based on these frameworks. The purpose of this article is to further develop the issue of integration into a GUI interface built with the help of Electron and Webix of other JavaScript frameworks. All GUI elements implemented in "Webix" are characterized by the "view" parameter. Depending on the value of this parameter, one or another GUI element will be displayed. The number of types of "view" elements that allows you to create "Webix" overlap about 90% of the tasks when implementing the interface. The remaining 10% is just the case when it is necessary to integrate either previously written code or a framework (library) that are not explicitly supported in Webix.To implement integration with third-party frameworks (libraries), we will create together with you our “view” Webix element.Formulation of the problem
Create a GUI application “Electron + Webix”, which will build a graph of a function of the form “y = a * sin (b) + c” with the ability to change the parameters of the function “a, b and c” with a dynamic redraw of the graph.Small reservation
Immediately make a reservation that in "Webix" there are standard very powerful tools for working with charts. My goal is not to supplement these tools, but to show how you can integrate additional frameworks or libraries into the Electron + Webix bundle. It just so happened that I had a ready-made code for this graph using “D3.js” and I decided to integrate it into the application.Tools
- Visual Studio Code - editor code.visualstudio.com .
- Node.JS - download from here nodejs.org/en
- Electron - install "npm install --save-dev electron".
- Webix – ru.webix.com.
- JQuery – «npm jquery»
- D3.js – d3js.org
- (https://github.com/kapakym/electron_webix) , .
1. Since I am a lazy person, I don’t want to write all the code from the beginning for the second time. Therefore, we take the code from the previous article and fill it in the folder we need. There are two options. The first is just to download the archive from the site (Fig. 1) or to clone it if you have the Git client installed (Fig. 2). Fig. 1 - Downloading source code from a site
 Fig. 2 - Cloning the repository2. In order not to get confused later, rename the folder (this is optional), for example, like “electron_webix_2” and open it in Visual Studio Code (Fig. 3).
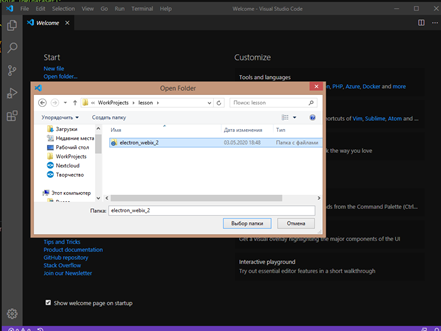 Fig. 3 - Open the project3. Install the necessary elements. The first thing you need to do is download from the link provided in the tools above “Node.JS” and install it. Without “Node.JS”, you can’t do anything further. Next, open the “Ctr +` ”console in Visual Studio Code and enter the following commands one by one (Fig. 4):
- "Npm install --save-dev electron";
- "Npm install jquery".
 Fig. 4 - Installing Node.JS and JQuery4. Next, you and I will still need the “D3.js” framework, we also download it using the link from the tools (“d3.zip” file). From the downloaded archive “d3.zip” we extract the file “d3.js” and put it in the “libs” folder (Fig. 5).
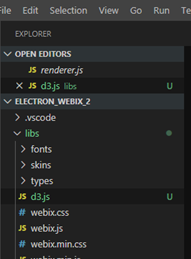 Fig. 5 - Adding the D3.js libraryAt this workstation, we have prepared.
Typing up the interface
Now that the workplace is prepared, let's go directly to the creation of our application. It will consist of the following "view" elements:- - toolbar, a standard Webix element. This element will be placed at the top of the window and will contain the window control buttons and the name of the application. We have already created this interface element in the materials of the previous article, and here we will not change anything;
- - myview, which you and I will just have to create, so to speak, a custom “view”. It will be the area in which the graph of our function will be built using the “D3.js” framework. Among other things, this area will be taught to adapt to the size of the window of our application. Place it in the middle of the application window;
- - slider, a standard element of “Webix”. This element allows you to change its value using the so-called "slider". We will create 3 pieces of such elements, each will be responsible for changing a certain parameter of our function “a, b or c”. Place them at the bottom of the application window.
Let's get started. Open the file “renderer.js” and edit it ie we remove the elements we do not need from the previous article and replace them with the elements described above.The “renderer.js” file was like this:
const { remote } = require('electron')
let WIN = remote.getCurrentWindow()
const webix = require('./libs/webix.min.js')
$ = require('jquery')
webix.ui(
{
"id": 1587908357897,
"rows": [
{
"css": "webix_dark",
"view": "toolbar",
"height": 0,
"cols": [
{ "view": "label", "label": "Elcetron +Webix its cool!", css:"head_win" },
{ "label": "-", "view": "button", "height": 38, "width": 40, id:"min-bt" },
{ "label": "+", "view": "button", "height": 38, "width": 40, id:"max-bt" },
{ "label": "x", "view": "button", "height": 38, "width": 40, id:"close-bt" }
]
},
{
"width": 0,
"height": 0,
"cols": [
{ "url": "demo->5ea58f0e73f4cf00126e3769", "view": "sidebar", "width": 177 },
{
"width": 0,
"height": 0,
"rows": [
{ "template": "Hello WORLD! ", "view": "template" },
{
"url": "demo->5ea58f0e73f4cf00126e376d",
"type": "bar",
"xAxis": "#value#",
"yAxis": {},
"view": "chart"
}
]
}
]
}
]
}
)
$$("close-bt").attachEvent("onItemClick", () => {
const window = remote.getCurrentWindow();
window.close();
})
$$("min-bt").attachEvent("onItemClick", () => {
const window = remote.getCurrentWindow();
window.minimize();
})
$$("max-bt").attachEvent("onItemClick", () => {
const window = remote.getCurrentWindow();
if (!window.isMaximized()) {
window.maximize();
} else {
window.unmaximize();
}
})
It will become like this:
const { remote } = require('electron')
let WIN = remote.getCurrentWindow()
const webix = require('./libs/webix.min.js')
$ = require('jquery')
webix.ui(
{
"id": 1587908357897,
"rows": [
{
"css": "webix_dark",
"view": "toolbar",
"height": 0,
"cols": [
{ "view": "label", "label": "Electron + Webix + D3.js", css:"head_win" },
{ "label": "-", "view": "button", "height": 38, "width": 40, id:"min-bt" },
{ "label": "+", "view": "button", "height": 38, "width": 40, id:"max-bt" },
{ "label": "x", "view": "button", "height": 38, "width": 40, id:"close-bt" }
]
},
{ "view": "myview", id: "d3_chart" },
{
"cols": [
{
"label": "Amplitude", "title": "#value#", "value": 50, "view": "slider", id: "slider_amplitude",
},
{
"label": "Bias", "title": "#value#", "value": 0, "view": "slider", "height": 38, id: "slider_scope", min:-50, max:50, step:1,
},
{
"label": "Frequency", "title": "#value#", "value": 0.005, "view": "slider", "height": 38, id: "slider_freq", min:0, max:0.1, step:0.001,
}
]
}
]
}
)
$$("close-bt").attachEvent("onItemClick", () => {
const window = remote.getCurrentWindow();
window.close();
})
$$("min-bt").attachEvent("onItemClick", () => {
const window = remote.getCurrentWindow();
window.minimize();
})
$$("max-bt").attachEvent("onItemClick", () => {
const window = remote.getCurrentWindow();
if (!window.isMaximized()) {
window.maximize();
} else {
window.unmaximize();
}
})
Let us consider in more detail what parameters include "{" view ":" myview ", id:" d3_chart "}":- view: myview - type "view", while it does not exist, we have not created it yet;- id: d3_chart - “Webix” id, we will use it to refer to our element.I will also explain the parameters of the “slider” element for completeness:- view: slider - type “view”, slider;- label: “text” - a label that will be displayed on the slider;- title: "#value" - the current displayed value of the slider;- value: “value” - default slider value;- min: "value" - the minimum value of the slider;- max: "value" - the maximum value of the slider ";- step:" value "- the step of changing the value of the slider.You can read more about all the parameters of Webix elements here docs.webix.com/desktop__components.htmlCreate "myview"
Now create a file “view_chart.js” in which we define our new type “myview” and open it in “VSC”. Fig. 6 - Getting started editing view_chart.js
Add the following code to it:webix.protoUI({
name: "myview",
$init: function () {
},
redraw: function (a, b, c) {
},
}, webix.ui.view);
The webix.protoUI function is designed to create custom Webix elements based on standard elements. Consider the parameters that are passed to this function:- name - name of the created item;
- $ init is a function that will be launched when an element is created. In other words, it is a constructor;
- redraw - our function with you, which will be responsible for redrawing the graph of the function. We will pass on the values of the parameters of our variables “a, b and c”
- webix.ui.view is the parent of our element.
You can read more about webix.protoUI here.So, when the framework of our “view” is ready, we will write a couple of functions that will be responsible for plotting the sin graph.The function for calculating the values of the sin function will look like:function calcsin(a, b, c) {
dataset = [];
for (var i = 1; i < 360; i++) {
dataset.push({ "x": i, "y": a * Math.sin(b * i) + c });
};
};
Everything is very simple here, we substitute the parameter values into the mathematical function sin and save the result in an array. Add it to the end of the file "view_chart.js".Next, add to the end of the file “view_chart.js” a function that will draw a graph using the D3.js framework, it will look like this:function drawSin() {
$(document).ready(function () {
width = $("#mycontent").width() - margin.left - margin.right
height = $("#mycontent").height() - margin.top - margin.bottom;
var xScale = d3.scaleLinear()
.domain([0, 360])
.range([0, width]);
var yScale = d3.scaleLinear()
.domain([-100, 100])
.range([height, 0]);
var line = d3.line()
.x(function (d, i) { return xScale(d.x); })
.y(function (d) { return yScale(d.y); })
.curve(d3.curveMonotoneX)
var svg = d3.select("#mycontent").append("svg")
.attr("float", "center")
.attr("class", "webix_chart")
.attr("width", width + margin.left + margin.right)
.attr("height", height + margin.top + margin.bottom)
.append("g")
.attr("transform", "translate(" + margin.left + "," + margin.top + ")")
svg.append("g")
.attr("class", "x axis")
.attr("transform", "translate(0," + height/2 + ")")
.call(d3.axisBottom(xScale));
svg.append("g")
.attr("class", "y axis")
.call(d3.axisLeft(yScale))
svg.append("path")
.datum(dataset)
.attr("class", "line")
.attr("d", line);
})
}
The order of the given function is as follows:- calculate the size of the graph relative to the div element into which it is packed “width” and “height”;- we scale the values of the graph by “X” and “Y”;- create an "html" element "svg" in which we draw the "X" axis, the "Y" axis and the graph itself;Now that the functions for calculating and rendering our chart are ready, we’ll connect a couple of libraries and declare several variables at the beginning of the “view_chart.js” file:
const d3 = require("./libs/d3")
$ = require('jquery')
var dataset = [];
var margin = { top: 50, right: 50, bottom: 50, left: 50 }
, width = $("#mycontent").width() - margin.left - margin.right
, height = $("#mycontent").height() - margin.top - margin.bottom;
Variables “width” and “height” will store the width and height of the chart, taking into account the indentation.Next, go back to the function "webix.protoUI" and write its functionality:webix.protoUI({
name: "myview",
$init: function () {
this.$view.innerHTML = "<div id='mycontent'></div>"
calcsin(60, 0.05, 0)
drawSin()
},
redraw: function (a, b, c) {
$("#mycontent").html("")
calcsin(a, b, c)
drawSin()
},
}, webix.ui.view);
Filled with content two functions. The first “init” is executed only once when creating the “view”. The second will be called when we need to redraw the chart.Now the full contents of the file "view_chart.js" will look like this:
const d3 = require("./libs/d3")
$ = require('jquery')
var dataset = [];
var margin = { top: 50, right: 50, bottom: 50, left: 50 }
, width = $("#mycontent").width() - margin.left - margin.right
, height = $("#mycontent").height() - margin.top - margin.bottom;
webix.protoUI({
name: "myview",
$init: function () {
this.$view.innerHTML = "<div id='mycontent'></div>"
calcsin(60, 0.05, 0)
drawSin()
},
redraw: function (a, b, c) {
$("#mycontent").html("")
calcsin(a, b, c)
drawSin()
},
}, webix.ui.view);
function drawSin() {
$(document).ready(function () {
width = $("#mycontent").width() - margin.left - margin.right
height = $("#mycontent").height() - margin.top - margin.bottom;
var xScale = d3.scaleLinear()
.domain([0, 360])
.range([0, width]);
var yScale = d3.scaleLinear()
.domain([-100, 100])
.range([height, 0]);
var line = d3.line()
.x(function (d, i) { return xScale(d.x); })
.y(function (d) { return yScale(d.y); })
.curve(d3.curveMonotoneX)
var svg = d3.select("#mycontent").append("svg")
.attr("float", "center")
.attr("class", "webix_chart")
.attr("width", width + margin.left + margin.right)
.attr("height", height + margin.top + margin.bottom)
.append("g")
.attr("transform", "translate(" + margin.left + "," + margin.top + ")")
svg.append("g")
.attr("class", "x axis")
.attr("transform", "translate(0," + height/2 + ")")
.call(d3.axisBottom(xScale));
svg.append("g")
.attr("class", "y axis")
.call(d3.axisLeft(yScale))
svg.append("path")
.datum(dataset)
.attr("class", "line")
.attr("d", line);
})
}
function calcsin(a, b, c) {
    dataset = [];
    for (var i = 1; i < 360; i++) {
        dataset.push({ "x": i, "y": a * Math.sin(b * i) + c });
    };
};
Next, you need to connect the contents of the file "view_chart.js" in the file "renderer.js". Why do we need to add the line “require (" ./ view_chart.js ") to the top of the renderer.js file as shown below:
const { remote } = require('electron')
let WIN = remote.getCurrentWindow()
const webix = require('./libs/webix.min.js')
$ = require('jquery')
require("./view_chart.js")
Now you need to add a couple of styles to the “styles.css” file, open it and add the “svg path” and “#mycontent” styles as shown below:.head_win {
-webkit-app-region: drag;
}
svg path{
stroke: #666;
fill: none;
stroke-width: 1;
}
#mycontent {
text-align: center;
overflow: none;
border: 1px solid black;
background-color: antiquewhite;
height: calc(100% - 2px);
}
After you’ve finished with the styles, you can try to run our application and see what happened. So, press “F5” and after that a window should appear on the screen as shown in Figure 7. Fig. 7 - Window of our applicationWhat do we see on it? The upper part is the standard Webix toolbar. The middle part is the chart we created in myview. The lower part is three sliders that we must teach to change the values of the parameters of our function.
Let's make the sliders work
Now let's move on to the step in which we will redraw the graph in the middle of our application, depending on the values of the “Amplitude”, “Bias” and “Frequency” sliders. Why do we add the “onChange” event handler to the sliders as shown below:
{
"label": "Amplitude", "title": "#value#", "value": 50, "view": "slider", id: "slider_amplitude",
on: {
onChange: function () {
$$("d3_chart").redraw($$("slider_amplitude").getValue(), $$("slider_freq").getValue(), $$("slider_scope").getValue());
}
}
},
{
"label": "Bias", "title": "#value#", "value": 0, "view": "slider", "height": 38, id: "slider_scope", min:-50, max:50, step:1,
on: {
onChange: function () {
$$("d3_chart").redraw($$("slider_amplitude").getValue(), $$("slider_freq").getValue(), $$("slider_scope").getValue());
}
}
},
{
"label": "Frequency", "title": "#value#", "value": 0.005, "view": "slider", "height": 38, id: "slider_freq", min:0, max:0.1, step:0.001,
on: {
onChange: function () {
$$("d3_chart").redraw($$("slider_amplitude").getValue(), $$("slider_freq").getValue(), $$("slider_scope").getValue());
}
}
}
In this handler, we will access our element by its “id” and call the “redraw” function that we created earlier to redraw the chart, passing it the current values of the sliders. Click “F5”, run our application and try to change the values (Fig. 8).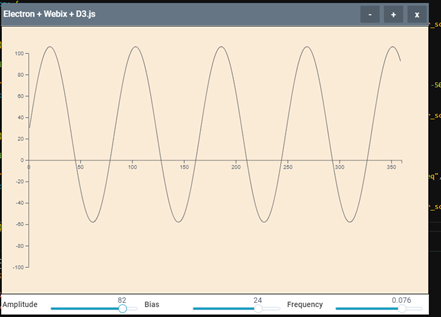 Fig. 8 - Checking the functionality of the sliders
Pull the graph after the window
And finally, we add a function that will adapt our chart to the size of the window when it changes. Why do we open the file “view_chart.js” in the editor and add a handler at its end that catches window changes as shown below:window.onresize = function ( e ) {
$("#mycontent").html("")
drawSin()
}
This function works when the window is resized. Its functionality comes down to clearing the contents of the “mycontent” block and redrawing the graph (calling the “drawSin ()” function). Each time the drawSin () function is called, the width and height variables are assigned the current information about the sizes (height and width) of the mycontent block, after which the graph will change the scale to fit the block dimensions.Conclusion
That's all. I hope this information will be useful to you. Thank! Sources can be downloaded here .