For many tasks, delays between the client and server are critical, for example, in online games, video / voice conferences, IP telephony, VPN, etc. If the server is too far from the client at the IP network level, then delays (popularly known as “ping”, “lag”) will interfere with the work.The geographical proximity of the server is not always equal to the proximity at the IP routing level. So, for example, a server in another country may be “closer” to you than a server in your city. All because of the features of routing and networking. How to choose a server as close as possible to all potential customers? What is IP network connectivity? How to direct the client to the nearest server? Let's look at the article.
We measure delays
First, learn how to measure latency. This task is not as simple as it might seem, because for different protocols and packet sizes, delays may vary. You can also not notice short-term phenomena, such as failures lasting several milliseconds.ICMP - regular ping
We will use the Unix ping utility, it allows you to manually set the intervals between packages, which the ping version for windows does not know. This is important, because if the pauses between packets are long, you just can’t see what is happening between them.Packet size (option -s) - by default, ping sends packets of size 64 bytes. With such small packets, phenomena that occur with large packets may not be noticeable, so we will set the packet size to 1300 bytes.The interval between packets (option -i) - the time between sending data. By default, packets are sent once per second, it takes a very long time, real programs send hundreds and thousands of packets per second, so we set the interval to 0.1 second. The program simply does not allow less.As a result, the command looks like this:ping -s 1300 -i 0.1 yandex.ru
This design allows you to see a more realistic picture of delays.Ping over UDP and TCP
In some cases, TCP connections are not handled in the same way as ICMP packets, and because of this, the measurements may differ depending on the protocol. It also often happens that the host simply does not respond to ICMP, and regular ping does not work. So, for example, the host microsoft.com makes a lifetime .The nping utility from the developers of the famous nmap scanner can generate any packages. It can also be used to measure delays.Since UDP and TCP work on specific ones, we need to "ping" a specific port. Let's try to ping TCP 80, that is, the web server port:$ sudo nping --tcp -p 80 --delay 0.1 -c 0 microsoft.com
Starting Nping 0.7.80 ( https://nmap.org/nping ) at 2020-04-30 13:07 MSK
SENT (0.0078s) TCP 10.0.0.1:63236 > 13.77.161.179:80 S ttl=64 id=49156 iplen=40 seq=3401731188 win=1480
SENT (0.1099s) TCP 10.0.0.1:63236 > 13.77.161.179:80 S ttl=64 id=49156 iplen=40 seq=3401731188 win=1480
RCVD (0.2068s) TCP 13.77.161.179:80 > 10.0.0.1:63236 SA ttl=43 id=0 iplen=44 seq=1480267007 win=64240 <mss 1440>
SENT (0.2107s) TCP 10.0.0.1:63236 > 13.77.161.179:80 S ttl=64 id=49156 iplen=40 seq=3401731188 win=1480
RCVD (0.3046s) TCP 13.77.161.179:80 > 10.0.0.1:63236 SA ttl=43 id=0 iplen=44 seq=1480267007 win=64240 <mss 1440>
SENT (0.3122s) TCP 10.0.0.1:63236 > 13.77.161.179:80 S ttl=64 id=49156 iplen=40 seq=3401731188 win=1480
RCVD (0.4247s) TCP 13.77.161.179:80 > 10.0.0.1:63236 SA ttl=42 id=0 iplen=44 seq=2876862274 win=64240 <mss 1398>
Max rtt: 112.572ms | Min rtt: 93.866ms | Avg rtt: 101.093ms
Raw packets sent: 4 (160B) | Rcvd: 3 (132B) | Lost: 1 (25.00%)
Nping done: 1 IP address pinged in 0.43 seconds
By default, nping sends 4 packets and stops. The -c 0 option enables the infinite sending of packages. To stop the program, press Ctrl + C. At the end, statistics will be shown. We see that the average rtt (round-trip time) is 101ms.MTR - traceroute on steroids
The MTR program (English My Traceroute) is an advanced utility for tracing routes to a remote host. Unlike the regular system utility traceroute (in windows it is the tracert utility), it can show delays to each host in the packet chain. Also knows how to trace routes not only via ICMP, but also via UDP and TCP.$ sudo mtr microsoft.com
 (Clickable) The interface of the MTR program. A route trace has been started to microsoft.comMTR immediately shows ping to each host in the chain, moreover, the data is constantly updated while the program is running and you can see short-term changes.The screenshot shows that there are packet losses on the No.6 node, but in reality this is not entirely true, because some routers can simply drop packets with expired TTL and not return an error response, so data on packet losses can be ignored here.
WiFi vs cable
 This topic is not entirely relevant to the article, but in my opinion it is very important in the context of delays. I really like WiFi, but if I have even the slightest opportunity to connect a cable to the Internet, I will use it. Also, I always discourage people from using WiFi cameras.If you play serious online shooters, broadcast video streaming, trade on the exchange: please use the Internet via cable.Here is a visual test for comparing WiFi and cable connectivity. This is ping to a WiFi router, that is, not even the Internet. (Clickable) Comparison of ping to a WiFi router via cable and WiFi
It can be seen that WiFi delays are 1ms longer and sometimes there are packets with delays ten times longer! And this is only a short period of time. In this case, the same router produces stable delays <1ms.
This topic is not entirely relevant to the article, but in my opinion it is very important in the context of delays. I really like WiFi, but if I have even the slightest opportunity to connect a cable to the Internet, I will use it. Also, I always discourage people from using WiFi cameras.If you play serious online shooters, broadcast video streaming, trade on the exchange: please use the Internet via cable.Here is a visual test for comparing WiFi and cable connectivity. This is ping to a WiFi router, that is, not even the Internet. (Clickable) Comparison of ping to a WiFi router via cable and WiFi
It can be seen that WiFi delays are 1ms longer and sometimes there are packets with delays ten times longer! And this is only a short period of time. In this case, the same router produces stable delays <1ms.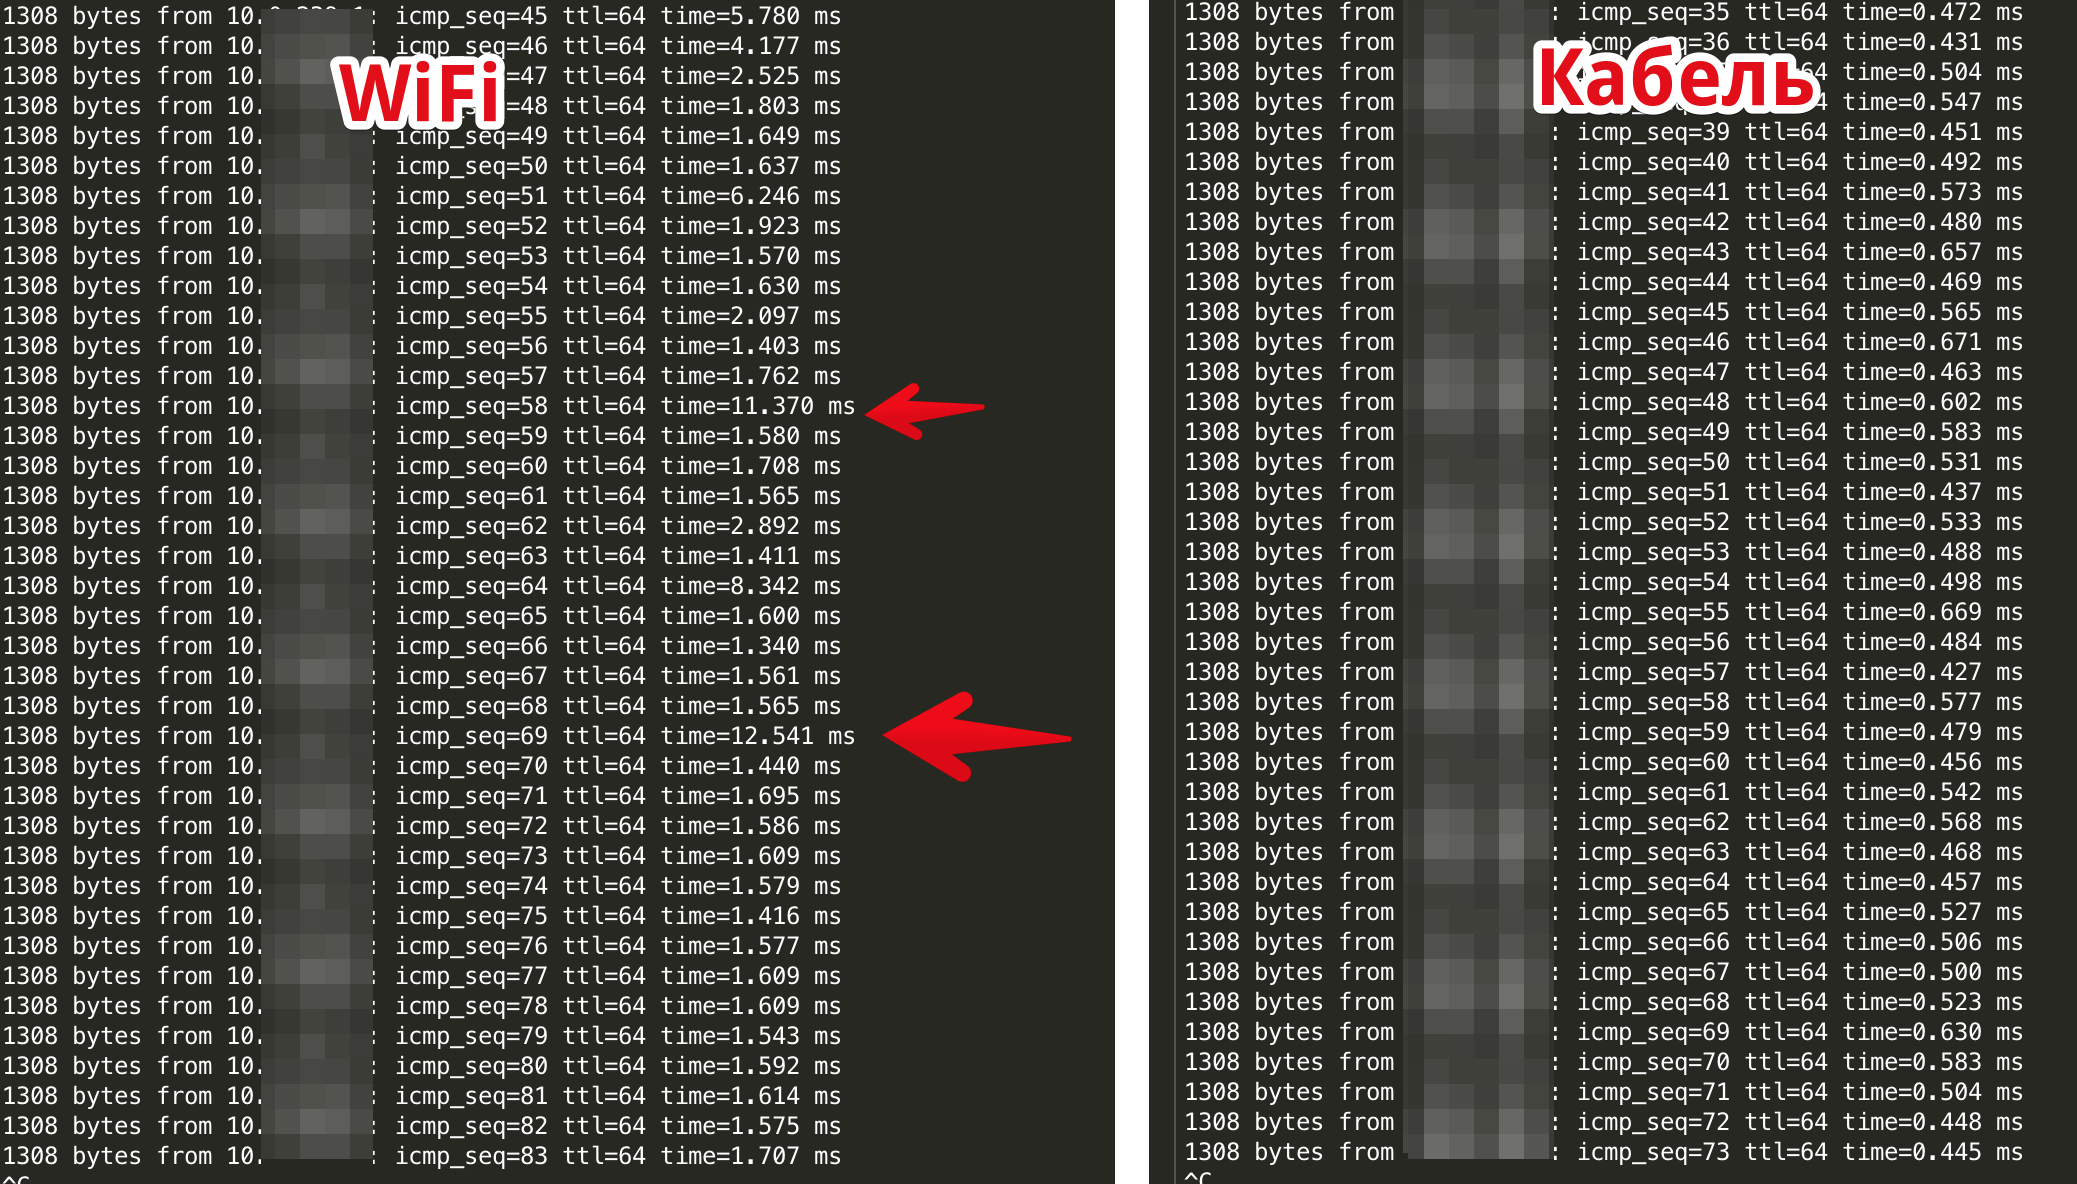 In the example above, WiFi 802.11n at 2.4GHz is used, only a laptop and a phone are connected to the access point via WiFi. If there were more customers on the access point, the results would be much worse. That is why I am so against the transfer of all office computers to WiFi, if there is the opportunity to reach them with a cable.
IP connectivity
So, we learned how to measure the delay to the server, try to find the nearest server to us. To do this, we can see how the routing of our provider is arranged. For this, it is convenient to use the bgp.he.net service . When entering the site, we see that our IP address belongs to the autonomous system AS42610 .Looking at the connectivity graph of autonomous systems, we can see through which superior providers our provider is connected to the rest of the world. Each of the points is clickable, you can go in and read what kind of provider it is.
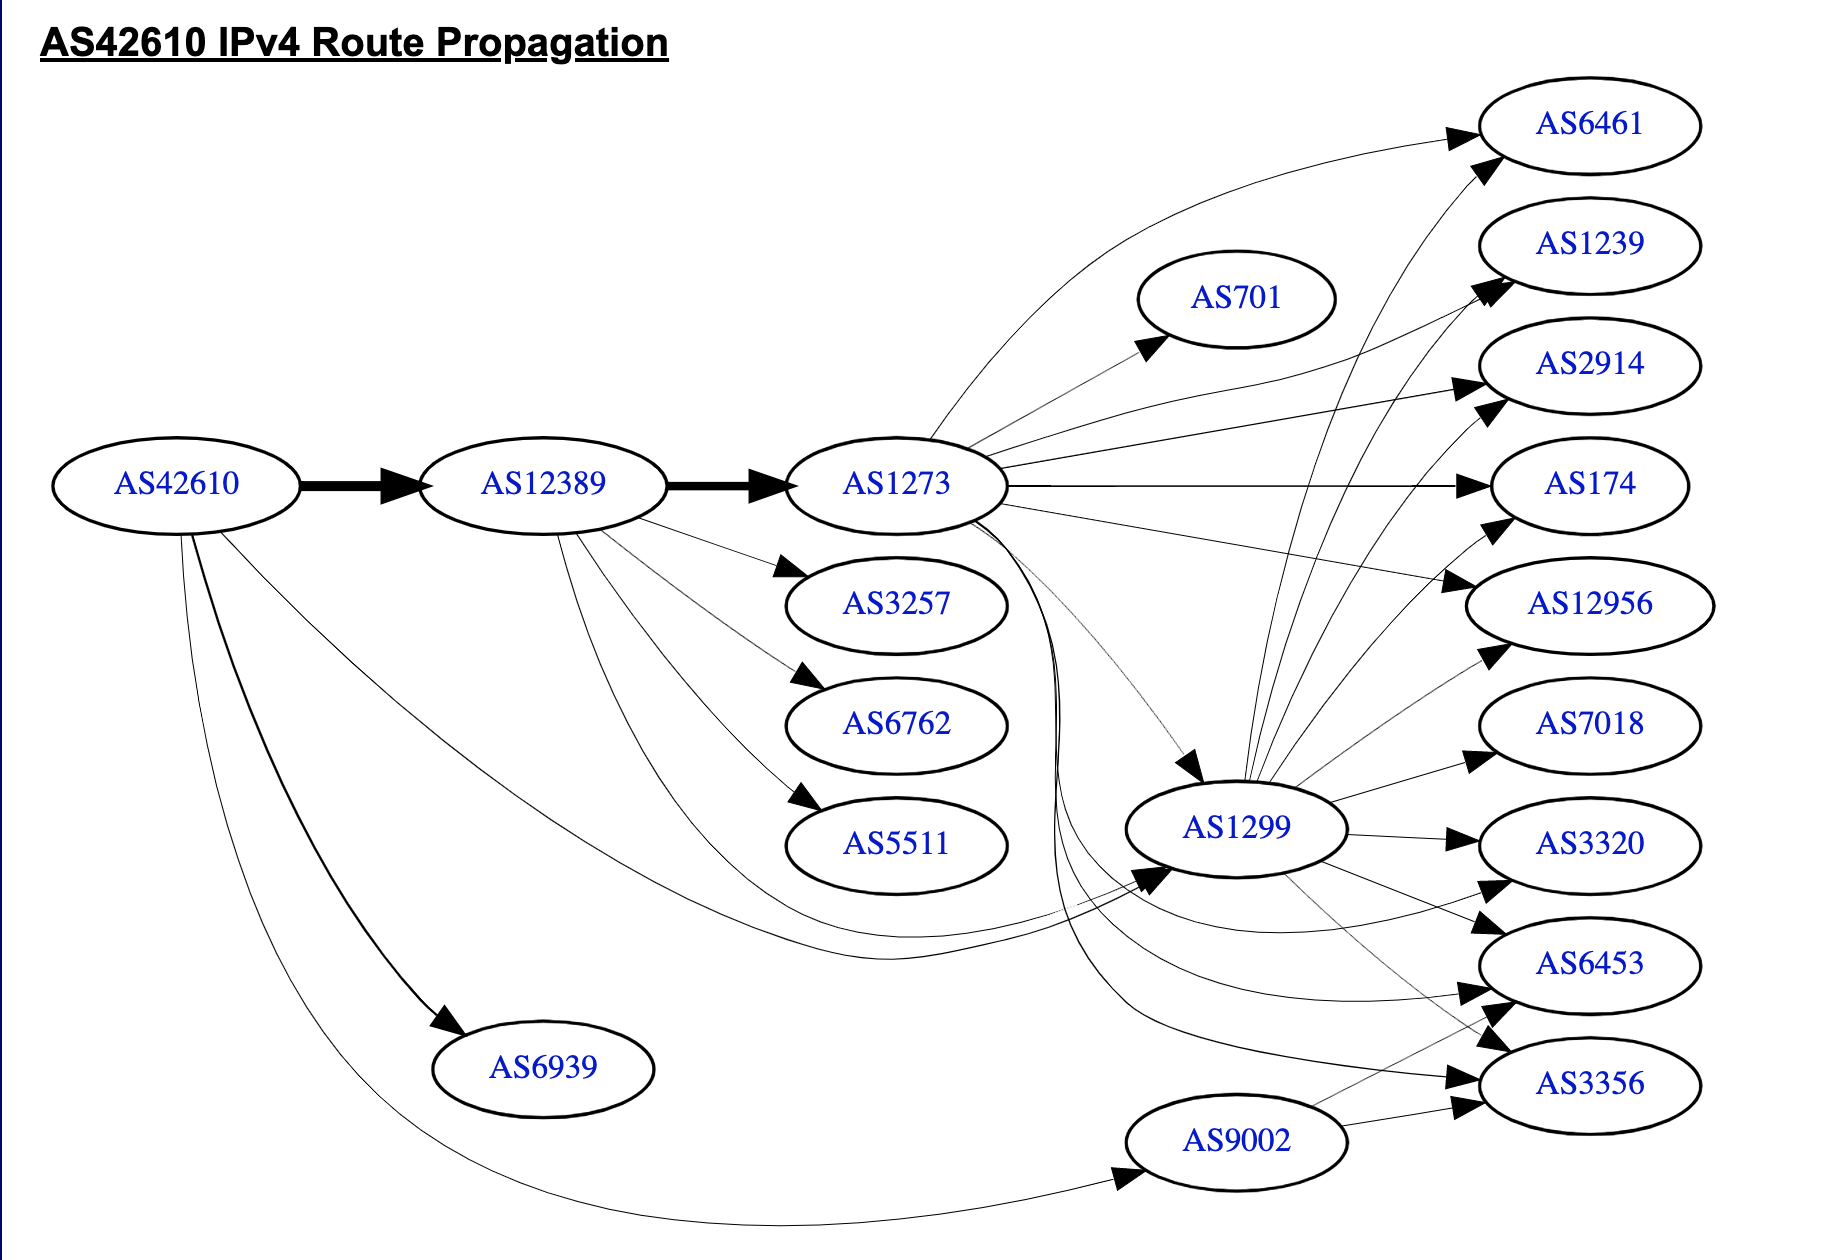 Provider connectivity graphUsing this tool, you can learn how the channels of any provider are arranged, including hosting. See which providers it is connected directly to. To do this, drive the server IP into bgp.he.net search and look at the graph of its autonomous system. You can also understand how one data center or hosting provider is related to another.Most traffic exchange points provide a special tool called looking glass, which allows you to ping and traceroute from a specific router on the exchange point.For example, looking glass from MGTSSo, choosing a server, we can see in advance how it will look from different points of traffic exchange. And if our potential customers are located in a certain geographical area, we can find the optimal location for the server.
Choose the nearest server
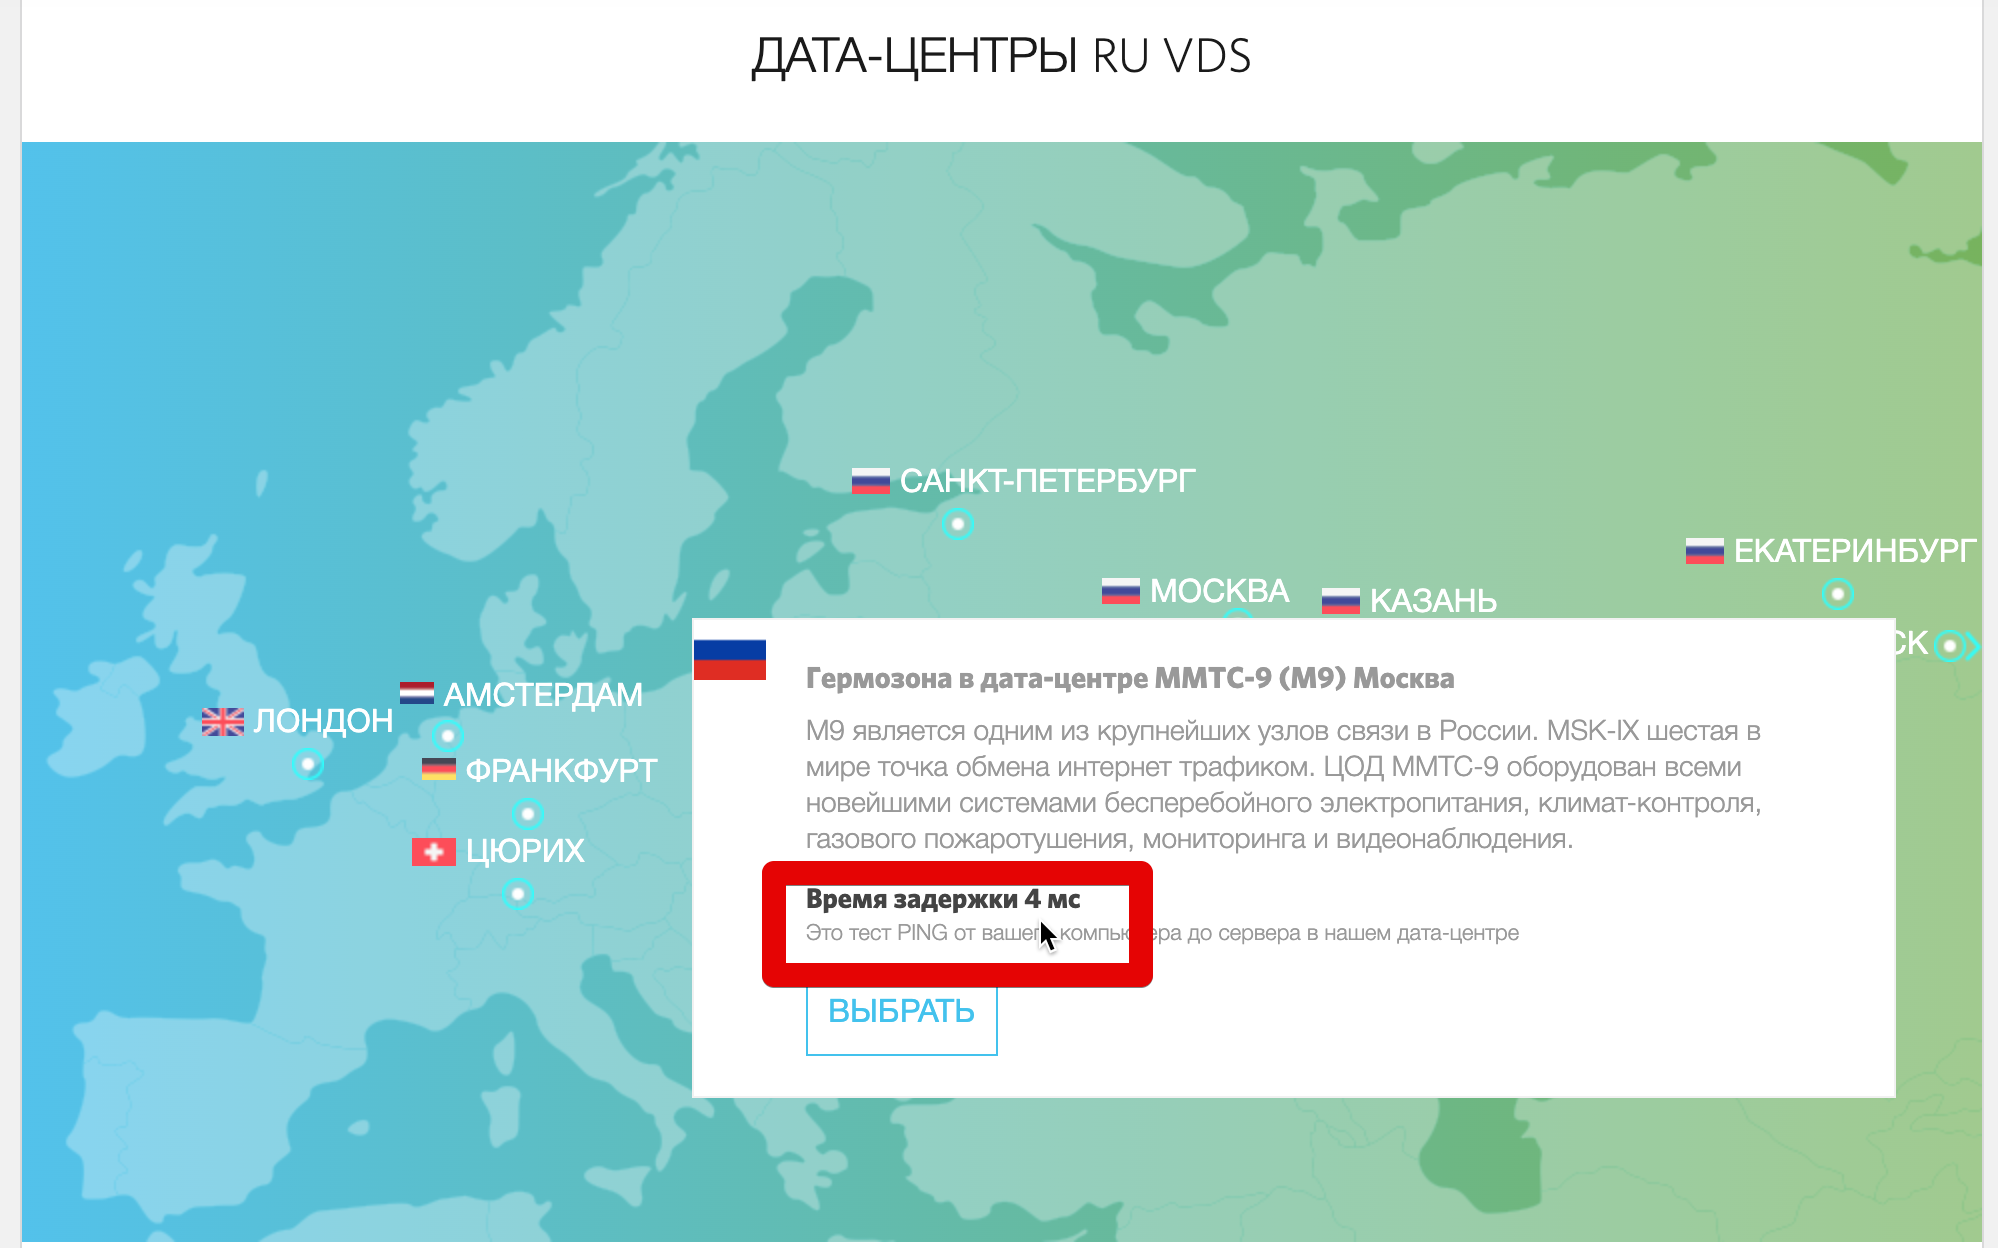
We decided to simplify the process of finding the optimal server for our customers and made a page with an automatic test of the nearest locations: RUVDS data centers .When you enter the page, the script measures the delays from your browser to each server and displays them on an interactive map. When you click on a data center, information with test results is displayed. The button leads to the delay test page to all our data centers. To see the test results, click on the data center point on the map