1. Introduction
Recently, the task arose to periodically check whether all events in the mobile application are working correctly, whether they are transmitted to AppMetrica.I will omit the details of integration, meaning that it is already in the MP.I found two options for verification:If one or two events can be viewed on the web interface, then when there are dozens and hundreds of them, you can’t do without an API.Just in case, I’ll explain that you can of course make your back, and everything will work quickly and reliably, but this is expensive in terms of development and support in the future, so in this article I will try to describe how you can build such a system with minimal effort and with minimal coding .2. Setting up Environments
We need fields with variable data that will be used in our GET request. For the current task, we need the following fields:FirstData
LastData
OperationSystem
event
MinUsers
Params
Here's what Postman looks like: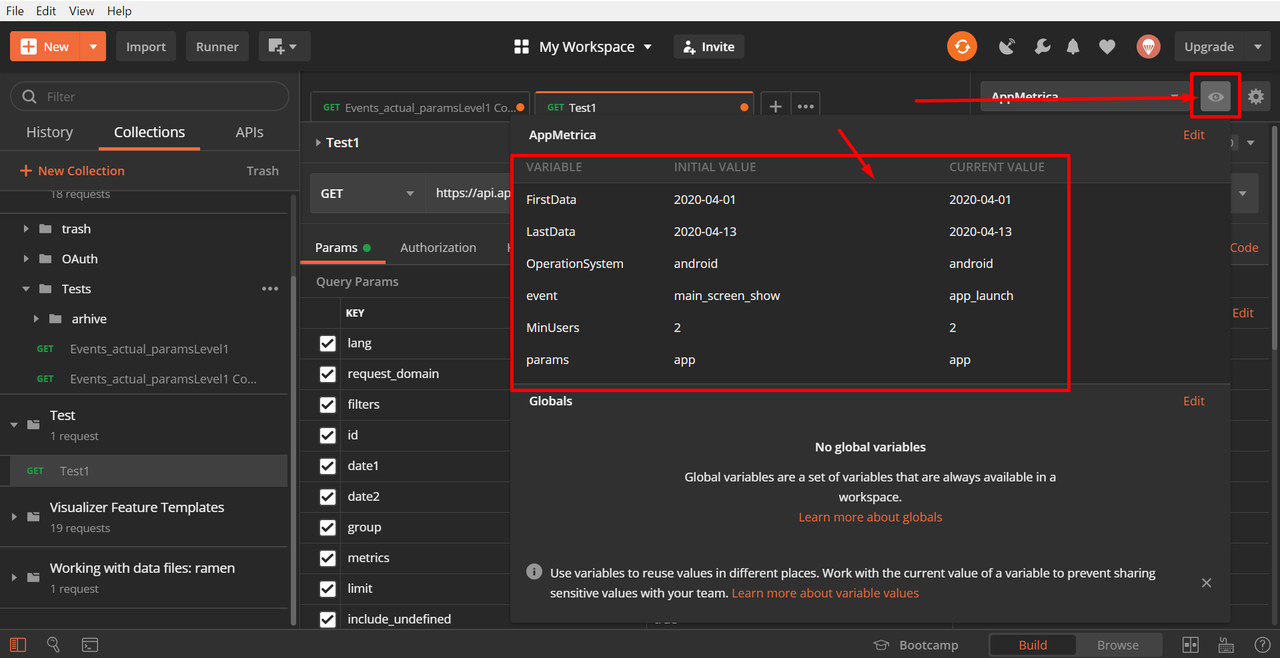
3. Setting up Collections
Now create a Collection with a GET request and test. 3.1. Getting links from AppMetrica3.1.1. We configure the filter by the date of the event. Usually I choose yesterday, because The daily request metric will be fully compiled and available the next day.
 3.1.2. Set up the Events filter:
 3.1.3. Total, we got: Thenumber of users who opened the mobile application, and at the same time activated the event wired into it called app_launch with the app parameter.If the event did not work (in the mobile application that day), then there would be zero users.3.1.4. Export the link for use through the API:
 3.2. Paste the resulting link into Postman into the created Collections.3.3. Params SectionThe necessary fields for the GET request have already been transferred to it. Now we will make them variable so that the data in the request can change.Find the name of the event and change it to a formula to bind it to our Environments.We take the name of the formula from the field name in the Environments section:
 We also act with all the fields of the Params section:
FirstData
LastData
OperationSystem
Event
params
example: 3.4. Headers section.In this section, we log in to AppMetrica so that the server skips our requests.For now, we just need to fill out
- field name: Authorization
- field value: OAuth ***** (you need to get the token of your application)
3.5. You can try to make the first request.A body with statistics should come: Compare it with the web interface. Does it match? So we are on the right track!3.6. Pre-request Script Section3.6.1. In this section, we will attach data in environments to a file with data in CSV format.
console.log("event = " + data.event)
 3.7. Tests sectionIt contains the holy of holies of the entire event, namely the test case code.Below is the code for the current task with comments:
pm.test(" ", function () {
    pm.response.to.have.status(200); //  ,
});

const jsonData = pm.response.json();  //,    .
pm.test('   data - ' //
+ pm.iterationData.get("event")+  // ,      CSV   -
'.' //     .
+pm.iterationData.get("params"), //   ,      CSV   -
() => {
    pm.expect(jsonData.totals[0] >= 1) //
    .to.be.true; // ,    PASS  FAIL
});
3.8. Check:Run the query, see the test results: The fact that the names of events and parameters are not visible is not a bug, the CSV file is not yet connected. More on that later, the main thing is that everything works. Instead of linking to a file, you can simply add text or a link to the environment. There are no boundaries for creativity.
4. Configure Runner
Now we have to take the first step to ensure that it is an auto test, namely connect a data file to it.4.1. Adding an event list file for testsWe will create a simple CSV data file.The first line will be the name of the field for environmentNext, there will be lines with the value of the environment field. 4.2. Runner Run
 Select the folder with the collection.4.2.1. Select the desired request.4.2.2. Select the desired Environment.4.2.3. We see the number of cases corresponding to the downloaded file.4.2.4. We introduce a delay between cases so as not to load the server. I entered 100ms just in case.4.2.5. We load the CSV file with a list of events and parameters.4.2.6. We look, whether the Postman file is correctly recognized.4.3. Click RUN, enjoy the result. The soldier is sleeping, tests are running!
5. Export report
There is already a matter of taste. You can work with the report in JSON. So far, I copied everything from VSON to Excel and got an understanding of where the traffic is and where not: Materials used:PostmanAppMetrica