In modern x86 Intel processors, the pipeline can be divided into 2 parts: Front End and Back End.Front End is responsible for loading code from memory and decoding it in micro-operations.Back End is responsible for performing micro-operations from Front End. Since these microoperations can be performed by the kernel out of order, the Back End also ensures that the result of these microoperations strictly corresponds to the order in which they go in the code.In most cases, inefficient use of Front End'a does not have a noticeable effect on performance. Peak bandwidth on most Intel processors is 4 micro operations per cycle, therefore, for example, for a Memory / L3-bound code, the CPU will not be able to completely utilize it.Pro relatively new Ice Lake, Ice Lake 4 5 . , , .
However, in some cases, the difference in performance can be quite significant. Under the cut is an analysis of the impact of the microoperation cache on performance.The content of the article
- Environment
- Overview of Front End'a Intel processors
- Peak Bandwidth Analysis µop cache -> IDQ
- Example
Environment
For all measurements in this article will be used i7-8550U Kaby Lake, HT enabled / Ubuntu 18.04/Linux Kernel 5.3.0-45-generic. In this case, such an environment can be significant, because each CPU model has its own performance event. In particular, for microarchitectures older than Sandy Bridge, some of the events used in the future simply do not make sense.Overview of Front End'a Intel processors
The high-level assembly line organization is publicly available information and is published in Intel official documentation on software optimization . A more detailed description of some of the features that are omitted from the official documentation can be found in other reputable sources, such as Agner Fog or Travis Downs . So, for example, the assembly pipeline scheme for Skylake in the Intel documentation looks like this: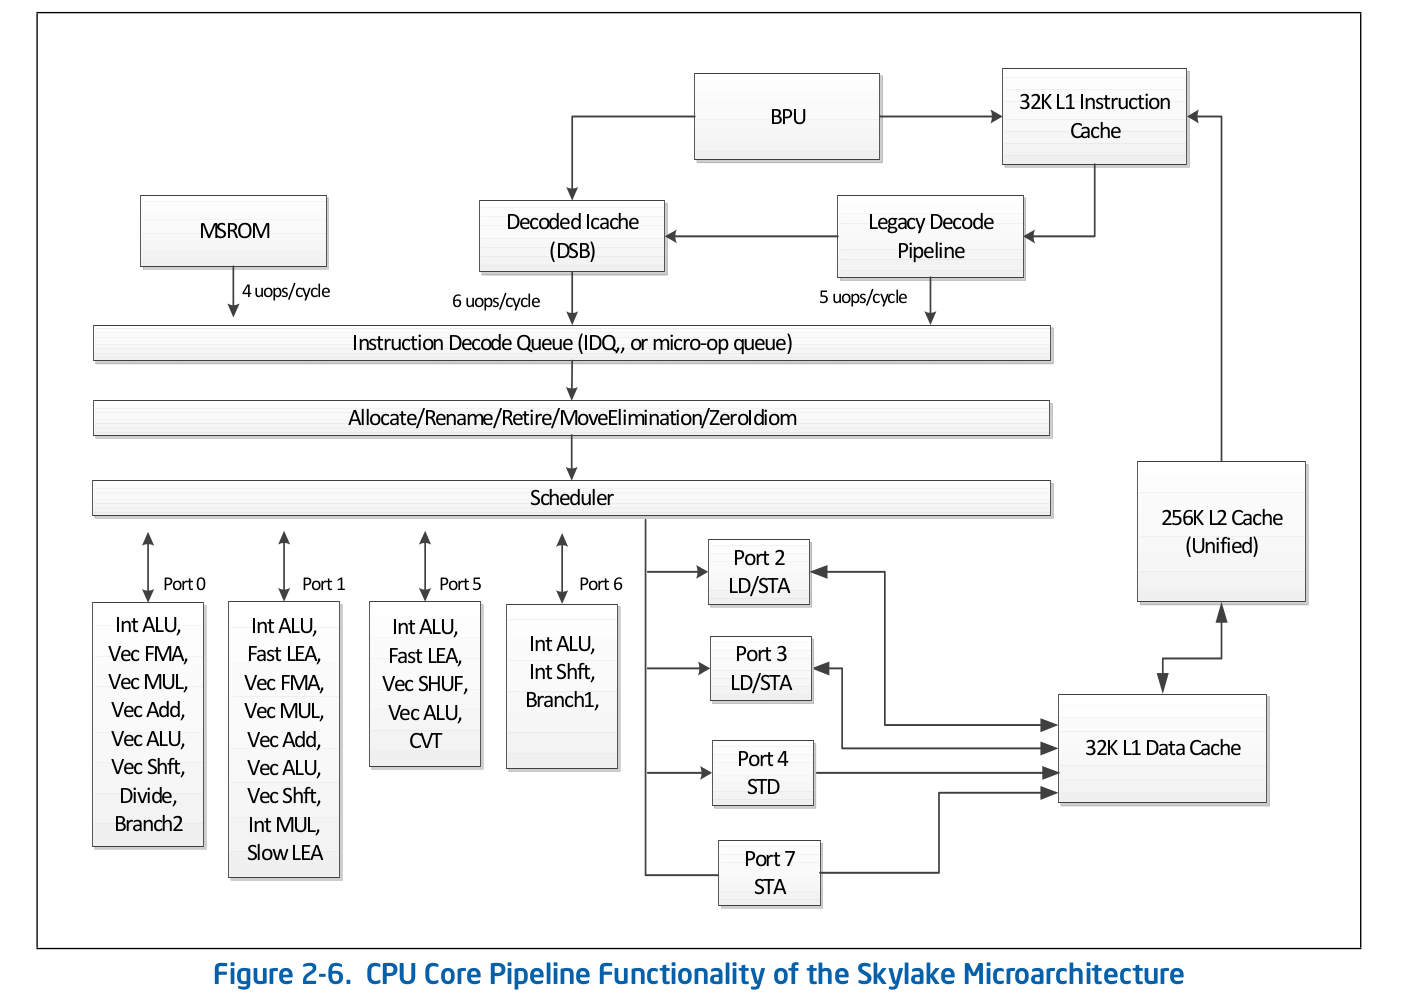 Let's take a closer look at the upper part of this scheme - Front End.
 Legacy Decode Pipeline is responsible for decoding the code in micro-operations. It consists of the following components:
- Instruction Fetch Unit - IFU
- First Level Instructions Cache - L1i
- Instruction Log Translation Address Cache - ITLB
- Instructor Prefector
- Pre-decoder instructions
- Queue of pre-decoded instructions
- Micro-operation pre-decoded instruction decoders
Consider each of the parts of the Legacy Decode Pipeline individually.Instruction Fetch Unit.He is responsible for loading the code, pre-coding (determining the length of the instruction and properties such as “whether the instruction is a branch”) and delivering pre-decoded instructions to the queue.First Level Instructions Cache - L1iTo download the code, the IFU uses L1i, the first-level instruction cache, and L2 / LLC, the second-level cache and the top-level offcore cache, common to code and data. Download is performed in pieces of 16 bytes, also aligned to 16 bytes. When the next 16-byte piece of code is loaded in order, a call is made to L1i and, if the corresponding line is not found, then a search is performed in L2 and, in case of failure, in LLC and memory. Before Skylake LLC, the cache was inclusive - each line in L1 (i / d) and L2 should be contained in the LLC. Thus, LLC “knew” about all the lines in all cores and, in the case of an LLC slip, it was known whether the caches in other cores contained the required line in the Modified state, which means that this line could be loaded from another core. Skylake LLC became a non-inclusive L2-victim cache, but the L2 size was increased 4 times. I don’t knowwhether L2 is inclusive with respect to L1i. L2not inclusive with respect to L1d.Translation of logical addresses of instructions - ITLBBefore downloading data from the cache, you must search for the corresponding line. For n-way associative caches , each line can be in ndifferent places in the cache itself. To determine the possible positions in the cache, an index is used (usually a few lower bits of the address). To determine if the line matches the address we need, a tag is used (the rest of the address). Which addresses to use: physical or logical - depends on cache implementation. Using physical addresses requires address translation. For address translation, a TLB buffer is used, which caches the results of page walks, thereby reducing the delay in receiving a physical address from a logical address on subsequent calls. For instructions, there is its own Instruction TLB buffer, located separately from the Data TLB. The CPU core also has a second-level TLB common to code and data - STLB. Whether STLB is inclusive is unknown to me (rumored to be not an inclusive victim cache relative to D / I TLB). Using Software Prefetch Instructionsprefetcht1you can pull up the line with the code in L2, however, the corresponding TLB record will be pulled up only in DTLB. If STLB is not inclusive, then when you look for this line with the code in the caches, you will get ITLB miss -> STLB miss -> page walk (in fact, it’s not so simple, because the kernel can initiate a speculative page walk before it happens TLB miss). Intel documentation also discourages the use of SW prefetches for code, Intel Software Optimization Manual / 2.5.5.4:The software-controlled prefetch is intended for prefetching data, but not for prefetching code.
However, Travis D. mentioned that such a prefetch can be very effective (and most likely it is), but so far this is not obvious to me and in order to be convinced of this I will need to separately examine this issue.Instructor PrefectorData loading into the cache (L1d / i, L2, etc) occurs when accessing an un-cached memory location. However, if this happened only under such conditions, then as a result we would get an inefficient use of cache bandwidth. For example, on Sandy Bridge for L1d - 2 read operations, 1 write 16 bytes per cycle; for L1i - 1 read operation of 16 bytes, write throughput is not specified in the documentation, Agner Fog was also not found. To solve this problem, there are Hardware prefetchers who can determine the pattern of access to memory and pull the necessary lines into the cache before the code actually addresses them. Intel documentation defines 4 prefetchers: 2 for L1d, 2 for L2:- L1 DCU - Prefix serial cache lines. Read Only Forward
- L1 IP — (. 0x5555555545a0, 0x5555555545b0, 0x5555555545c0, ...), , ,
- L2 Spatial — L2 -, 128-. LLC
- L2 Streamer — . L1 DCU «». LLC
Intel documentation does not describe the principle of the L1i prefector. All that is known is that the Branch Prediction Unit (BPU) is involved in this process, Intel Software Optimization Manual / 2.6.2: Agner Fog also does not see any details.Code prefetching in L2 / LLC is explicitly defined only for Streamer. Optimization Manual / 2.5.5.4 Data Prefectching:
Streamer : This prefetcher monitors read requests from the L1 cache for ascending and descending sequences of addresses. Monitored read requests include L1 DCache requests initiated by load and store operations and by the hardware prefetchers, and L1 ICache requests for code fetch.
For the Spatial prefetcher, this is clearly not spelled out:Spatial Prefetcher: This prefetcher strives to complete every cache line fetched to the L2 cache with the pair line that completes it to a 128-byte aligned chunk.
But this can be verified. Each of these prefetchers can be turned off using MSR 0x1A4, as described in the Model-Specific Registers manual .About MSR 0x1A4MSR L2 Spatial L1i. . , LLC. L2 Streamer 2.5 .
Linux msr , msr . $ sudo wrmsr -p 1 0x1a4 1 L2 Streamer 1.
Pre-decoder instructionsAfter the next 16-byte code is loaded, they fall into the pre-decoder instructions. Its task is to determine the length of the instruction, decode the prefixes and mark whether the corresponding instruction is a branch (most likely there are still many different properties, but the documentation about them is silent). Intel Software Optimization Manual / 2.6.2.2:The predecode unit accepts the sixteen bytes from the instruction cache or prefetch buffers and carries out the following tasks:
- Determine the length of the instructions
- Decode all prefixes associated with instructions
- Mark various properties of instructions for the decoders (for example, “is branch.”)
A line of pre-decoded instructions.From the IFU, instructions are added to the pre-encoded instruction queue. This queue has appeared since Nehalem, in accordance with Intel documentation, its size is 18 instructions. Agner Fog also mentions that this queue holds no more than 64 bytes.Also in Core2, this queue was used as a loop cache. If all microoperations from the cycle are in the queue, then in some cases the cost of loading and pre-coding could be avoided. The Loop Stream Detector (LSD) can deliver instructions that are already in the queue until the BPU signals that the cycle has ended. Agner Fog has a number of interesting notes regarding LSD on Core2:- Consists of 4 lines of 16 bytes
- Peak throughput up to 32 bytes of code per cycle
Starting with Sandy Bridge, this loop cache has moved from the pre-decoded instruction queue back to IDQ.Decoders of pre-decoded instructions in microoperationFrom the queue of pre-decoded instructions, the code is sent to decoding in microoperation. Decoders are responsible for decoding - there are 4 in total. According to Intel documentation, one of the decoders can decode instructions consisting of 4 micro-operations or less. The rest decodes instructions consisting of one microoperation (micro / macro fused), Intel Software Optimization Manual / 2.5.2.1:There are four decoding units that decode instruction into micro-ops. The first can decode all IA-32 and Intel 64 instructions up to four micro-ops in size. The remaining three decoding units handle single-micro-op instructions. All four decoding units support the common cases of single micro-op flows including micro-fusion and macro-fusion.
Instructions decoded in a large number of micro-operations (e.g. rep movsb used in the implementation of memcpy in libc on certain sizes of copied memory) come from Microcode Sequencer (MS ROM). The peak bandwidth of the sequencer is 4 micro-operations per cycle.As you can see in the assembly line diagram, the Legacy Decode Pipeline can decode up to 5 micro operations per cycle on Skylake. On Broadwell and older, the Legacy Decode Pipeline's peak throughput was 4 micro-operations per cycle.Microoperation cacheAfter the instructions are decoded in microoperations, from the Legacy Decode Pipeline they fall into the special microoperation queue - Instruction Decode Queue (IDQ), as well as the so-called microoperation cache (Decoded ICache, µop cache). The microoperation cache was originally introduced in Sandy Bridge and is used to avoid fetching and decoding instructions in microoperations, thereby increasing the throughput for delivering microoperations in IDQ - up to 6 per cycle. After getting into IDQ, microoperations go to the Back End for execution with a peak throughput of 4 microoperations per cycle.According to Intel documentation, the microoperation cache consists of 32 sets, each set contains 8 lines, each line can cache up to 6 micro operations (micro / macro fused), allowing a total cache of up to 32 * 8 * 6 = 1536 micro operations . Microoperation caching occurs with a granularity of 32 bytes, i.e. micro-operations that follow instructions from different 32-byte regions cannot fall into one line. However, up to 3 different cache lines can correspond to one 32-byte region. Thus, up to 18 microoperations in µop cache can correspond to each 32-byte region.Intel Software Optimization Manual / 2.5.5.2The Decoded ICache consists of 32 sets. Each set contains eight Ways. Each Way can hold up to six micro-ops. The Decoded ICache can ideally hold up to 1536 micro-ops. The following are some of the rules how the Decoded ICache is filled with micro-ops:
- ll micro-ops in a Way represent instructions which are statically contiguous in the code and have their EIPs within the same aligned 32-byte region.
- Up to three Ways may be dedicated to the same 32-byte aligned chunk, allowing a total of 18 micro-ops to be cached per 32-byte region of the original IA program.
- A multi micro-op instruction cannot be split across Ways.
- Up to two branches are allowed per Way.
- An instruction which turns on the MSROM consumes an entire Way.
- A non-conditional branch is the last micro-op in a Way.
- Micro-fused micro-ops (load+op and stores) are kept as one micro-op.
- A pair of macro-fused instructions is kept as one micro-op.
- Instructions with 64-bit immediate require two slots to hold the immediate.
Agner Fog also mentions that only single line micro-operations can be downloaded per cycle (not explicitly stated in Intel documentation, although it can be easily checked manually).µop cache --> IDQ
In some cases, it is very convenient to use nop1-byte lengths to study the behavior of Front End . At the same time, we can be sure that we are investigating the Front End, and not the Resource Stall on the Back End, for any reason. The fact is that nop, as well as other instructions, they are decoded in the Legacy Decode Pipeline, mixed in µop cache and sent to IDQ. Further nop, as well as other instructions, takes back end. The significant difference is that of the resources on the Back End it nopuses only the Reorder Buffer and does not require a slot in the Reservation Station (aka Scheduler). Thus, immediately after entering Reorder Buffer, it is nopready for retirement, which will be performed in accordance with the order in the program code.To test throughput, declare a functionvoid test_decoded_icache(size_t iteration_count);
with implementation on nasm:align 32
test_decoded_icache:
;nop', 0 23
dec rdi
ja test_decoded_icache
ret
jaIt was not chosen by chance. jaand decuse different flags - jareads from CFand ZF, decnot recording in the CF, so Macro Fusion does not apply. This is done purely for the convenience of counting microoperations in a cycle - each instruction corresponds to one microoperation.For measurements, we need the following perf events:1. uops_issued.any- Used to count the micro-operations that Renamer takes from IDQ.The Intel System Programming Guide documents this event as the number of micro-operations that Renamer puts into the Reservation Station:Counts the number of uops that the Resource Allocation Table (RAT) issues to the Reservation Station (RS).
This description does not completely correlate with the values that can be obtained from experiments. In particular, they nopfall into this counter, although it is only a fact that they are not needed at all at the Reservation Station.2. uops_retired.retire_slots- the total number of retired microoperations taking into account micro / macro-fusion3. uops_retired.stall_cycles- the number of ticks for which there was not a single retired microoperation4. resource_stalls.any- the number of ticks of idle conveyor due to the inaccessibility of any of the resources Back EndIn the Intel Software Optimization Manual / B .4.1 there is a content diagram that characterizes the events described above: 5.
5. idq.all_dsb_cycles_4_uops- the number of clock cycles for which 4 (or more) instructions were delivered from µop cache.The fact that this metric takes into account the delivery of more than 4 microoperations per cycle is not described in the Intel documentation, but it agrees very well with the experiments.6. idq.all_dsb_cycles_any_uops- the number of measures for which at least one micro-operation was delivered.7. idq.dsb_cycles- The total number of measures at which delivery was from µop cache8. idq_uops_not_delivered.cycles_le_N_uop_deliv.core- The number of measures for which Renamer took one Nor less microoperations and there was no downtime on the Back End side , N- 1, 2, 3.We take for research iteration_count = 1 << 31. We begin the analysis of what is happening in the CPU by examining the number of micro-operations and, first, by measuring the average retirement bandwidth, i.e. uops_retired.retire_slots/uops_retired.total_cycle: What immediately catches your eye is the subsidence of the retirement throughput at a cycle size of 7 micro-operations. In order to understand what’s the matter, let’s take a look at how the average delivery speed from µop cache - changes
 idq.all_dsb_cycles_any_uops / idq.dsb_cycles: and how are the total number of measures and measures for which µop cache delivered to IDQ related:
 Thus, we can see that with a cycle of 6 micro operations we get an effective µop cache bandwidth utilization - 6 micro operations per cycle. Due to the fact that Renamer cannot pick up as much as the µop cache delivers, some of the µop cache cycles do not deliver anything, which is clearly visible in the previous graph.With a cycle of 7 microoperations, we get a sharp drop in the throughput of the µop cache - 3.5 microoperations per cycle. At the same time, as can be seen from the previous graph, µop cache is constantly in operation. Thus, with a cycle of 7 microoperations, we get inefficient utilization of the bandwidth µop cache. The fact is that, as noted earlier, µop cache per cycle can deliver microoperations from only one line. In case of microoperations 7 - the first 6 fall in one line, and the remaining 7th - in another. In this way, we get 7 micro-operations per 2 cycles, or 3.5 micro-operations per cycle.Now let's look at how Renamer takes micro-operations from IDQ. For this we need
 idq_uops_not_delivered.coreand idq_uops_not_delivered.cycles_le_N_uop_deliv.core: You may notice that with 7 microoperations, only 3 microoperations at a time take half the Renamer cycles. From here we get retirement throughput of an average of 3.5 micro-operations per cycle.Another interesting point related to this example can be seen if we consider the effective throughput of retirement. Those. not considering
 uops_retired.stall_cycles: It can be noted that with 7 microoperations, every 7 measures retirement of 4 microoperations is performed, and every 8th measure is idle with no retired microoperations (retirement stall). After conducting a series of experiments, it was possible to find that such behavior was always observed during 7 microoperations, regardless of their layout 1-6, 6-1, 2-5, 5-2, 3-4, 4-3. I don’t know why this is exactly the case, and not, for example, retirement of 3 microoperations is performed in one clock cycle, and 4 in the next. Agner Fog mentioned that branch transitions can only use part of the retirement station slots. Maybe this restriction is the reason for this retirement behavior.
Example
In order to understand whether this all has an effect in practice, consider the following slightly more practical example than with nops:Two arrays are given unsigned. It is necessary to accumulate the sum of arithmetic means for each index and write it to the third array.An example implementation might look like this:
static unsigned arr1[] = { ... };

static unsigned arr2[] = { ... };

static void arithmetic_mean(unsigned *arr1, unsigned *arr2, unsigned *out, size_t sz){
    unsigned sum = 0;
    size_t idx = 0;
    while(idx < sz){
        sum += (arr1[idx] + arr2[idx]) >> 1;
        out[idx] = sum;
        idx++;
    }
    __asm__ __volatile__("" ::: "memory");
}

int main(void){
    unsigned out[sizeof arr1 / sizeof(unsigned)];
    for(size_t i = 0; i < 4096 * 4096; i++){
        arithmetic_mean(arr1, arr2, out, sizeof arr1 / sizeof(unsigned));
    }
}
Compile with gcc flags-Werror
-Wextra
-Wall
-pedantic
-Wno-stack-protector
-g3
-O3
-Wno-unused-result
-Wno-unused-parameter
It is quite obvious that the function arithmetic_meanwill not be present in the code and will be inserted directly into main:(gdb) disas main
Dump of assembler code for function main:
#...
0x00000000000005dc <+60>: nop DWORD PTR [rax+0x0]
0x00000000000005e0 <+64>: mov edx,DWORD PTR [rdi+rax*4]
0x00000000000005e3 <+67>: add edx,DWORD PTR [r8+rax*4]
0x00000000000005e7 <+71>: shr edx,1
0x00000000000005e9 <+73>: add ecx,edx
0x00000000000005eb <+75>: mov DWORD PTR [rsi+rax*4],ecx
0x00000000000005ee <+78>: add rax,0x1
0x00000000000005f2 <+82>: cmp rax,0x80
0x00000000000005f8 <+88>: jne 0x5e0 <main+64>
0x00000000000005fa <+90>: sub r9,0x1
0x00000000000005fe <+94>: jne 0x5d8 <main+56>
#...
Note that the compiler aligned the loop code to 32 bytes ( nop DWORD PTR [rax+0x0]), which is exactly what we need. Having made sure that there is no resource_stalls.anyBack End (all measurements are performed taking into account the heated L1d cache), we can begin to consider the counters associated with the delivery to IDQ: Performance counter stats for './test_decoded_icache':
2 273 343 251 idq.all_dsb_cycles_4_uops (15,94%)
4 458 322 025 idq.all_dsb_cycles_any_uops (16,26%)
15 473 065 238 idq.dsb_uops (16,59%)
4 358 690 532 idq.dsb_cycles (16,91%)
2 528 373 243 idq_uops_not_delivered.core (16,93%)
73 728 040 idq_uops_not_delivered.cycles_0_uops_deliv.core (16,93%)
107 262 304 idq_uops_not_delivered.cycles_le_1_uop_deliv.core (16,93%)
108 454 043 idq_uops_not_delivered.cycles_le_2_uop_deliv.core (16,65%)
2 248 557 762 idq_uops_not_delivered.cycles_le_3_uop_deliv.core (16,32%)
2 385 493 805 idq_uops_not_delivered.cycles_fe_was_ok (16,00%)
15 147 004 678 uops_retired.retire_slots
4 724 790 623 uops_retired.total_cycles
1,228684264 seconds time elapsed
Note that retirement badwidth in this case = 15147004678/4724790623 = 3.20585733562, and also that only 3 microoperations take half the clocks of Renamer.Now add the manual loop promotion to the implementation:static void arithmetic_mean(unsigned *arr1, unsigned *arr2, unsigned *out, size_t sz){
unsigned sum = 0;
size_t idx = 0;
if(sz & 2){
sum += (arr1[idx] + arr2[idx]) >> 1;
out[idx] = sum;
idx++;
}
while(idx < sz){
sum += (arr1[idx] + arr2[idx]) >> 1;
out[idx] = sum;
idx++;
sum += (arr1[idx] + arr2[idx]) >> 1;
out[idx] = sum;
idx++;
}
__asm__ __volatile__("" ::: "memory");
}
The resulting perf counters look like:Performance counter stats for './test_decoded_icache':
2 152 818 549 idq.all_dsb_cycles_4_uops (14,79%)
3 207 203 856 idq.all_dsb_cycles_any_uops (15,25%)
12 855 932 240 idq.dsb_uops (15,70%)
3 184 814 613 idq.dsb_cycles (16,15%)
24 946 367 idq_uops_not_delivered.core (16,24%)
3 011 119 idq_uops_not_delivered.cycles_0_uops_deliv.core (16,24%)
5 239 222 idq_uops_not_delivered.cycles_le_1_uop_deliv.core (16,24%)
7 373 563 idq_uops_not_delivered.cycles_le_2_uop_deliv.core (16,24%)
7 837 764 idq_uops_not_delivered.cycles_le_3_uop_deliv.core (16,24%)
3 418 529 799 idq_uops_not_delivered.cycles_fe_was_ok (16,24%)
3 444 833 440 uops_retired.total_cycles (18,18%)
13 037 919 196 uops_retired.retire_slots (18,17%)
0,871040207 seconds time elapsed
In this case, we have retirement bandwidth = 13037919196/3444833440 = 3.78477491672, as well as efficient utilization of Renamer bandwidth.Thus, we not only got rid of one branching and one increment operation in a loop, but also increased retirement bandwidth using efficient utilization of the throughput of the microoperation cache, which gave a total 28% increase in performance.Note that only a reduction in one branch and increment operation gives an average performance increase of 9%.Small remark
On the CPU that was used to perform these experiments, LSD is turned off. It seems that LSD could handle such a situation. For CPUs with LSD enabled, such cases will need to be investigated separately.