I recently talked about how to use the standard recipes to increase the performance of SQL “read” queries from a PostgreSQL database. Today we will talk about how you can make recording in the database more efficient without using any “twists” in the config — simply by correctly organizing the data flows.#1. Partitioning
An article about how and why it is worth organizing applied partitioning “in theory” has already been, here we will focus on the practice of applying some approaches within the framework of our monitoring service for hundreds of PostgreSQL servers ."Cases of bygone days ..."
Initially, like any MVP, our project started under a fairly small load - monitoring was carried out only for the ten most critical servers, all tables were relatively compact ... But time passed, there were more and more monitored hosts, and once again tried to do something with one of the tables with a size of 1.5TB , we realized that although it’s possible to live on like this, it’s very inconvenient.Times were almost epic, different PostgreSQL 9.x versions were relevant, so all the partitions had to be done “manually” - through table inheritance and dynamic routing triggersEXECUTE .The resulting solution turned out to be universal enough to be able to translate it to all tables:PG10:
But partitioning through inheritance has not historically been well suited to work with an active write stream or a large number of child sections. For example, you may recall that the algorithm for selecting the desired section was of quadratic complexity , that it works with 100+ sections, you yourself understand how ...In PG10, this situation was greatly optimized by implementing support for native partitioning . Therefore, we immediately tried to apply it immediately after the migration of the storage, but ...As it turned out after digging up the manual, the natively partitioned table in this version:- does not support description of indexes
- does not support triggers on it
- cannot be itself any "descendant"
- do not support
INSERT ... ON CONFLICT - can't spawn section automatically
Painfully getting a rake on our forehead, we realized that we could not do without modifying the application, and postponed further research for six months.PG10: Second Chance
So, we began to solve the problems in turn:- Since the triggers
ON CONFLICTturned out to be necessary in some places, we made an intermediate proxy table to work them out . - We got rid of “routing” in triggers - that is, from
EXECUTE. - They took out a separate template table with all indices so that they were not even present on the proxy table.
Finally, after all this, the main table has already been natively partitioned. Creating a new section has remained on the conscience of the application.“Sawing” dictionaries
As in any analytical system, we also had “facts” and “cuts” (dictionaries). In our case, in this capacity were, for example, the body of the “template” of the same type of slow queries or the text of the query itself.Our "facts" were partitioned by days for a long time, so we calmly deleted the obsolete sections, and they did not bother us (logs!). But with the dictionaries the troubleturned out ... Not to say that there were a lot of them, but about 100TB of “facts” turned out to be a dictionary for 2.5TB . You can’t conveniently delete anything from such a table, you won’t squeeze it in adequate time, and writing to it gradually became slower.It seems like a dictionary ... in it each entry should be presented exactly once ... and that's right, but! .. Nobody bothers us to have a separate dictionary for every day ! Yes, this brings a certain redundancy, but it allows you to:- write / read faster due to smaller section size
- consume less memory by working with more compact indexes
- store less data due to the ability to quickly remove obsolete
As a result of the whole complex of measures , the CPU load decreased by ~ 30%, and by disk - by ~ 50% :At the same time, we continued to write exactly the same thing to the database, just with less load.# 2 Database evolution and refactoring
So, we settled on the fact that for each day we have our own section with data. Actually, this CHECK (dt = '2018-10-12'::date)is the partitioning key and the condition for the record to fall into a particular section.Since all the reports in our service are built according to a specific date, then the indices from the “non-partitioned times” were all types of them (Server, Date , Plan Template) , (Server, Date , Plan Node) , ( Date , Error Class, Server) , ...But now each section has its own instances of each such index ... And within each section the date is constant ... It turns out that now we are in each such indexwe trivially enter a constant as one of the fields, which makes both its volume and the search time on it more, but does not bring any result. Themselves left a rake, oops ...The direction of optimization is obvious - just remove the date field from all indexes on partitioned tables. With our volumes, the gain is about 1TB / week !And now let's notice that this terabyte still had to be written down somehow. That is, we also have to load less disk now ! In this picture you can clearly see the effect obtained from the cleaning, which we devoted a week to: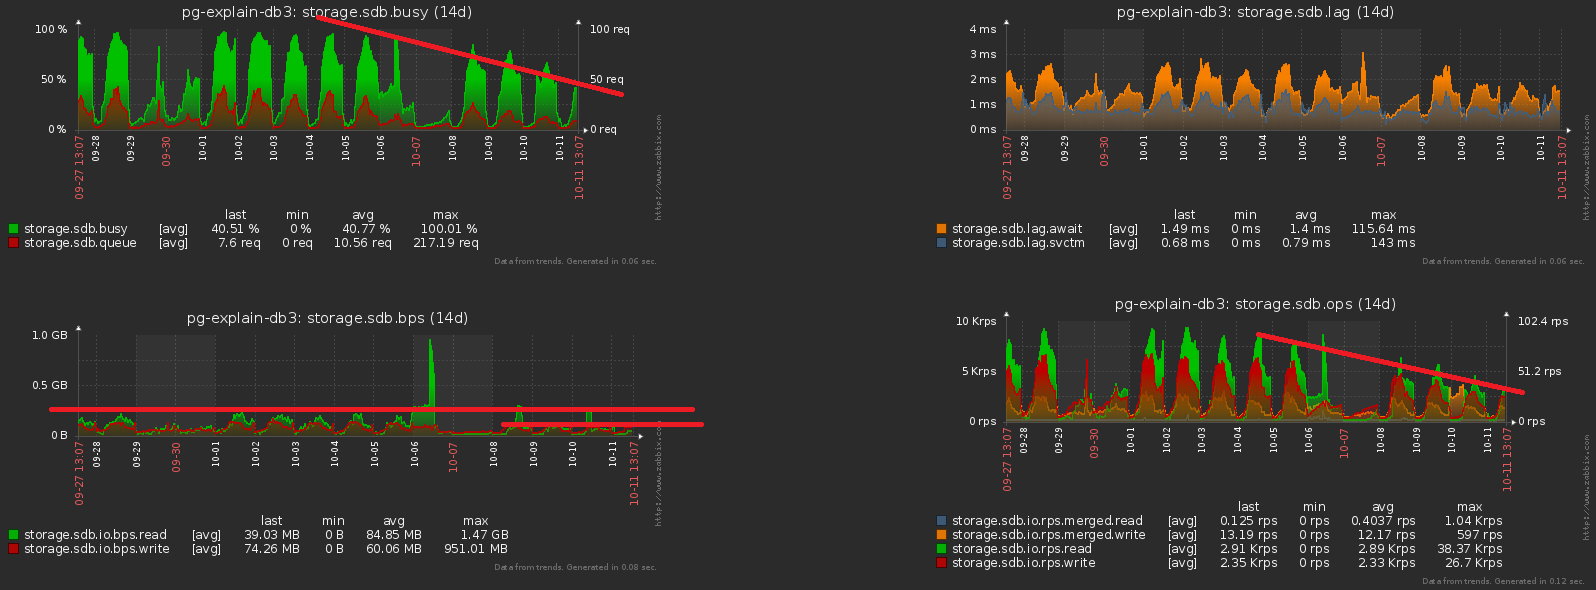
# 3 “Smear” the peak load
One of the big troubles of loaded systems is the excessive synchronization of some operations that do not require it. Sometimes “because they didn’t notice”, sometimes “it was easier”, but sooner or later you have to get rid of it.We bring the previous picture closer - and we see that the disk "shakes" with a load with a double amplitude between adjacent samples, which obviously should not be "statistically" with so many operations: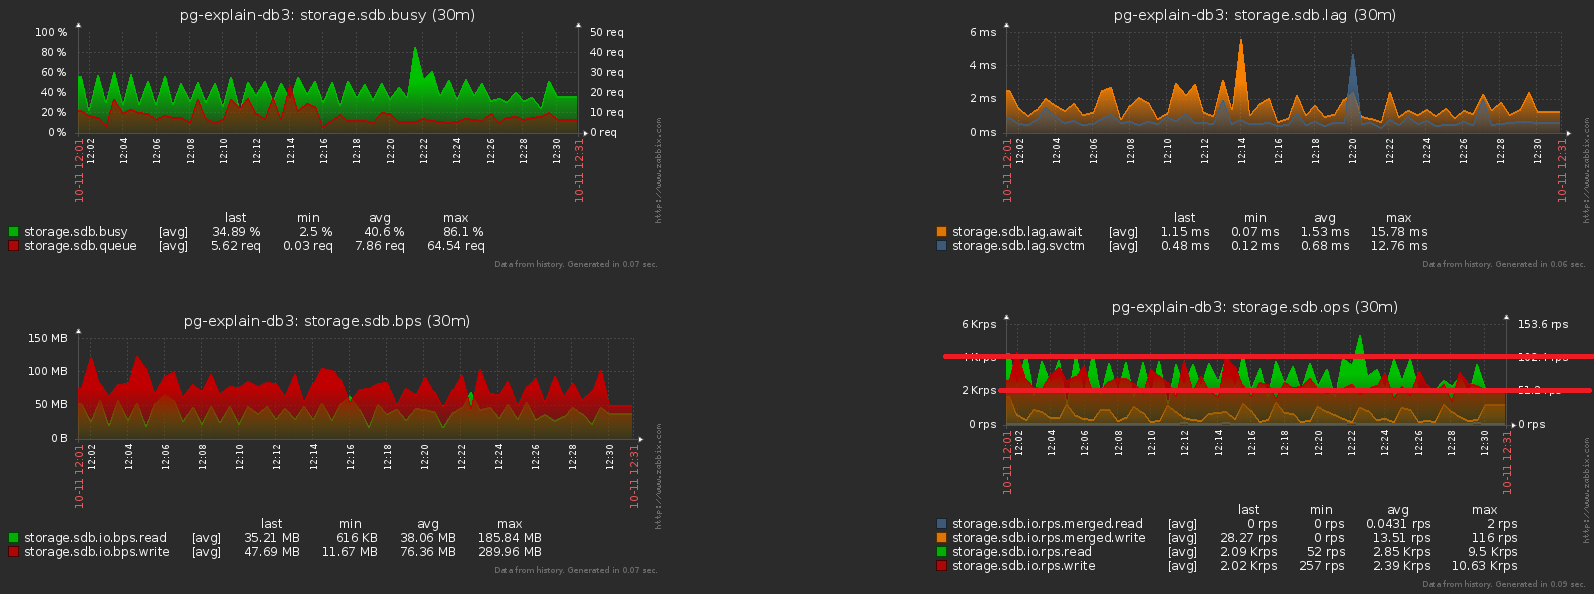 To achieve this is quite simple. Almost 1000 servers have already been started for monitoring , each is processed by a separate logical stream, and each stream dumps the accumulated information for sending to the database with a certain frequency, something like this:
setInterval(sendToDB, interval)
The problem here lies precisely in the fact that all threads start at about the same time , so the sending times for them almost always coincide “to the point”. Oops No. 2 ...Fortunately, this is corrected quite easily by adding a "random" time span :setInterval(sendToDB, interval * (1 + 0.1 * (Math.random() - 0.5)))
#4. Caching, that need can be
The third traditional highload problem is the lack of cache where it could be.For example, we made it possible to analyze the breakdown of the nodes of the plan (all of these Seq Scan on users), but immediately forgot that they, in the main, are the same, have forgotten.No, of course, nothing is written to the database repeatedly, this cuts off the trigger with INSERT ... ON CONFLICT DO NOTHING. But the data doesn’t reach the base anyway, and you have to do extra reading to check the conflict . Oops No. 3 ...The difference in the number of records sent to the database before / after enabling caching is obvious: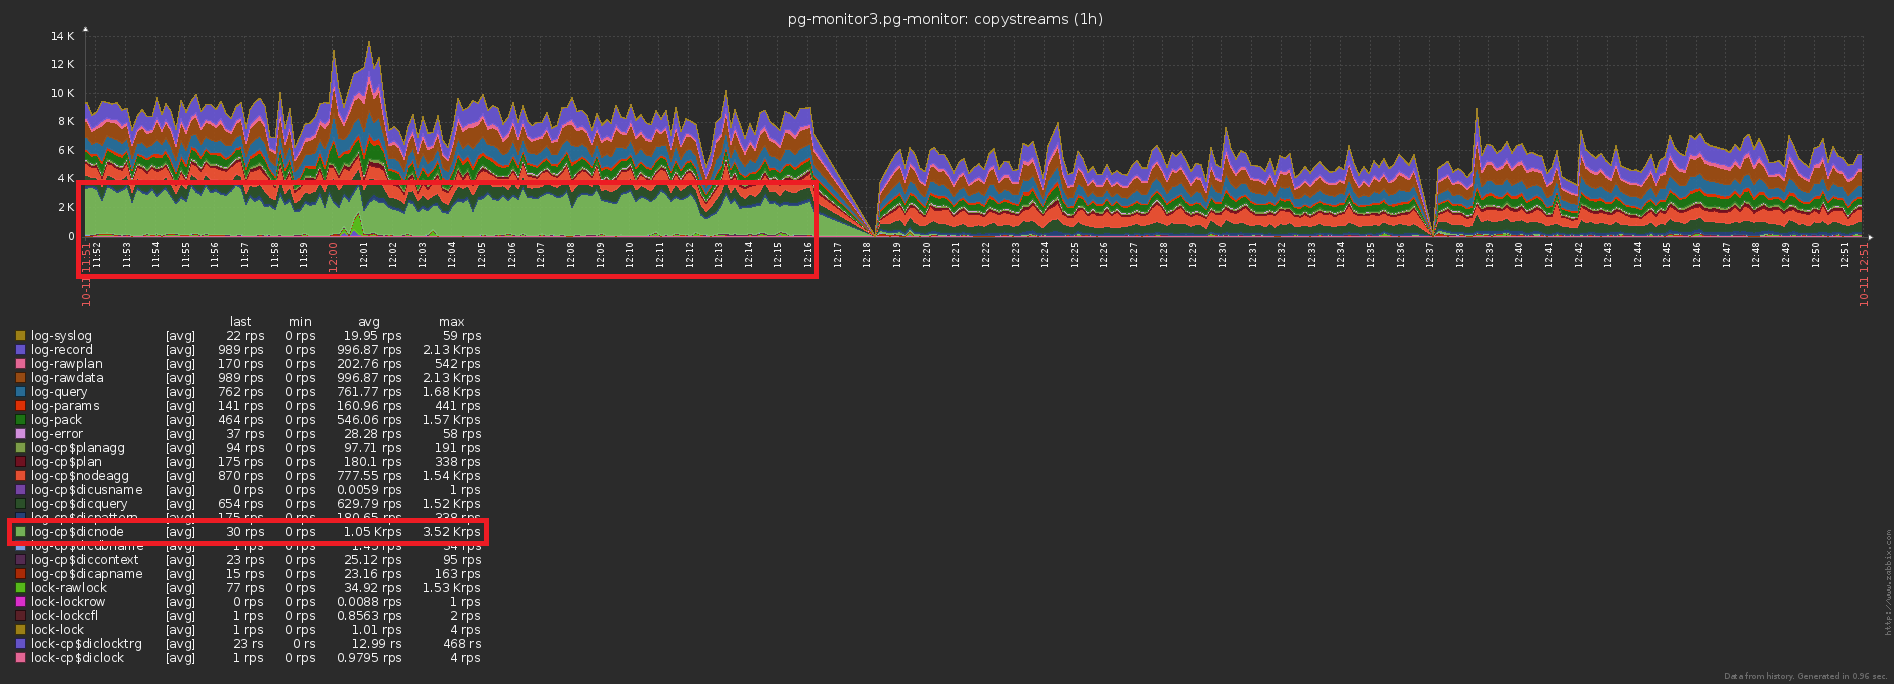 And this is a concomitant drop in the storage load:
Total
Terabyte-per-day only sounds scary. If you do everything right, then this is only 2 ^ 40 bytes / 86400 seconds = ~ 12.5MB / s , which even desktop IDE screws held. :)But seriously, even with a tenfold “skew” of the load during the day, you can easily meet the possibilities of modern SSDs.