After all the calculations presented in this and this publication, we can delve into the statistical analysis and consider the least squares method. The statsmodels library is used for this purpose, which allows users to examine data, evaluate statistical models, and perform statistical tests. This article and this article were taken as a basis . The description of the function used in English is available at the following link .First, a little theory:About linear regression
Linear regression is used as a predictive model when a linear relationship is assumed between the dependent variable (the variable we are trying to predict) and the independent variable (the variable and / or variables used for the prediction).In the simplest case, when considering, one variable is used based on which we are trying to predict another. The formula in this case is as follows:Y = C + M * X- Y = dependent variable (result / forecast / estimate)
- C = Constant (Y-Intercept)
- M = Slope of the regression line (slope or gradient of the estimated line; it is the amount by which Y increases on average if we increase X by one unit)
- X = independent variable (predictor used in forecast Y)
In fact, there may also be a relationship between the dependent variable and several independent variables. For these types of models (assuming linearity), we can use multiple linear regression of the following form:Y = C + M1X1 + M2X2 + ...Beta Ratio
A lot has already been written about this coefficient, for example, on this pageBriefly, if you do not go into details, you can characterize it as follows:Stocks with a beta coefficient:- zero indicates no correlation between stock and index
- the unit indicates that the stock has the same volatility as the index
- more than one - indicates a higher profitability (and therefore risks) of the stock than the index
- less than one - less volatile stock than index
In other words, if the stock increases by 14%, while the market grew by only 10%, then the beta coefficient of the stock will be 1.4. Typically, markets with a higher beta can offer better conditions for reward (and therefore risk).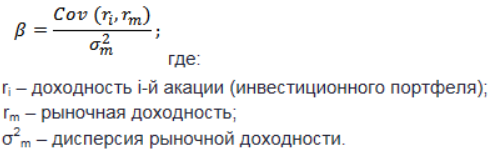
Practice
The following Python code includes an example of linear regression, where the input variable is the yield on the Moscow Exchange Index, and the estimated variable is the yield on Aeroflot stocks.In order to avoid the need to remember how to download data and bring the data to the form necessary for the calculation, the code is given from the moment the data is downloaded and until the results are obtained. Here is the complete syntax for doing linear regression in Python using statsmodels:
import pandas as pd
import yfinance as yf
import numpy as np
import matplotlib.pyplot as plt
import statsmodels.api as sm
ticker = ['AFLT.ME','IMOEX.ME']
stock = yf.download(ticker)
all_adj_close = stock[['Adj Close']]
all_returns = np.log(all_adj_close / all_adj_close.shift(1))
aflt_returns = all_returns['Adj Close'][['AFLT.ME']].fillna(0)
moex_returns = all_returns['Adj Close'][['IMOEX.ME']].fillna(0)
return_data = pd.concat([aflt_returns, moex_returns], axis=1)[1:]
return_data.columns = ['AFLT.ME', 'IMOEX.ME']
X = sm.add_constant(return_data['IMOEX.ME'])
y = return_data['AFLT.ME']
model_moex = sm.OLS(y,X).fit()
print(model_moex.summary())
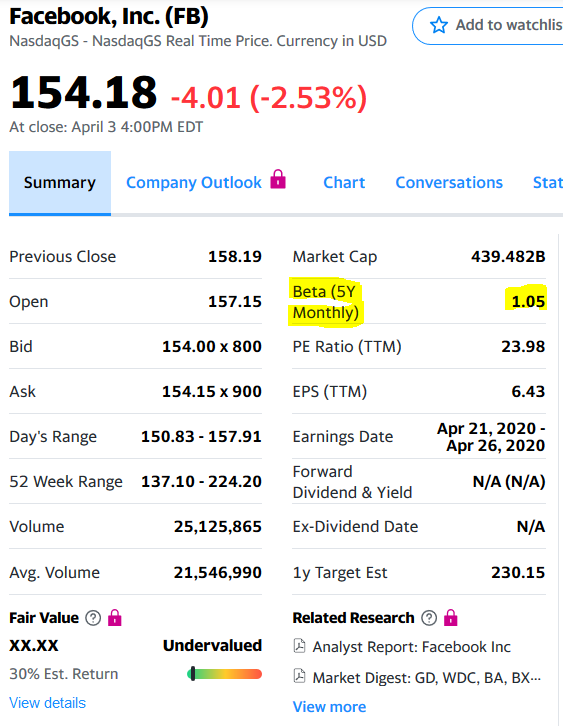
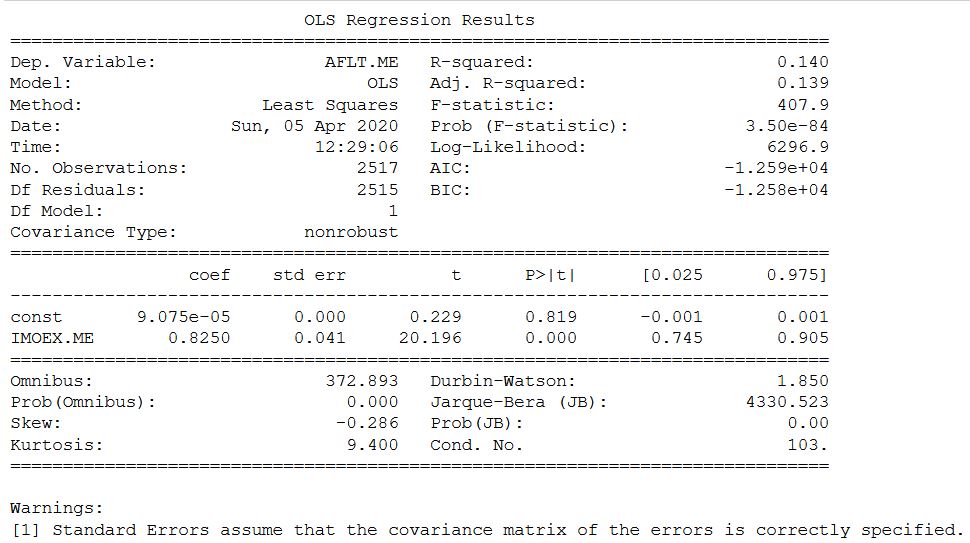 On the yahoo website and Mosbirzhi beta coefficient differs slightly upwards. But I must honestly admit that the calculation for some other shares from the Russian stock exchange showed more significant differences, but within the interval.
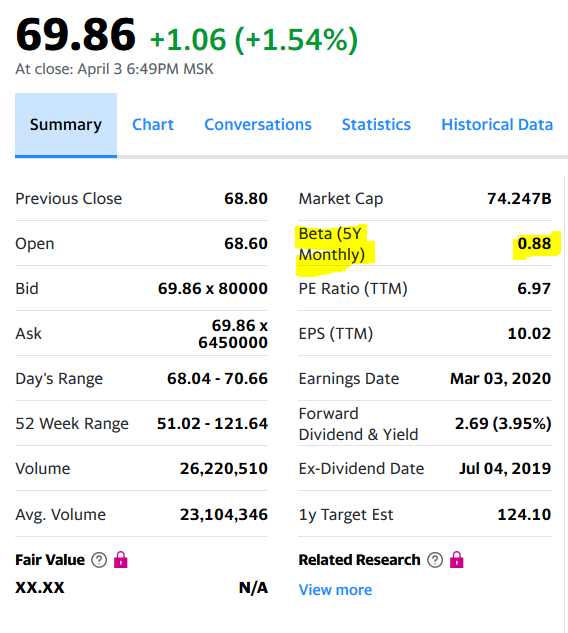 The same analysis for the FB stock and the SP500 index. Here, the calculation, as in the original, is carried out through the monthly yield.
sp_500 = yf.download('^GSPC')
fb = yf.download('FB')
fb = fb.resample('BM').apply(lambda x: x[-1])
sp_500 = sp_500.resample('BM').apply(lambda x: x[-1])
monthly_prices = pd.concat([fb['Close'], sp_500['Close']], axis=1)
monthly_prices.columns = ['FB', '^GSPC']
monthly_returns = monthly_prices.pct_change(1)
clean_monthly_returns = monthly_returns.dropna(axis=0)
X = clean_monthly_returns['^GSPC']
y = clean_monthly_returns['FB']
X1 = sm.add_constant(X)
model_fb_sp_500 = sm.OLS(y, X1)
results_fb_sp_500 = model_fb_sp_500.fit()
print(results_fb_sp_500.summary())
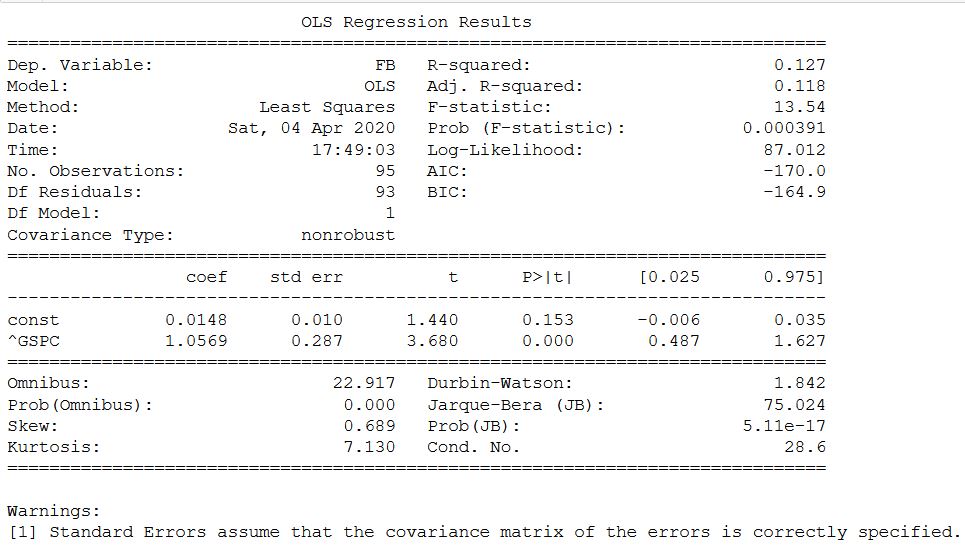
 In this case, everything coincided and confirmed the possibility of using statsmodels to determine the beta coefficient.Well, and as a bonus - if you want to get only beta - you want to leave the coefficient and the rest of the statistics aside, then another code is proposed for calculating it:
from scipy import stats
slope, intercept, r_value, p_value, std_err = stats.linregress(X, y)

print(slope)

1.0568997978702754
True, this does not mean that all other obtained values should be ignored, but knowledge of statistics will be needed to understand them. I will give a small excerpt from the obtained values:- R-squared, which is the coefficient of determination and takes values from 0 to 1. The closer the value of the coefficient to 1, the stronger the dependence;
- Adj. R-squared - adjusted R-squared based on the number of observations and the number of degrees of freedom;
- std err - standard error of coefficient estimation;
- P> | t | - p-value A value of less than 0.05 is considered statistically significant;
- 0.025 and 0.975 are the lower and upper values of the confidence interval.
- etc.
That's all for now. Of course, it is of interest to look for a relationship between different values in order to predict the other through one and get a profit. In one of the foreign sources, the index was predicted through the interest rate and unemployment rate. But if the change in the interest rate in Russia can be taken from the Central Bank's website, then I continue to search for others. Unfortunately, the Rosstat website could not find the relevant ones. This is the final publication in the articles of the general financial analysis.