In the morning, without taking a sip of coffee, you open the mail and see a bug report on what was working fine for itself, it didn’t fail, and it didn’t really bother. There are zero ideas on the move, there are no suspects, there were no big changes in the code either - you need to go into the logs.And you didn’t go there so long ago that you distributed a file with logs up to 100 mb. or up to 500 mb. Heck! Or maybe up to 10 GB (*). And precious evidence lies somewhere among 10,737,418,240 bytes, which needs to be urgently run in order to find out what is going on, even as the coffee is already cooling down.Or maybe an archive with two hundred files (say 5 MB each) of the broken logs went to the report with a trailer and you need to glue them somehow, and then look, dig and think.Is that familiar?In general, all of us, one way or another, are faced with the need to analyze the “life traces” of our creations, and it’s good if the file weighs a couple of MB, because opening a 1 GB log with a notepad and even trying to do a search is a dubious task.Under the cut, I’ll tell you about one tool that does not have limits (**) on the size of the opened files, but it has a very quick search.And I invite you to join the development.And yes, there will be many interesting pictures.So, it would seem a trivial task to open the logs and search, sometimes it can run into a banal file size. You can open a trifle with anything, at least with the same notepad or notepad ++, but on poppies and Linux, so it’s sometimes easier to drop everything into the console with a cat and do a search.Among other things, you can use the mentioned notepad ++, atom, logExpert, sublime, bare vim, bbedit, glogg, etc. I have to say right away that not everyone will open gigabyte 2, and some of the surviving alas will break down in the search. And of all the above, perhaps only atom is truly cross-platform, and I want to have one thing when I have to work on several platforms in parallel. And how many some eat up RAM to process at least a couple of hundred megabytes of logs is a different story.That's actually why we have the chipmunk tool, which was sawn under narrow tasks, but quickly grew into a comprehensive solution for analyzing logs. Chipmunk can do nothing else; its tasks are reduced to a simple one:- open logs without worrying about file size;
- search so that you don’t wait, but see the result immediately;
- remember all your searches and carefully store them on demand;
- help you visually perceive the information;
- behave modestly in relation to RAM;
- to solve other narrower tasks, but always reduced to the analysis of logs.
Well, let's talk about everything in order.Resources
Chipmunk does not load anything into RAM, except for the piece of logs that is visible on the screen (well, a little more buffering, but this is a trifle). Walking around the file, chipmunk reads a piece of the file (corresponding to the position of the scrolling) and only loads it into memory. Thanks to this, the appetites for RAM are quite intelligible and do not fluctuate, and the first "screen" with the contents of the file is shown immediately (although indexing will continue with the background).Convenience and visualization
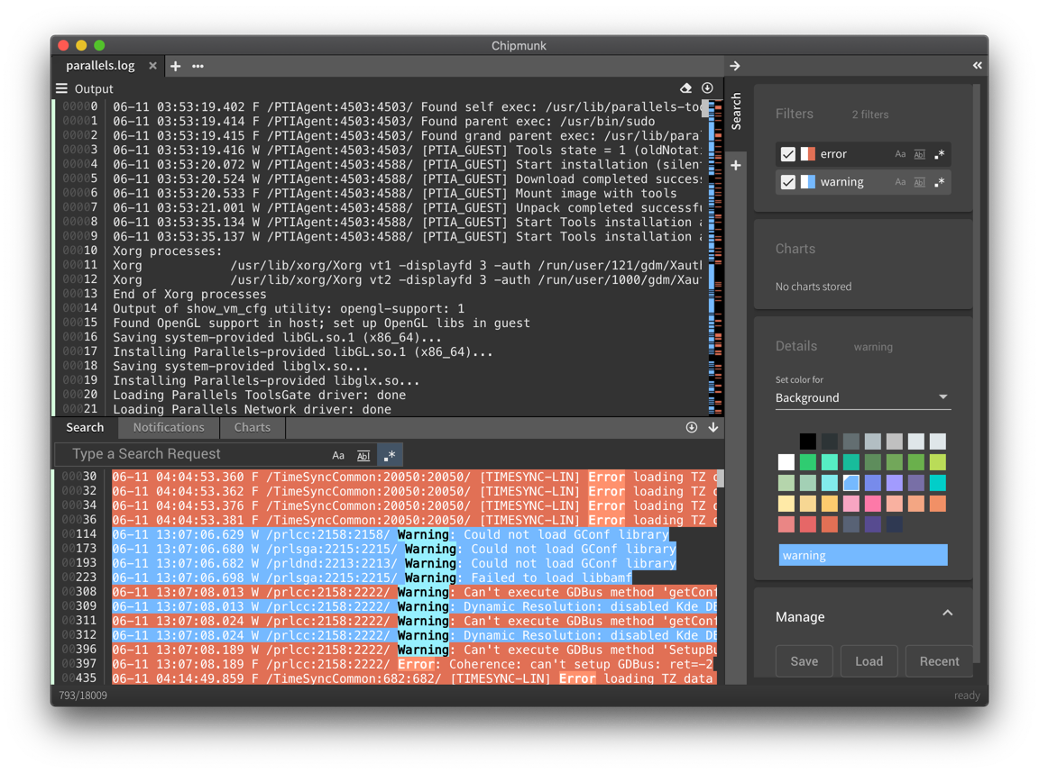 There is a search query manager where you can:
- Assign colors to filters (which facilitates the perception of data)
- save the collection of filters to a file so that you always have a ready-made search pattern on hand.
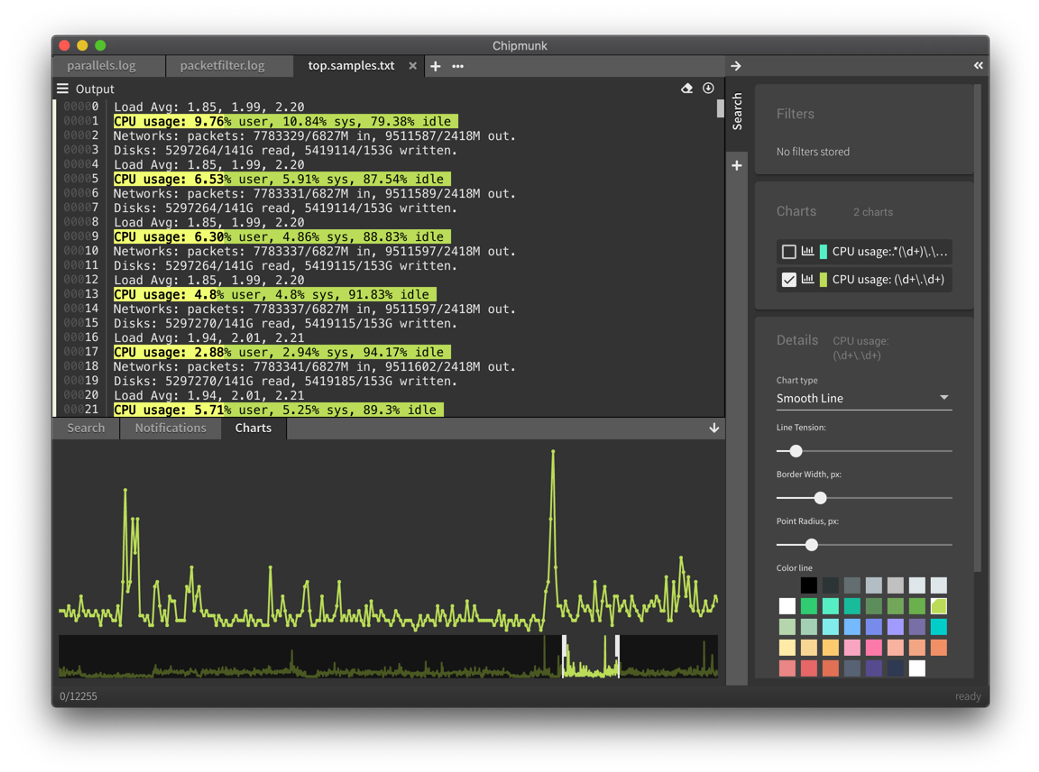
You can, for example, look at the file for the frequency of matches (the higher the column, the more matches in the file fragment).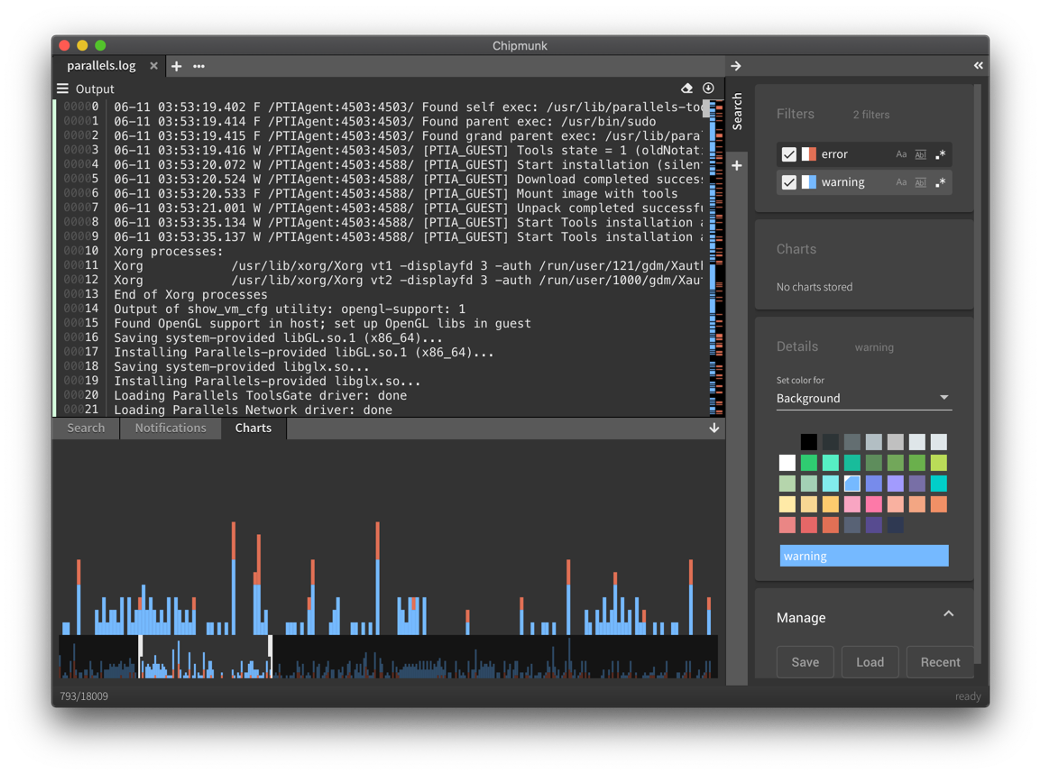 Or you can specify a group in a regular expression and get a beautiful graph (in the example used, the expression CPU usage: \ s + (\ d + \. \ D +) ). And now you see where the CPU consumption was abnormal and which piece of logs should be examined carefully.
 In addition to searching by itself, individual lines of logs can be bookmarked, which will always be presented in the search results window. This is very convenient when I saw something important among a couple of million lines and you do not want to lose sight of it.
File combination
To solve problems associated with several files, chipmunk can blind files into one (for example, by the date of the last change in the file). All that is needed:- throw a group of files into the chipmunk window
- if you need to sort files as you like
- in addition, you can search all files and, for example, exclude those files that do not have matches for the word "error" (well, why should we go where everything is so calm?)
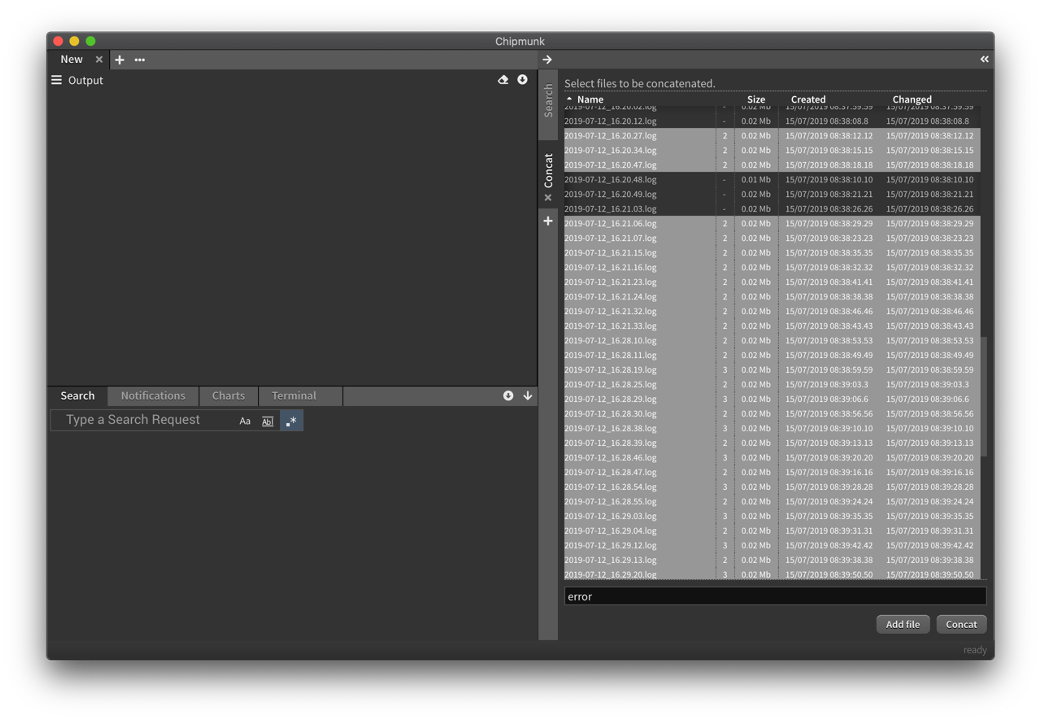 As a result, we get in the window a sequence of all selected files.If you need a more complex mechanism for combining logs (for example, if you have logs from different devices / sources), you can use the merge function, which determines the format of the time stamp for each file and displays the logs in chronological order.
 Pay attention to the color labels to the left of the output - these are file labels. That is, you do not see the output of one file after another (concatenation), but the output sorted by time from all files (merging).
Special features
If you have ever encountered DLT, then you know what a pain it is to use DLTViewer. The good news is that chipmunk is an alternative for opening and analyzing DLT files. In addition, it also supports DLT streaming.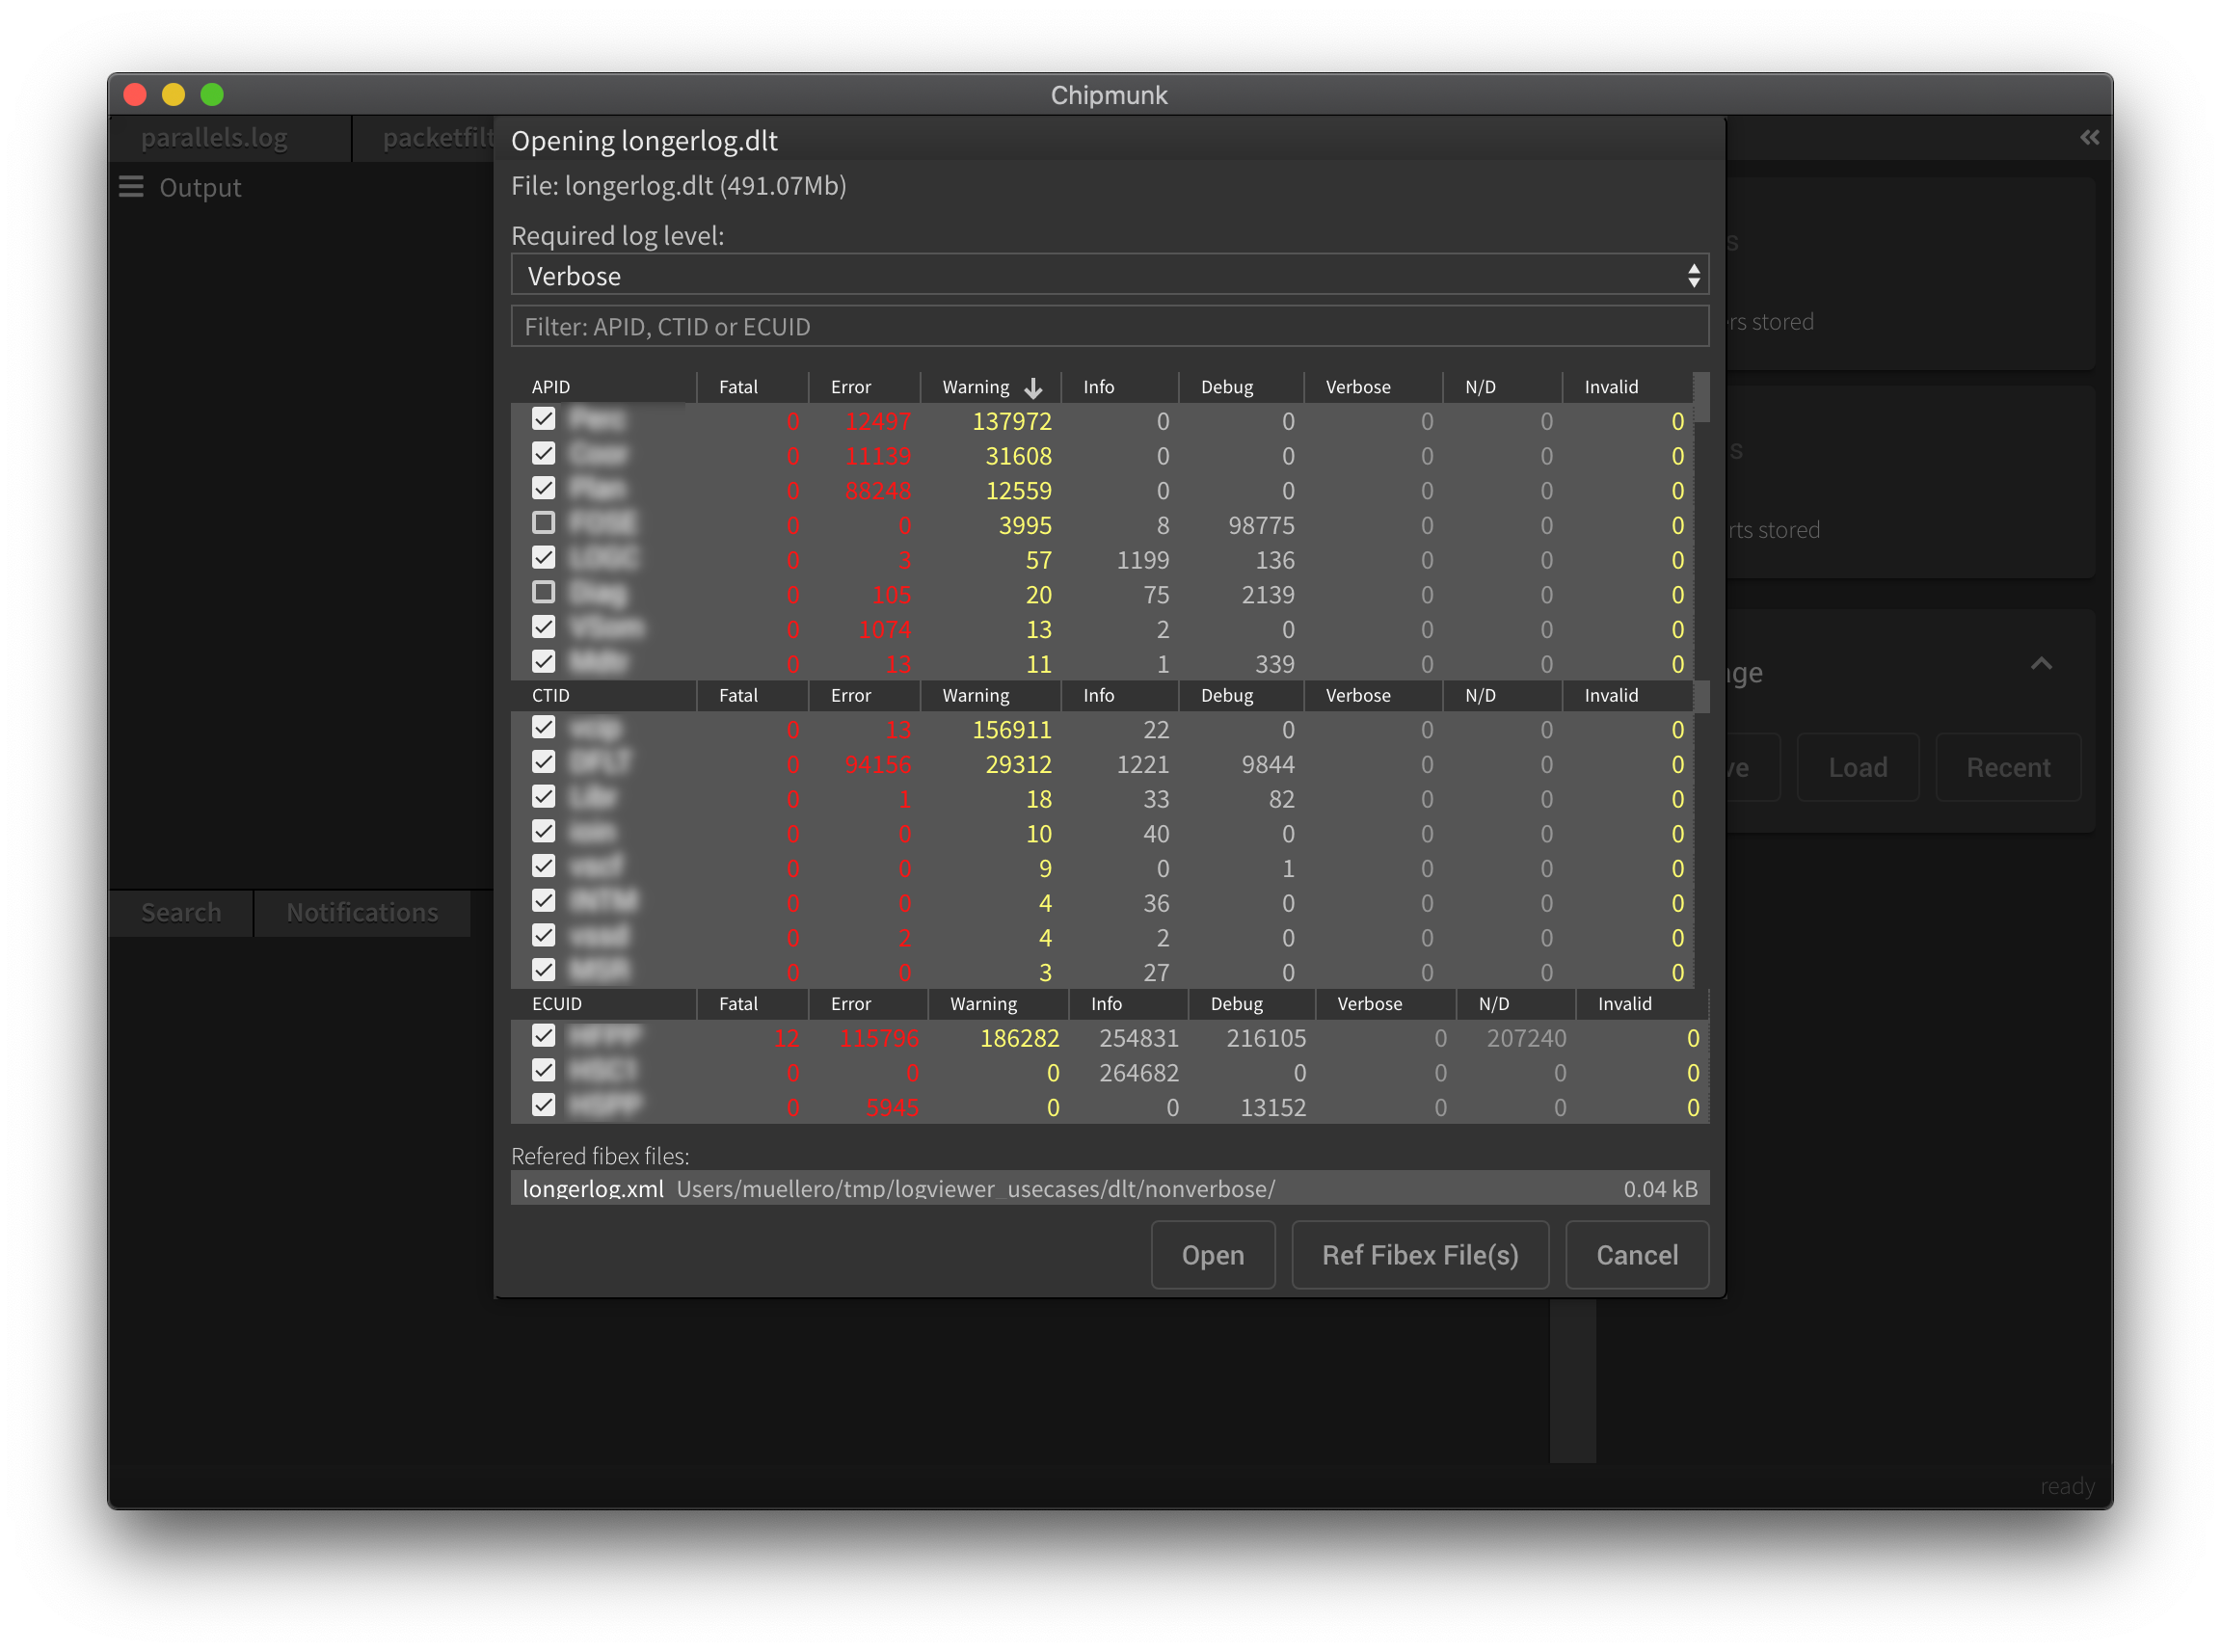 When you open the DLT file, you will immediately see a summary of the file, including a list of all components, which is convenient if you are interested in a specific APID, and not the entire log.
Speaking of threads
Out of the box with chipmunk comes a simple plugin “Commands”, which will allow you to run any console command and receive output in chipmunk with the ability to search for this output. Naturally, if you have an active search (for example, a saved filter), then the result data will be updated as the stream updates from your console command.
Oh yes plugins
There are few of them so far. That's right, really not enough. There are only 5 public ones (those that are in the public domain and accessible to the plugin manager), not public, I don’t even know, maybe a couple dozen.Writing your plugin is very simple (I’ll make a reservation for a simple task).For example, if your logs contain messages presented in the form of bytes, and you would like to see them immediately in a readable form (that is, decoded); it’s easy to gash a plug-in, which will receive the selected log fragment as input and throw the decoded output into the panel. Or maybe even decoding on the fly and displaying an intelligible text on the screen, and not A5 FF 13 EE ... etc.In general, there are two types of extensions: the first work with the render, that is, they allow you to change the presentation of the output: if you want columns, please; I want to decode something on the fly - you can; there is a desire to stick graphics (for example, icons) - it is not clear why you need it, but you can.Another type of plugins (and it is more interesting), those that can supply data (create streams). For example, want to see the output from the serial port? Not a problem: the case is a new npm project, we include our favorite port port in it, add a little UI to your taste and now your plugin can throw data into chipmunk.For convenience and first dates, as is usual in decent families, there is a quickstart repository with a couple of three examples.If interested, let me know in comments - I will make a separate post-guide for creating and publishing plugins (by the way, no registration is required for publishing).Instead of a conclusion
That’s probably all. I don’t want to make either an advertising booklet or a user card from this post - therefore, so briefly with a minimum of letters. My goal is to share with you another tool for working with logs, which can be useful for solving many problems.The project is fully open-source and open to your participation, any of your participation. Want to see support for something like that? Create an issue and select “Feature request”. Found a bug? We will be happy to see a bug report from you with a brief (but sufficient) description of the problem. English is welcome, but Russian is not forbidden.And of course, putting the treasured star on github, in just a few seconds you will feel a slight warmth and mood improvement from our gratitude for the approval of what we are doing. For you, click - for us, feedback and inspiration.Thank.Clarification(*) , (1 <). , . . 10-20 , . embedded .
(**), , . chipmunk . , chipmunk RAM, , SSD.