Let us analyze the dynamics of stocks of outsiders and leaders
Recently I read an article that outsider stocks (those that fell as much as possible in the price per month) of the Mosbirzhi index have greater growth prospects than the average index.In this study I will consider
- dynamics of stocks of outsiders and growth leaders (period of 30 days)
- Does it make sense to buy on drawdowns and play low after significant growth
Important! I will consider absolutely every day on all stocks, accordingly, many drawdowns will be dividend gaps (the idea is to consider all deviations).I will consider the shares of the Mosbirzha index (only shares with a share in the index> 0.5%), namely:- Gazprom
- Lukoil
- Sberbank
- MMC Norilsk Nickel
- NOVATEK
- Magnet
- Rosneft
- Tatneft
- MTS
- VTB
- Surgutneftegas
- ALROSA
- Surgutneftegas p
- Moscow Exchange
- NLMK
- Severstal
- Yandex
- Polymetal international
- Sberbank of Russia P
- INTER RAO
- RUSAL
- Pole
- Transneft p
- RusHydro
- PhosAgro
- MMK
- Aeroflot
- Megaphone
- Tatneft p
- Rostelecom
The period is 2018-2019.Getting stock quotes
First you need to get stock quotes for the last two years. I downloaded them from the Finam website and simply imported csv.Let's start collecting quotes inside our file
Import Pandas:import pandas as pd
Let's remove the restrictions on the display in the window (I need to do this in PyCharm):
pd.set_option('display.max_columns', None)
pd.set_option('display.expand_frame_repr', False)
pd.set_option('max_colwidth', 80)
pd.set_option('max_rows', 60000)
You need to import each stock in a similar way:
print('GAZP')
GAZP = pd.read_csv("GAZP_180101_191231.csv",sep=';', header=0, index_col='<DATE>', parse_dates=True)
GAZP = GAZP.sort_values(by='<DATE>')
GAZP['30_days_growth']=((GAZP['<CLOSE>']/GAZP['<CLOSE>'].shift(30))-1)*100
GAZP['after_30_days_growth']=((GAZP['<CLOSE>'].shift(-30)/GAZP['<CLOSE>'])-1)*100
GAZP['ticket']='GAZP'
print(GAZP)
- Display the name of the stock
- We read it from the file
- Sort by date
- Add a column with 30 percent daily stock growth.
- Add a percentage change column over the next 30 days.
- Add a column with a ticket. This will allow you to combine column datagrams with date.
View statistics on individual stocks
Now let's look at individual stocks. It is important to look at stocks separately since volatility can behave differently in different cases (for example, drawdowns in Detsky Mir and Norilsk Nickel are redeemed quickly, and the oil industry in difficult times can be ignored altogether)Look at the columns 30_days_growth for screenshots (percentage change over the past 30 days) and after_30_days_growth (how much the stock will cost after 30 days)Using Gazprom as an example, let's see what happens to the stock after a 30-day decline of more than 10%.Get Gazprom sorted by 30-day change
print(GAZP.sort_values(by='30_days_growth'))
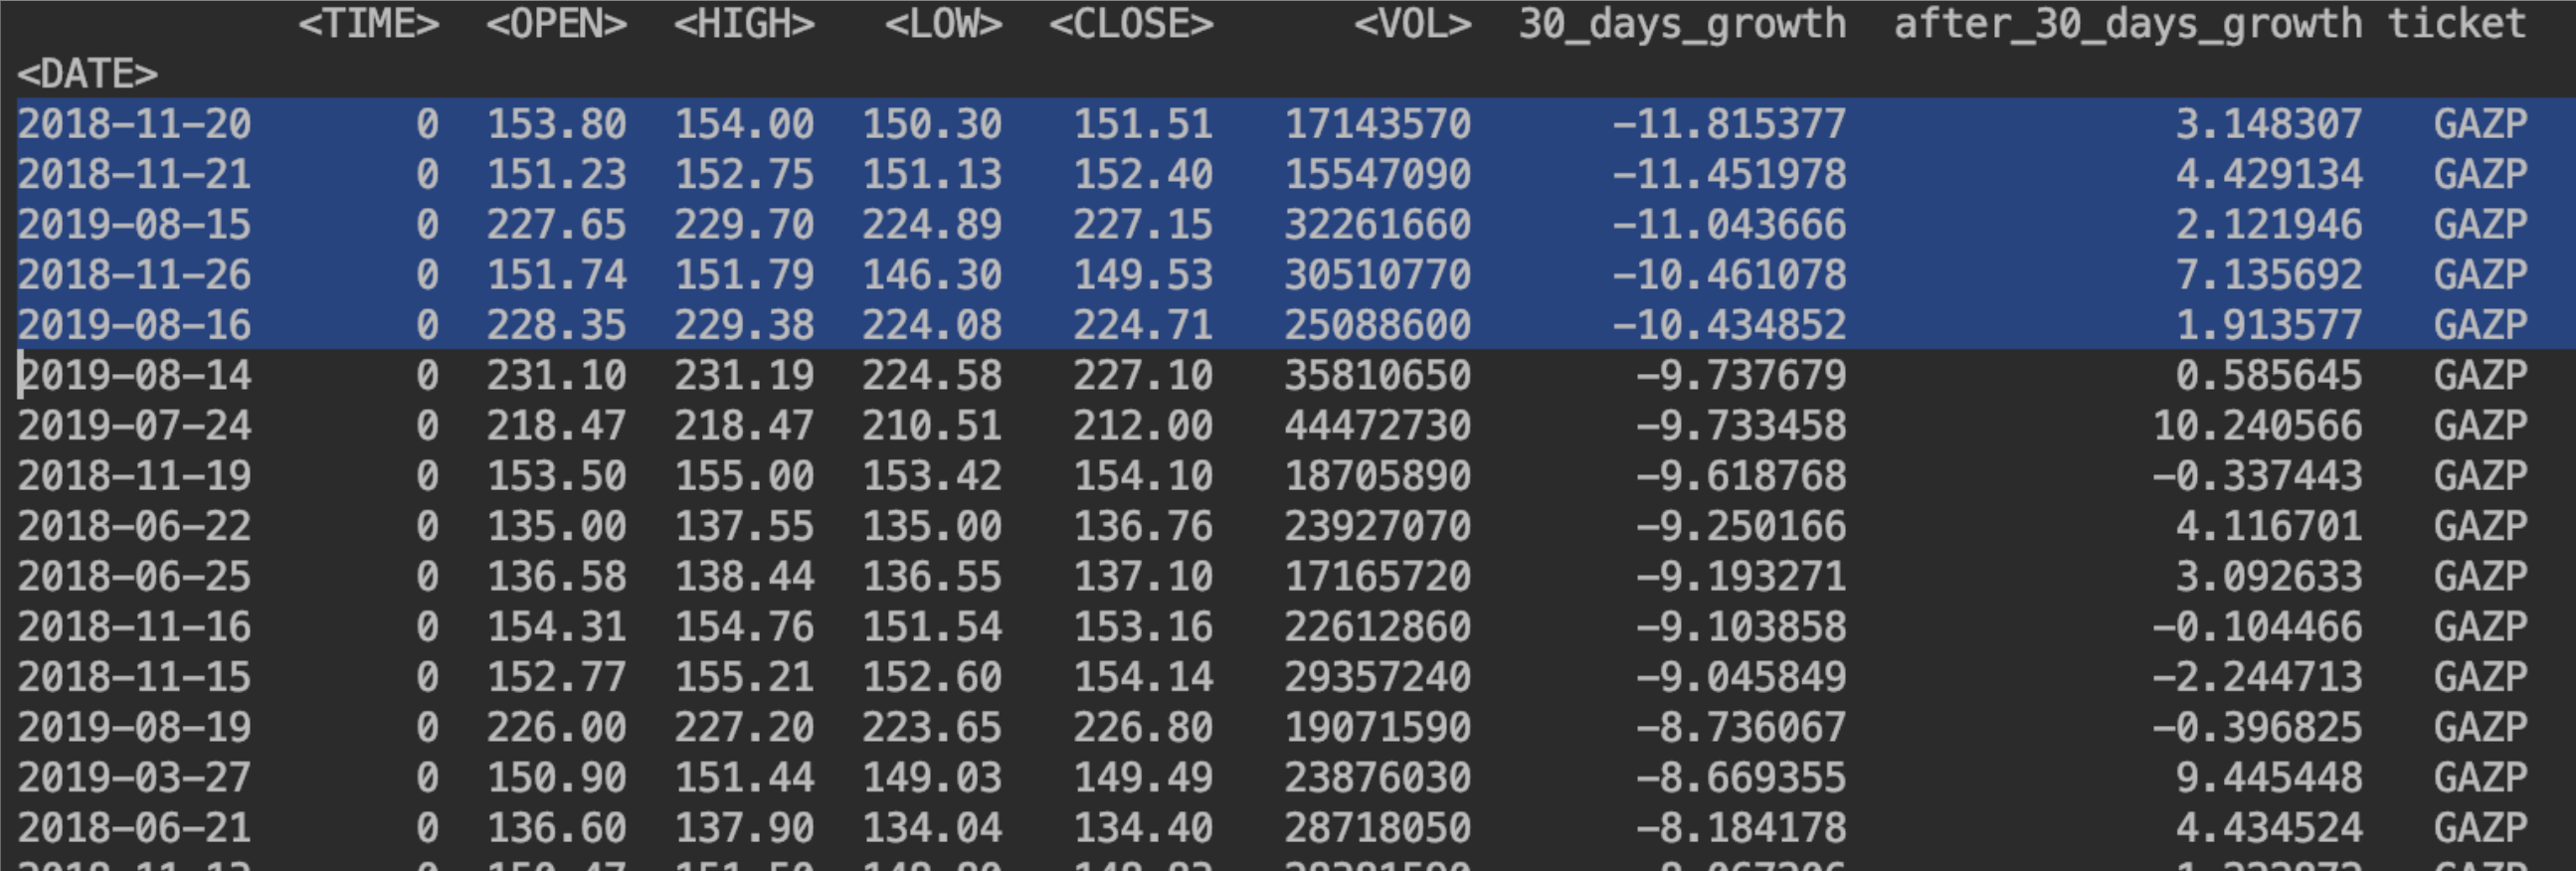 In this case, we see that stocks will grow during the month (In the column with 30-day growth, mostly positive values).But from the other end, everything is not so obvious, since the new dividend policy has “broken” everything.
 We will throw back 2019 to draw conclusions. To do this, I will output only the first 255 lines:
print(GAZP[:254].sort_values(by='30_days_growth'))
 It turns out that with an increase of more than 10% it makes sense to sell.Let's look at Lukoil.Everything is not so obvious here: We will
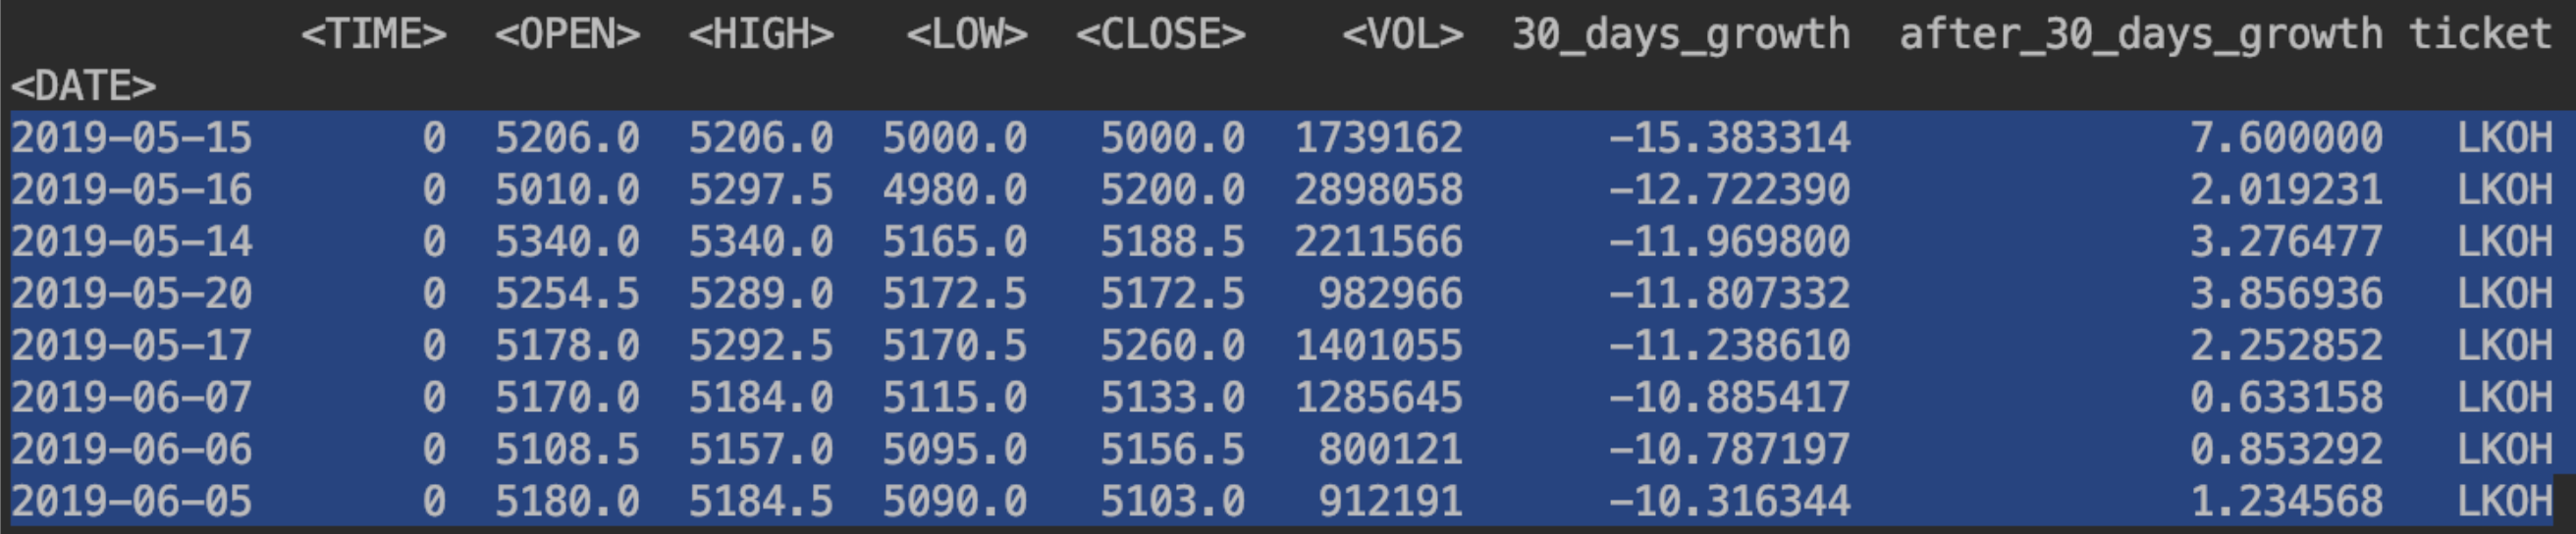
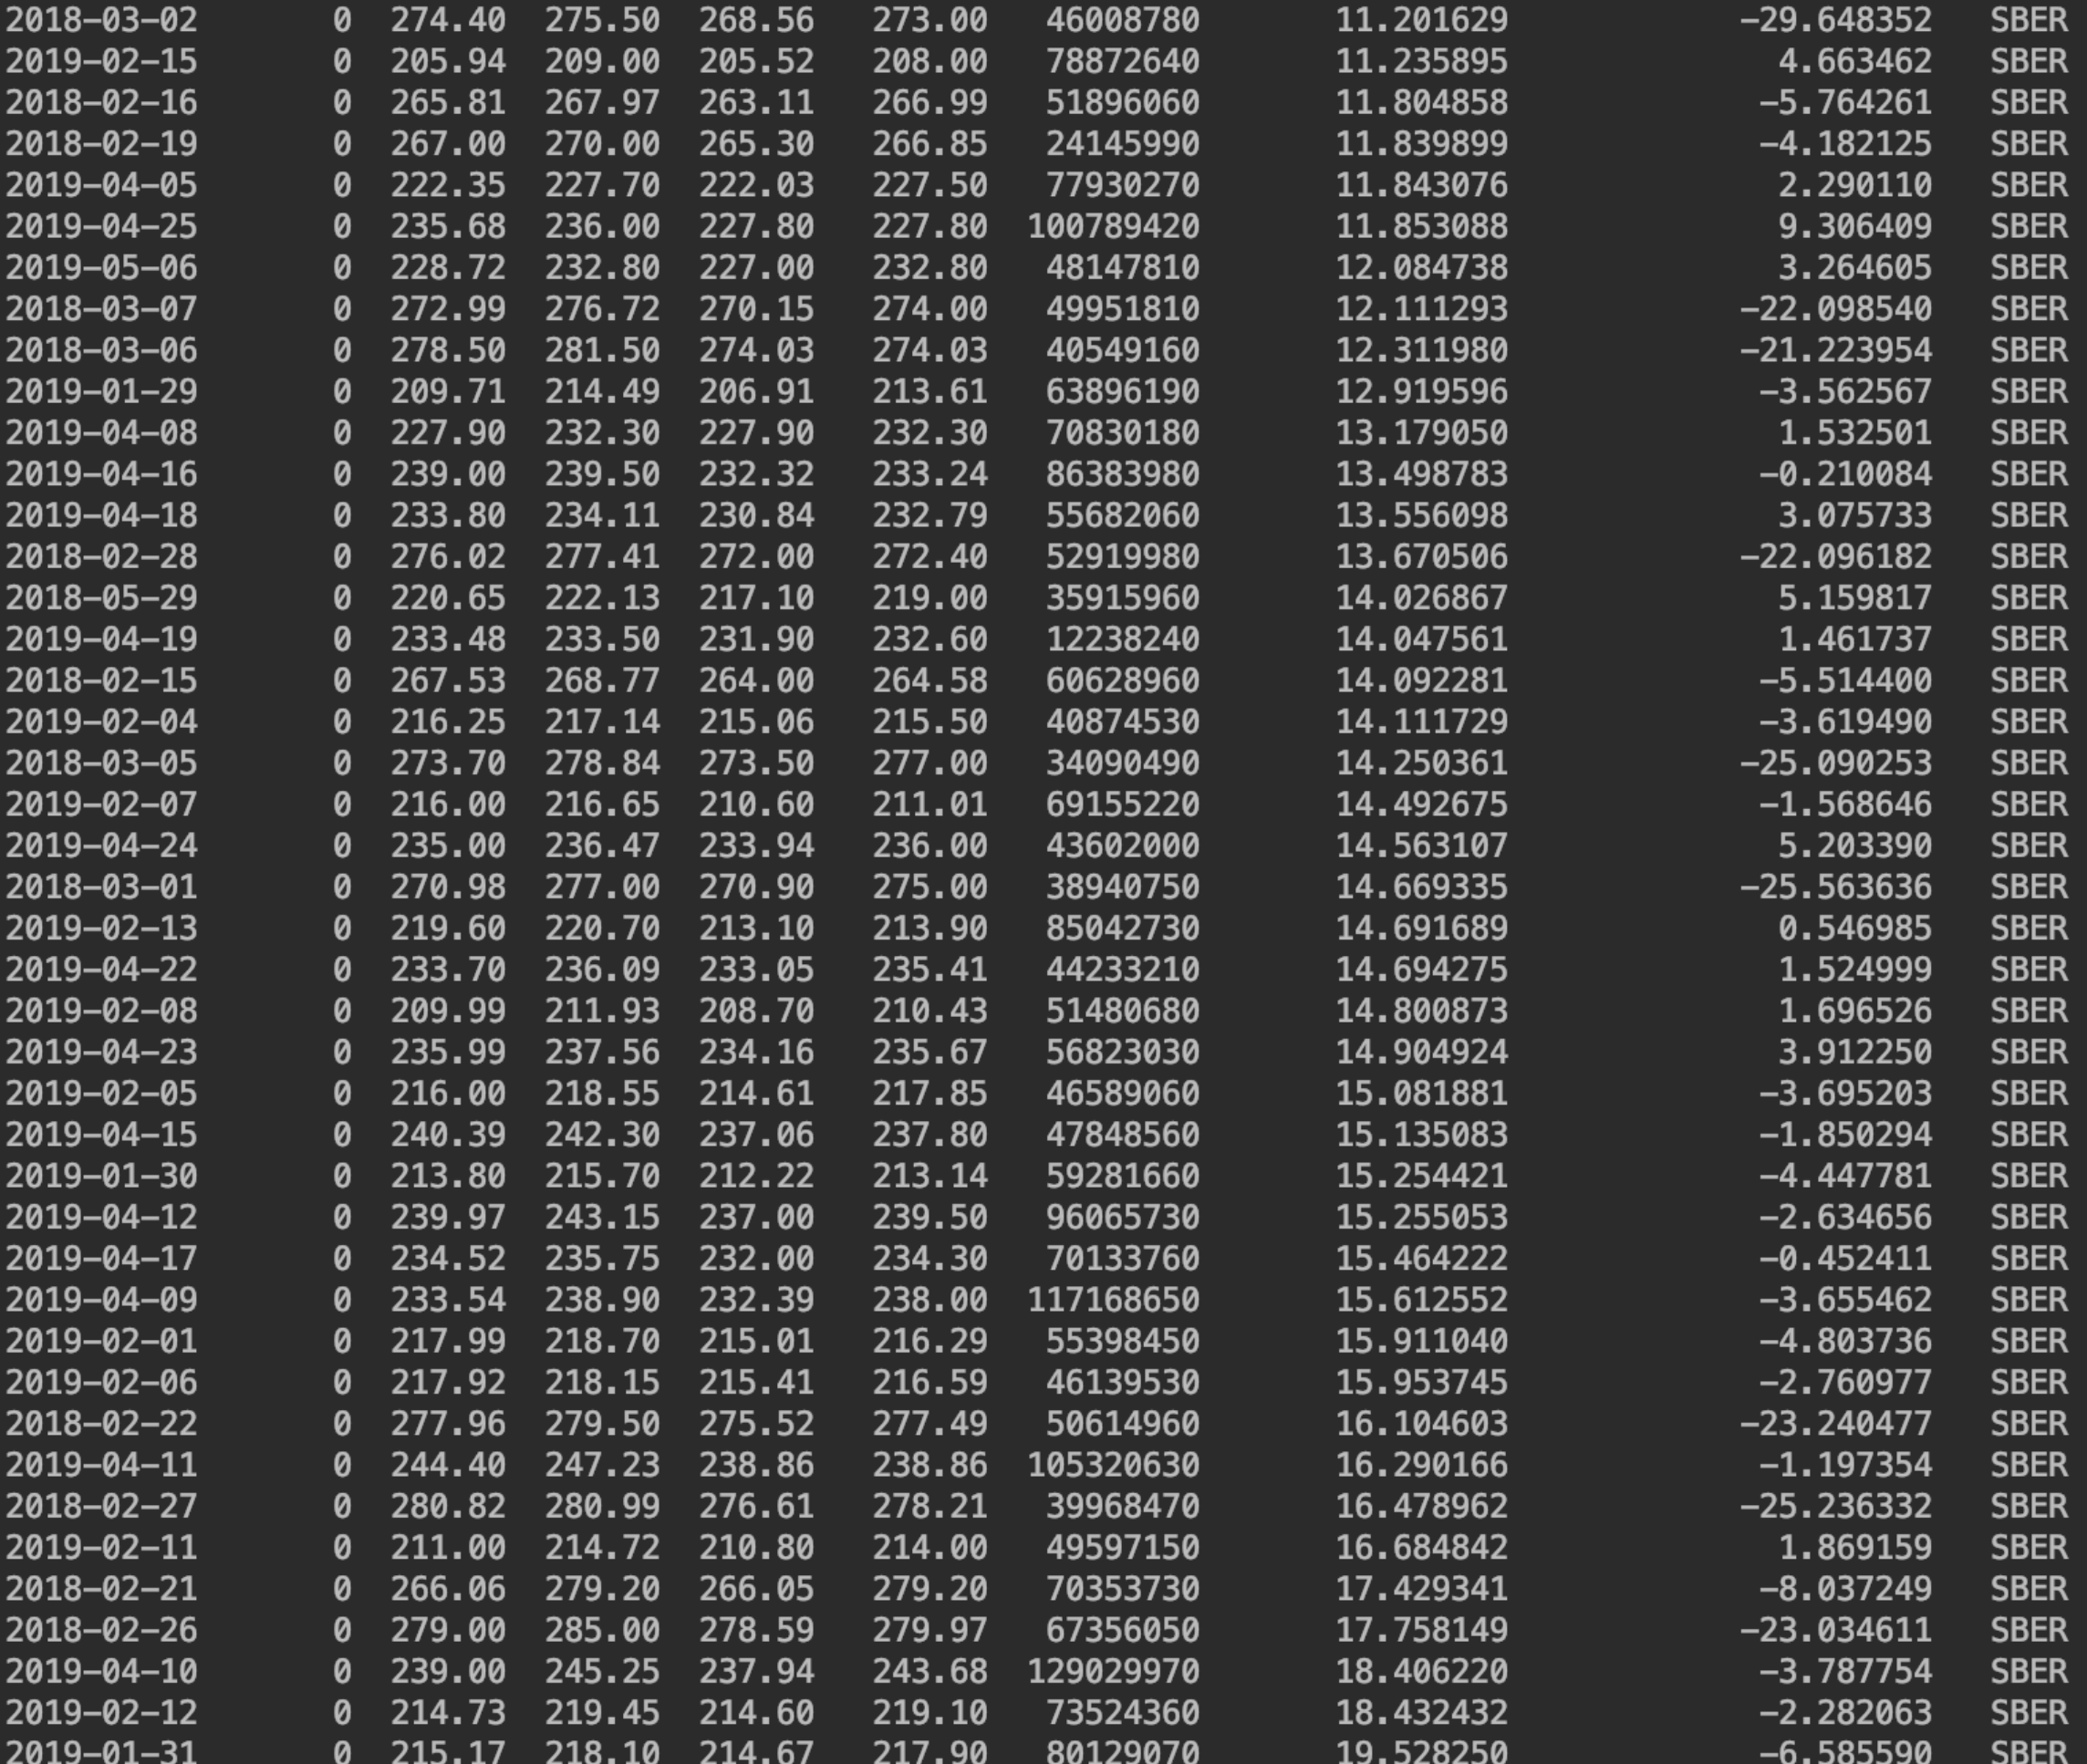
 look at the financial sector ofSberbank.Strong drawdowns are usually redeemed. But here the volatility of the ogh
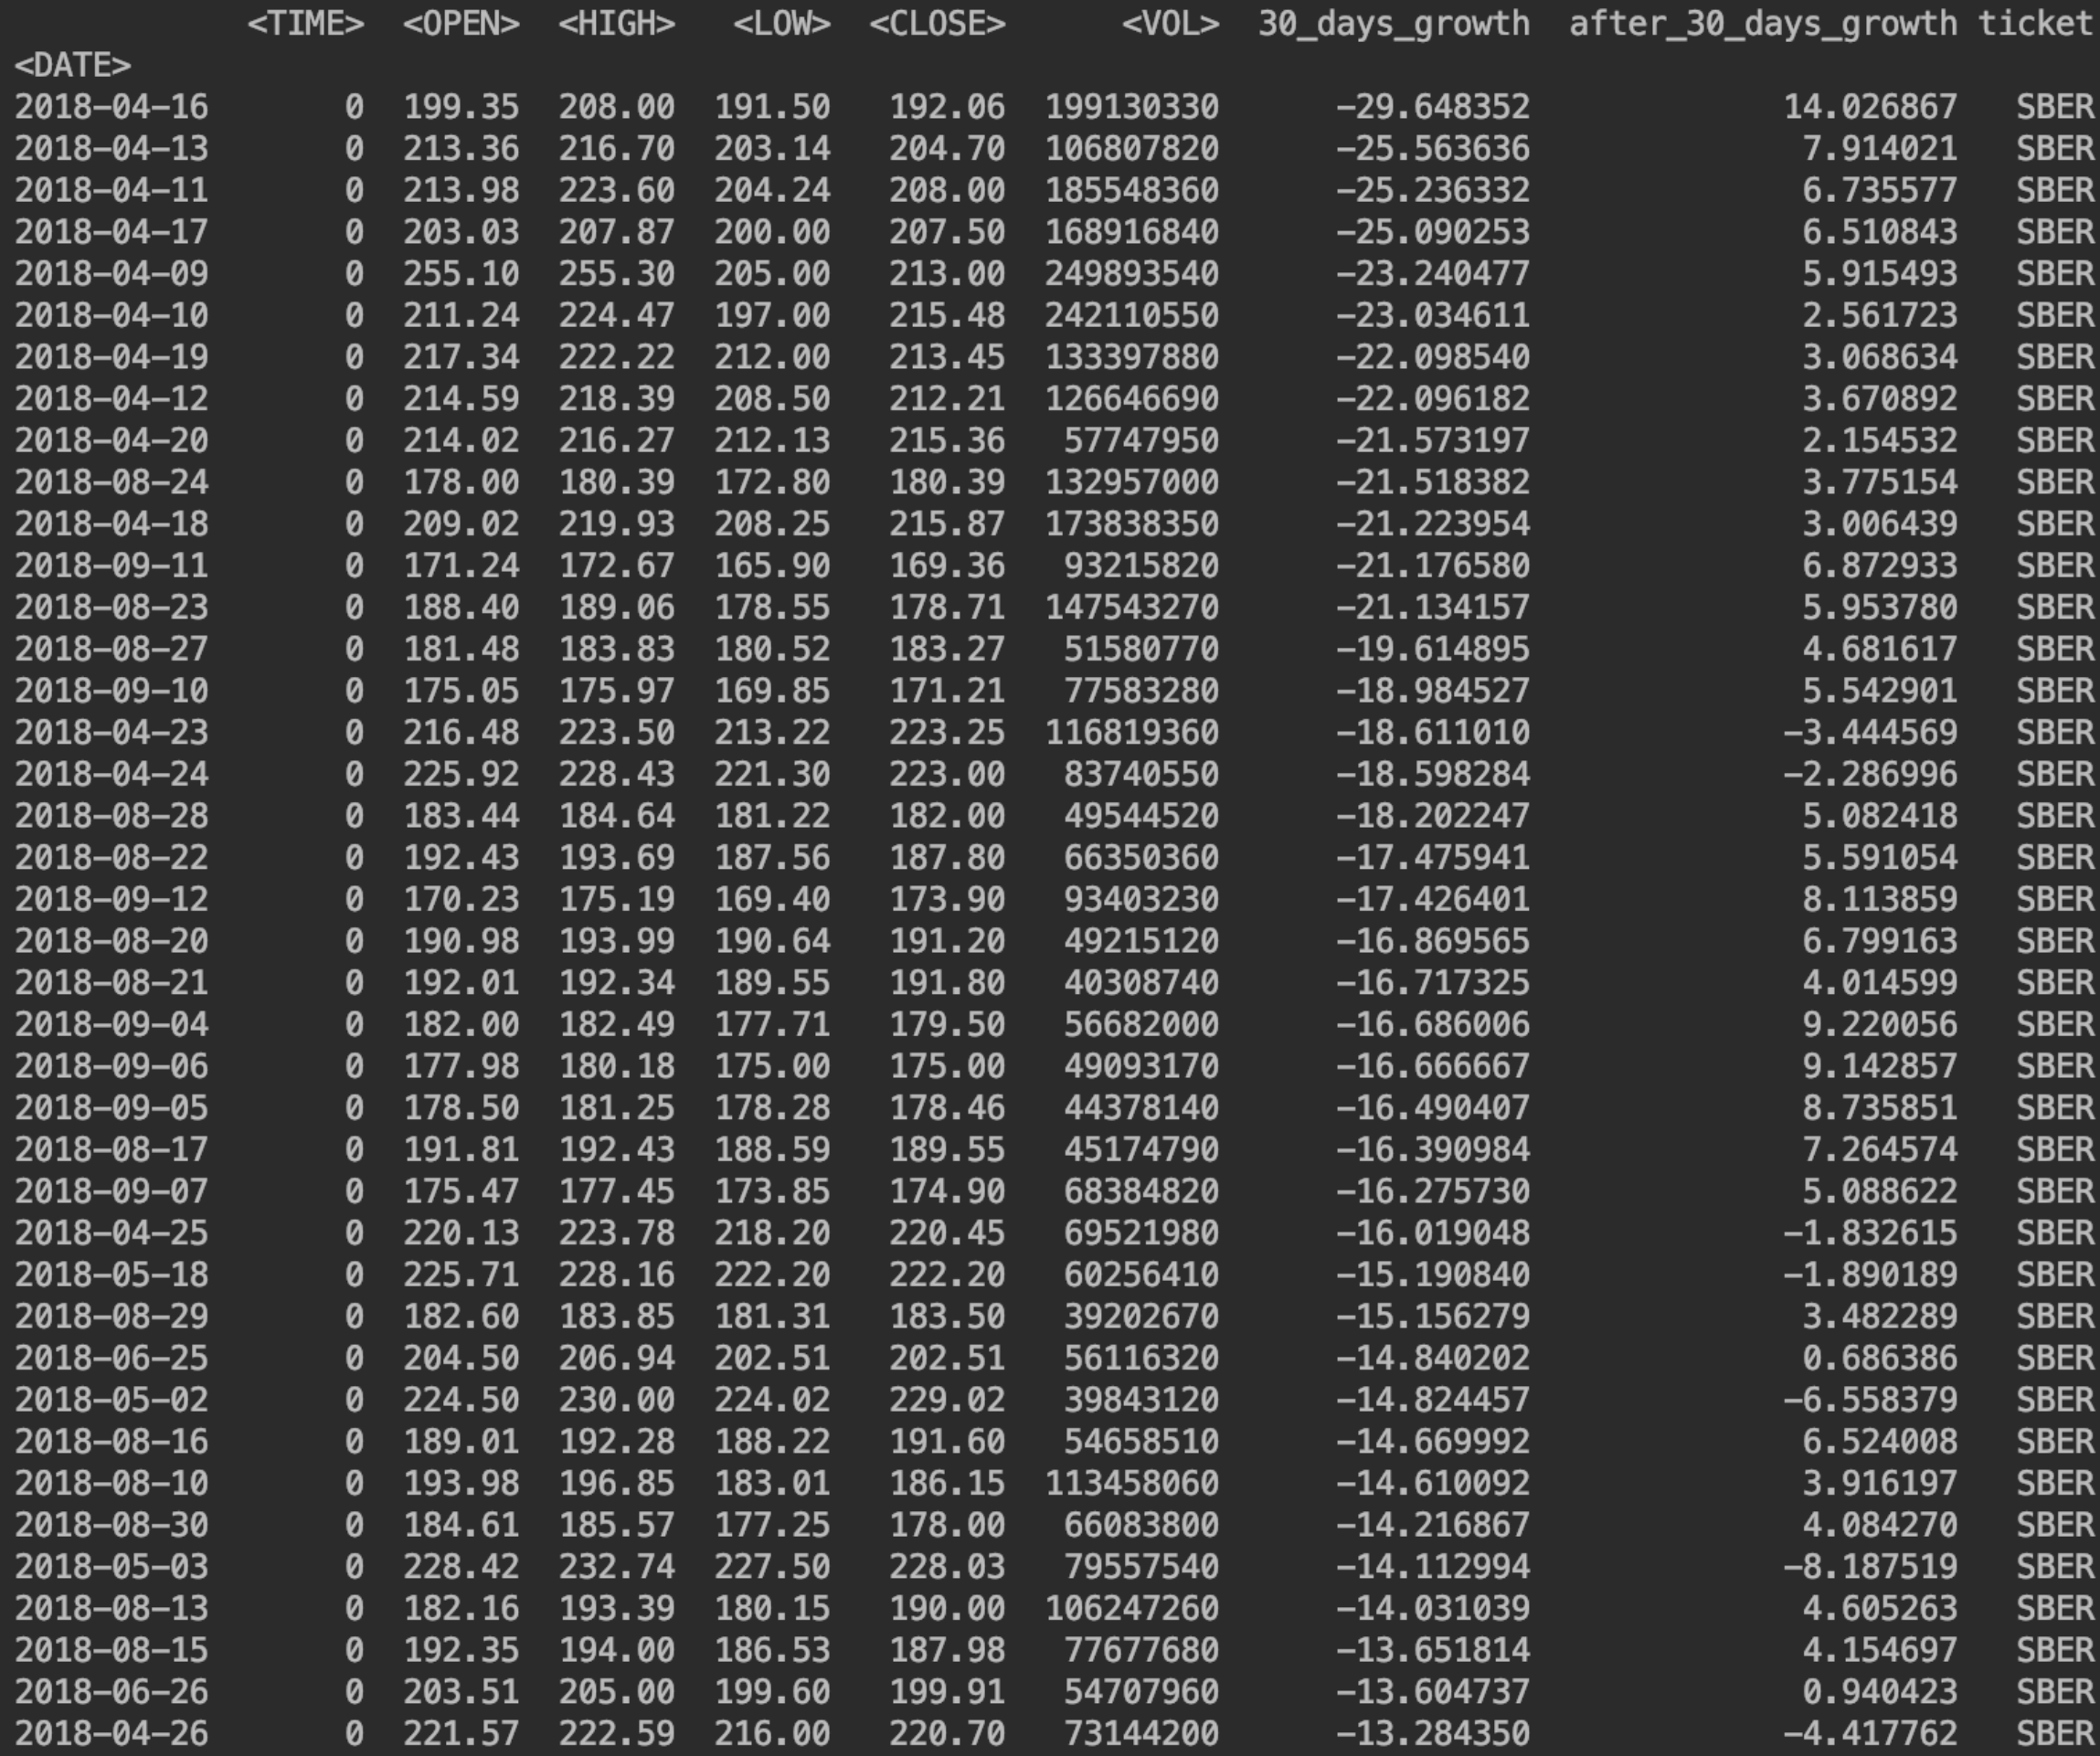
 Most interesting was to see how drawdowns are bought from Norilsk Nickel.
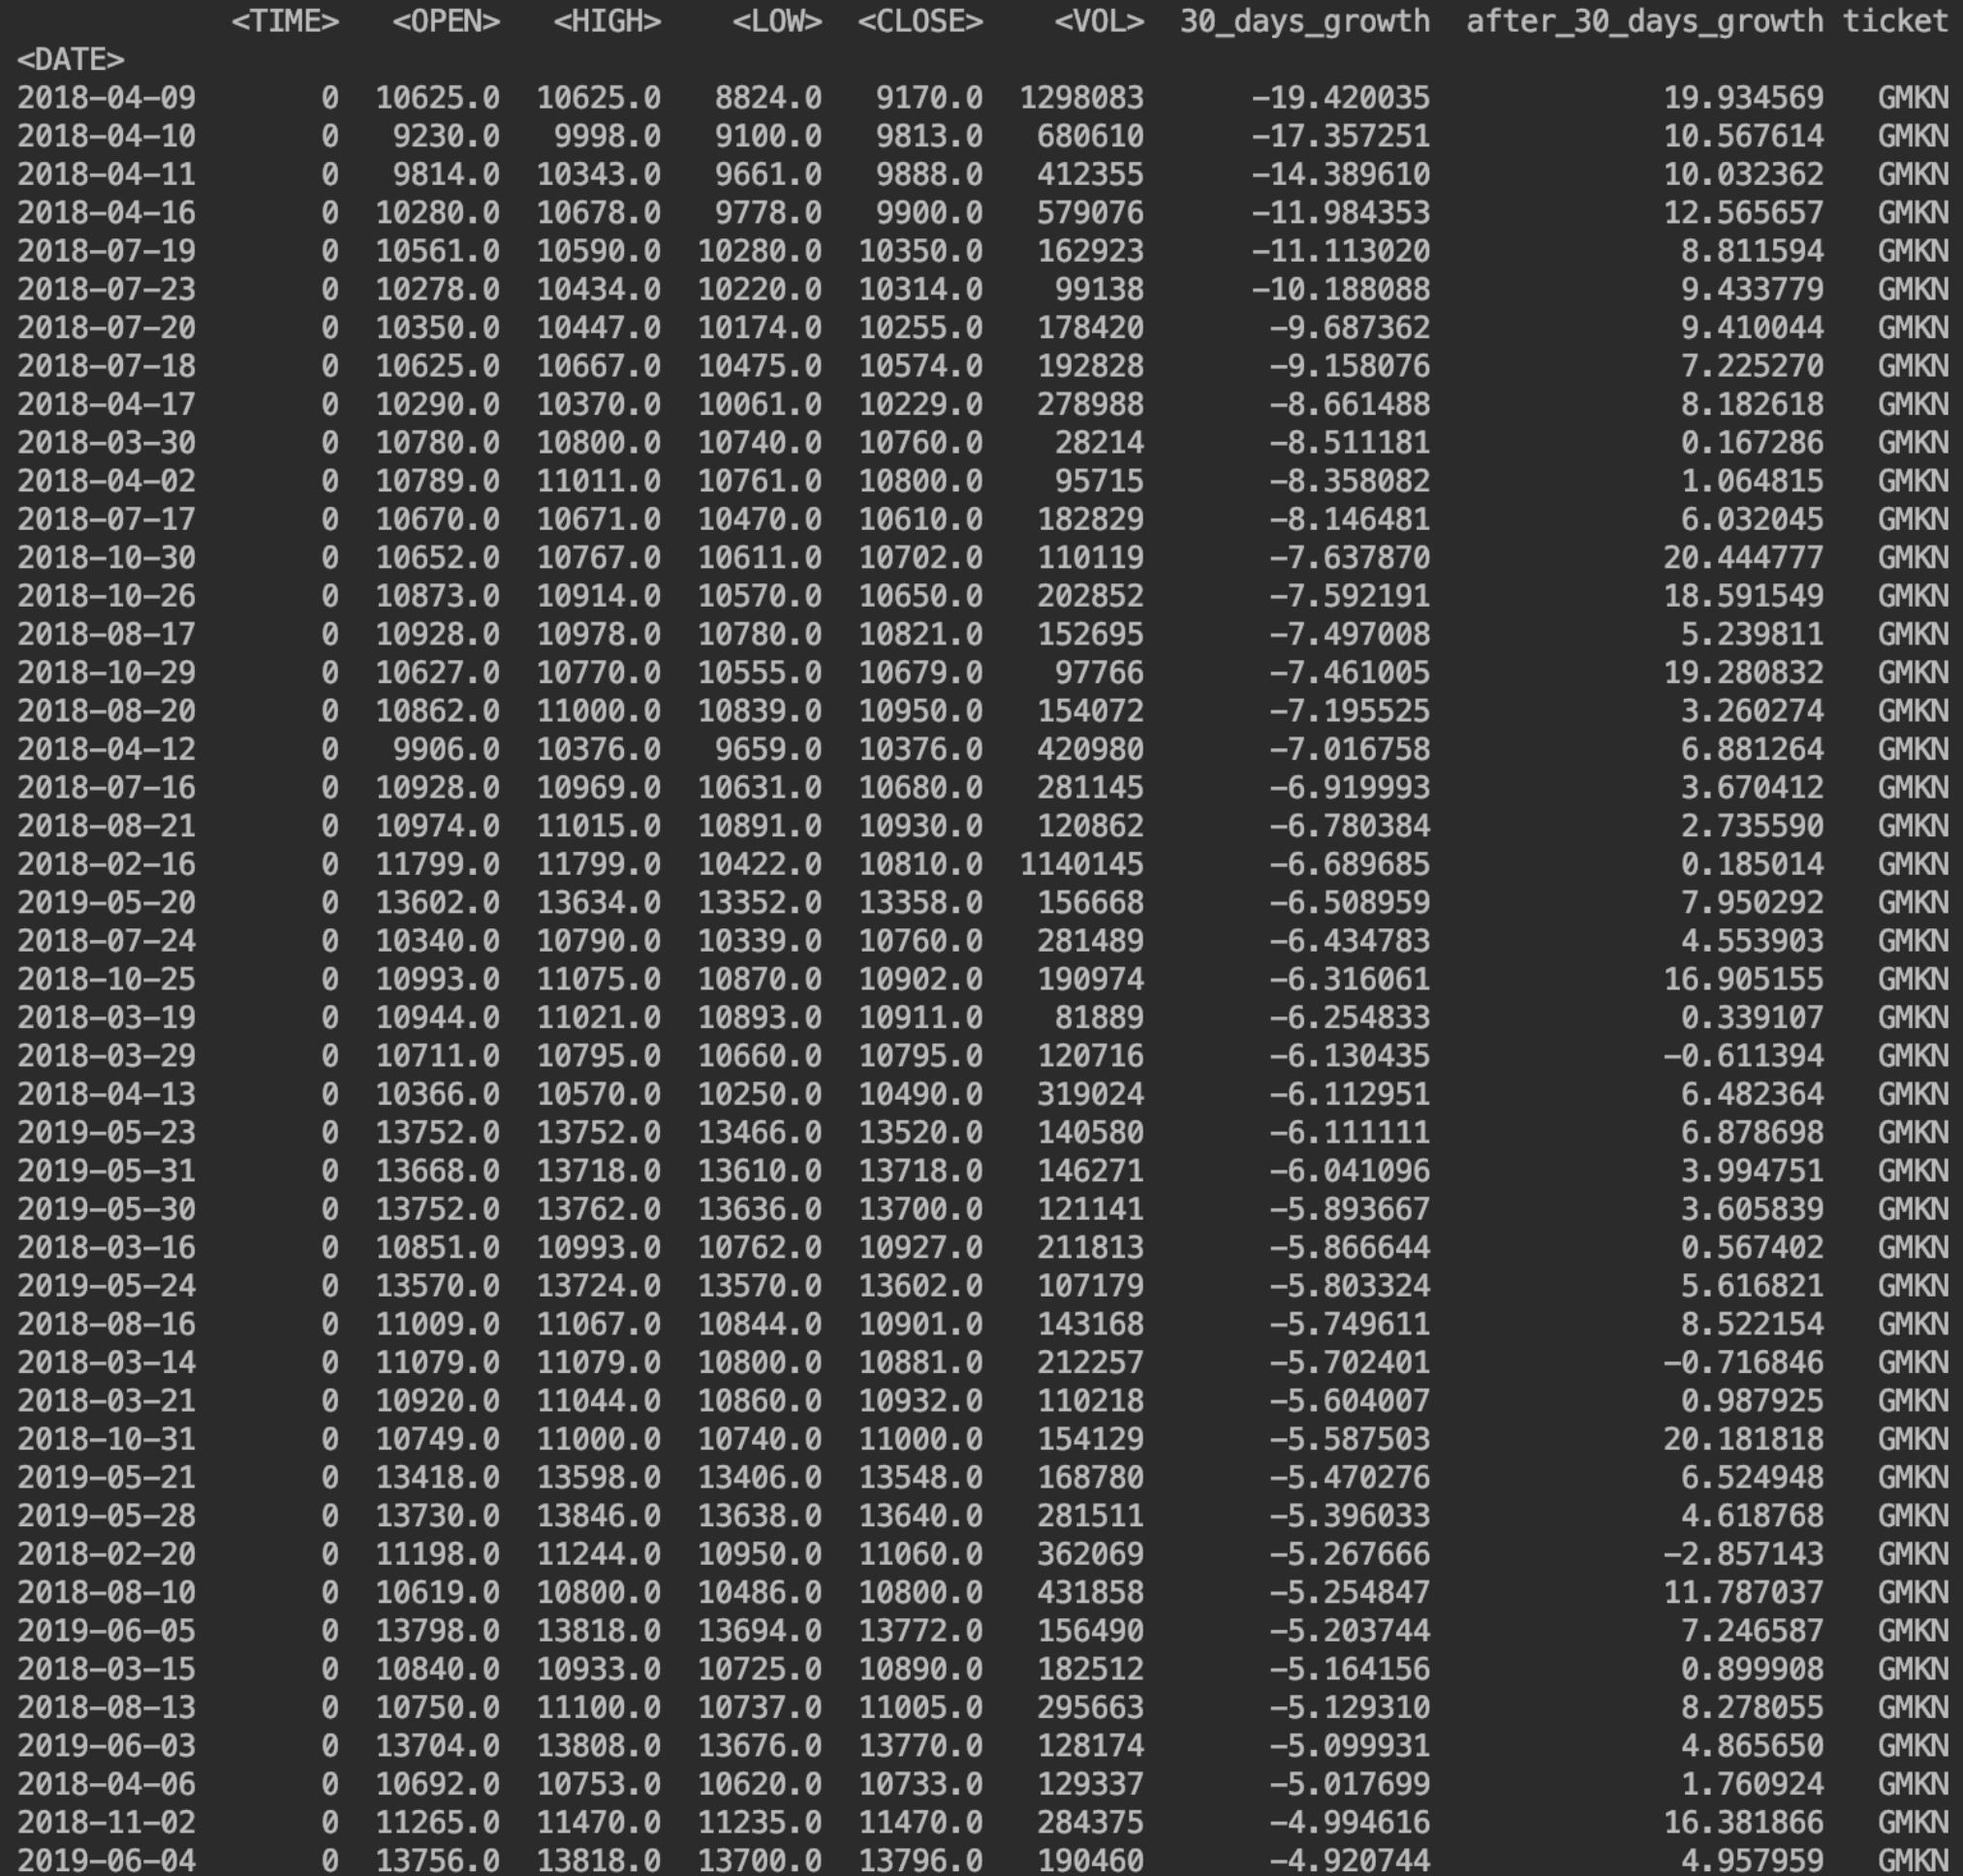 Almost any Norilsk Nickel drawdown in the last two years is a good investment :)
Calculation of the average return for 30 days
Let's see what average yield we get per month if we enter a drawdown below -5%.Create a variable with these lines:
GMKN5 = GMKN[GMKN['30_days_growth']<-5]
print(GMKN5)
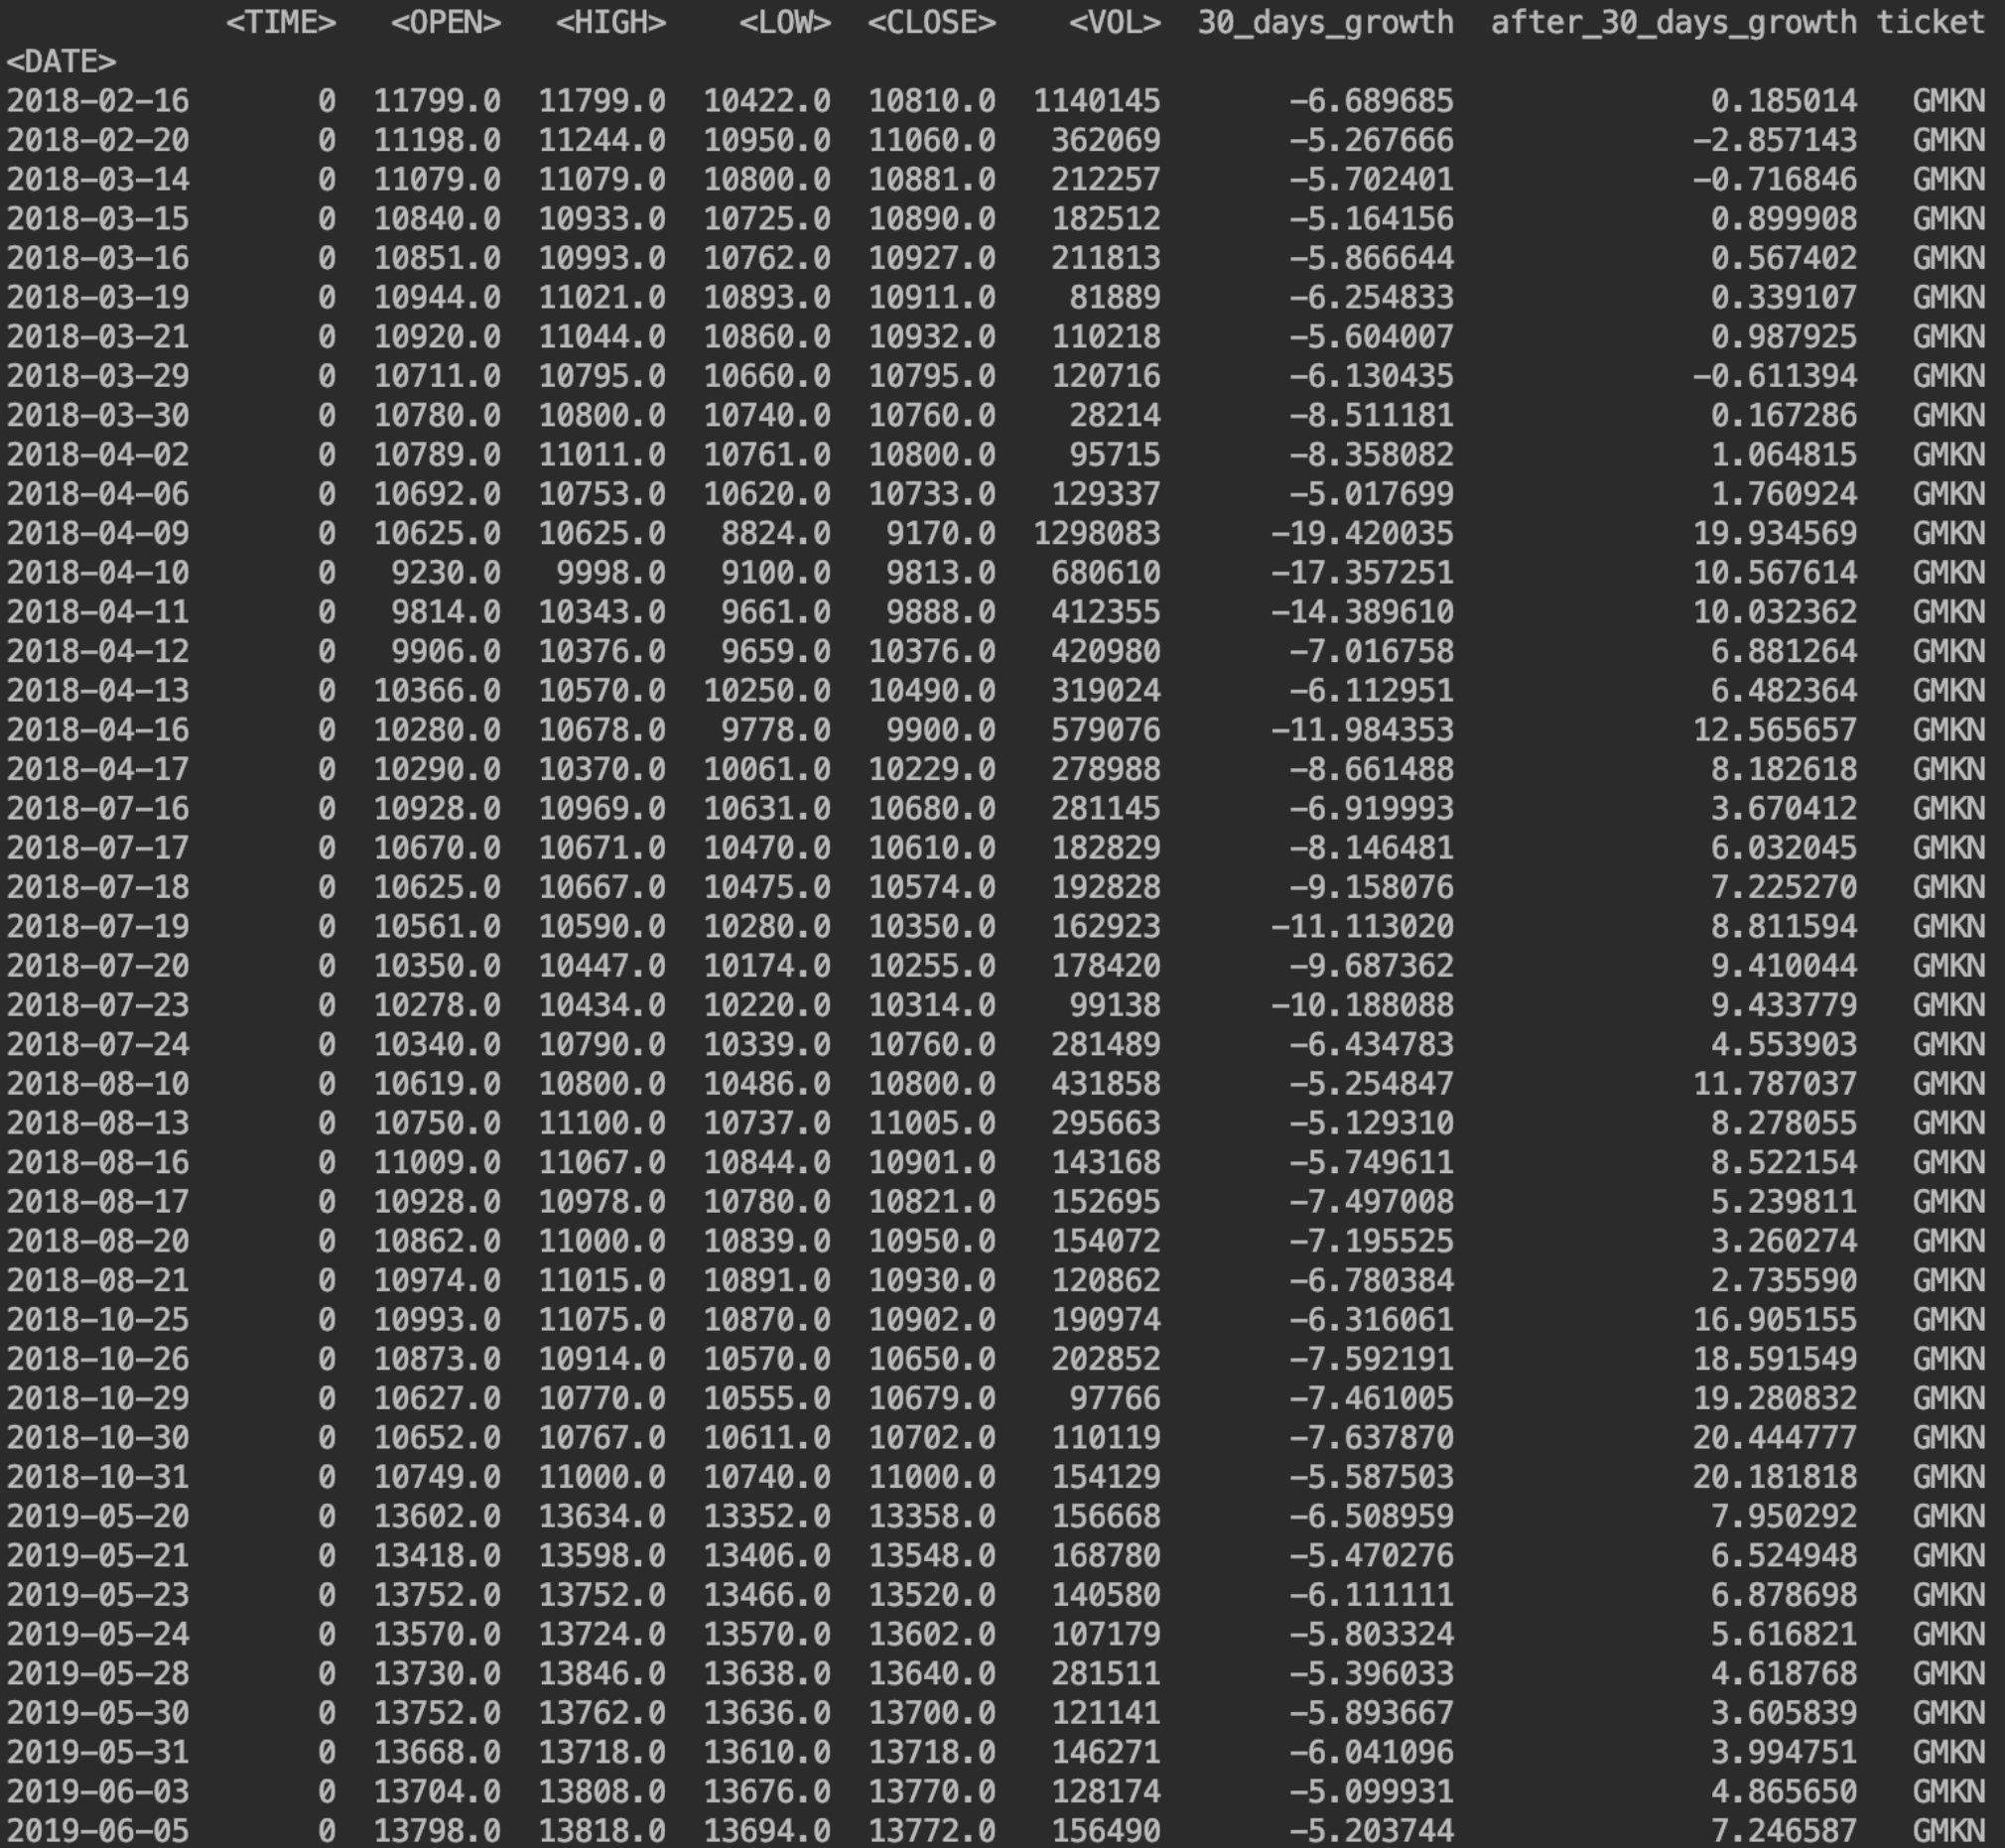 We derive the average:
print( GMKN5['after_30_days_growth'].mean())
We will get the return for 30 days 6.935553432942371%We’ll also see how the cost increases in 14 days
Add a column:
GMKN['after_14_days_growth']=((GMKN['<CLOSE>'].shift(-14)/GMKN['<CLOSE>'])-1)*100
Let's see the average gain for 14 days:
print(GMKN5['after_14_days_growth'].mean())
This is 4.125%Calculation of the return on all shares with a drawdown of more than 15%
Now we calculate the average yield for 30 days for all stocks where the drawdown is more than 15%.We need to combine everything into one data frame.To do this, create a sheet with all the shares:
all_tickets = [GAZP,LKOH,SBER,SBERP,NVTK,MOEX,MGNT,MFON,MTSS,MAGN,GMKN,AFLT,POLY,ROSN,HYDR,RTKM,RUAL,YNDX,ALRS,VTBR,TATN,TATNP,SNGS,SNGSP,PLZL,NLMK,CHMF,IRAO,TRNFP,PHOR]
Combine:
all_stocks = pd.concat(all_tickets)
Create a data frame in which there will only be lines with drawdowns greater than 15%:
tickets15 = all_stocks[all_stocks['30_days_growth']<-15]
print(tickets15)
Calculate the average yield:
print(tickets15['after_30_days_growth'].mean())
We get 7.78570670526497%Pretty good considering this level of diversification.Similarly, calculate the yield of 10% drawdowns
tickets10 = all_stocks[all_stocks['30_days_growth']<-10]
print(tickets10)
print(tickets10['after_30_days_growth'].mean())
We get 3.1%Is it worth it to play on lowering shares that have grown by 15% + in 30 days?
tickets15plus = all_stocks[all_stocks['30_days_growth']>15]
print(tickets15plus)
print(tickets15plus['after_30_days_growth'].mean())
We get a growth of 2%. It turns out that this way we will not be able to profit, but here it is clear that the potential in this case is less. But this is not surprising.The numbers, of course, are interesting, but it is worth considering that this is to a greater extent a benchmark, since we will get this profitability in the case of buying all drawdowns every day, while they are in the required range.It is required to remove lines with close dates so that there is no duplication of the same drawdown, but this is another story.The reasons for all deviations should also be considered. Obviously, if Gazprom introduces a new divisional policy, it is not worth waiting for the fall in the near future.