Well continue ?Sliding Window (Moving Windows)
In the title, I quoted a literal translation. If someone corrects me, and another term is more applicable - thanks.The meaning of the sliding window is that with each new value, the function is recalculated for a given period of time. These functions a great number . For example: rolling.mean (), rolling.std (), which are most often used in the analysis of stock movements. rolling.mean () is a common moving average that smooths out short-term fluctuations and allows you to visualize the overall trend.
adj_close_px = sber['Adj Close']
moving_avg = adj_close_px.rolling(window=40).mean()
print(moving_avg[-10:])
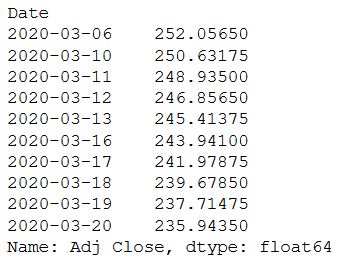 A graph that allows you to understand what is obtained as a result of this function:
sber['40'] = adj_close_px.rolling(window=40).mean()
sber['252'] = adj_close_px.rolling(window=252).mean()
sber[['Adj Close', '40', '252']].plot(figsize=(20,20))
plt.show()
 As you can see rolling.mean () copes with the task. The function smooths out short-term fluctuations and allows you to see a long-term trend based on which you can make a decision: the price is higher than the moving average considered - we take a share, lower - we sell a share - if it is simple and I would not advise to follow this method. As a rule, in addition to moving averages, other indicators are also used that can confirm the correctness of the decision. Everyone must make their own decisions, depending on the trading style.
Volatility
Stock volatility is the change in the variance of stock returns over a period of time. They usually compare the volatility of one stock with another to get an idea of which may have the greatest risk, or with a market index to understand the volatility of stocks relative to the market. As a rule, the higher the volatility, the riskier the investment in this stock. It should be noted that it is not constant and changes over time. This can again be seen with the rolling.std () function included in the pandas package. Example of calculating volatility changes:
min_periods = 60
vol = daily_pct_change.rolling(min_periods).std() * np.sqrt(min_periods)
vol.plot(figsize=(10, 10))
plt.show()
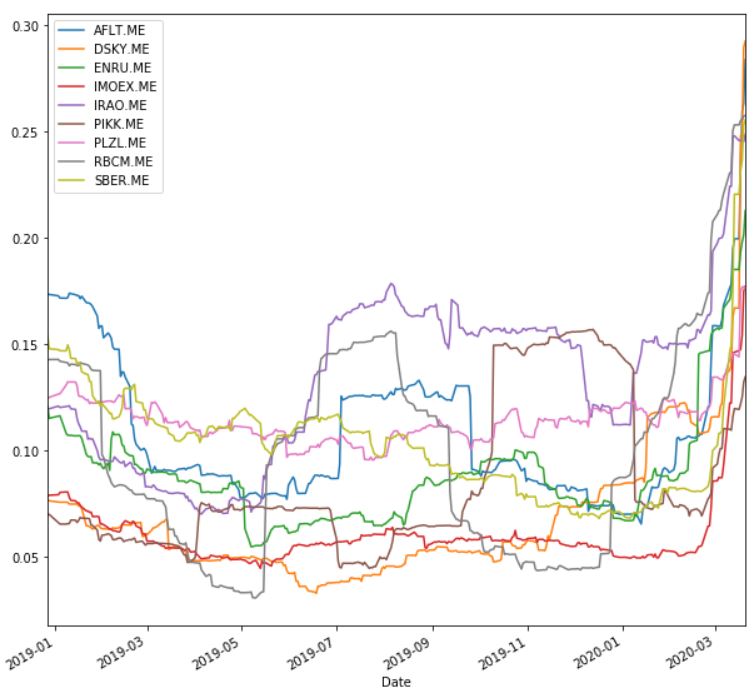 Please note that, unlike last week, I got two more values - the Moscow Exchange Index (IMOEX.ME) and RBC (RBCM.ME). I will need their values in the next publication on the least squares method. And that's all for today.