 I want to devote this series of articles to readers who want to explore the world of 3D programming from scratch, to people who want to learn the basics of creating the 3D component of games and applications. We will implement each operation from scratch in order to understand every aspect, even if there is already a ready-made function that makes it faster. Having learned, we will switch to the built-in tools for working with 3D. After reading the series of articles, you will understand how to create complex three-dimensional scenes with light, shadows, textures and effects, how to do all this without deep knowledge in mathematics, and much more. You can do all this both independently and with the help of ready-made tools.In the first part we will consider:
- Rendering concepts (software, hardware)
- What is a pixel / surface?
- Detailed analysis of line output
In order not to waste your precious time reading articles, which may be incomprehensible to an unprepared person, I will immediately turn to the requirements. You can safely start reading articles on 3D, if you know the basics of programming in any language, because I will focus only on the study of 3D programming, and not on the study of the features of the language and the fundamentals of programming. As for the mathematical preparation, you should not worry here, although many have no desire to study 3D, because they are frightened by complex calculations and furious formulas because of which nightmares later dream, but in fact there is nothing to worry about. I will try to explain as clearly as possible everything necessary for 3D, you just have to be able to multiply, divide, add and subtract. So, if you have passed the selection criteria, you can start reading.Before starting to explore the interesting world of 3D, let's choose a programming language for examples, as well as a development environment. What language should I choose for programming 3D graphics? Anyone, you can work where you are most comfortable, the math will be the same everywhere. In this article, all examples will be shown in the context of JS (here tomatoes fly into me). Why js? It's simple - lately I have been working mainly with him, and therefore I can more effectively convey the essence to you. I will bypass all the features of JS in the examples, because we need only the most basic features that any language has, so we will pay attention specifically to 3D. But you choose what you love, because in the articles, all formulas will not be tied to the features of any programming language. Which environment to choose? It does not matter,in the case of JS, any text editor is suitable, you can use the one that is closer to you.All examples will use canvas for painting, as with it, you can start drawing very quickly, without detailed analysis. Canvas is a powerful tool, with a lot of ready-made methods for drawing, but of all its features, for the first time, we will only use pixel output! All three-dimensional displays on the screen using pixels, later in the articles you will see how this happens. Will it slow down? Without hardware acceleration (for example, acceleration by a video card) - will be. In the first article, we will not use accelerations, we will write everything from scratch in order to understand the basic aspects of 3D. Let's look at a few terms that will be mentioned in future articles:- (Rendering) — 3D- . , 3D- , , .
- (Software Rendering) — . , , , - . , . 3D- , — .
- Hardware Rendering - A hardware-assisted rendering process. I use it games and applications. Everything works very fast, because a lot of routine computing takes over the video card, which is designed for this.
I do not aspire to the title "definition of the year" and I try to state all descriptions of terms as clearly as possible. The main thing is to understand the idea, which can then be developed independently. I also want to draw attention to the fact that all the code examples that will be shown in the articles are often not optimized for speed, in order to maintain ease of understanding. When you understand the main thing - how 3D graphics work, you can optimize everything yourself.First, create a project, for me it's just a text index.html file, with the following content:<!DOCTYPE html>
<html lang="en">
<head>
<meta charset="UTF-8">
<title>3D it’s easy. Part 1</title>
</head>
<body>
<canvas id="surface" width="800" height="600"></canvas>
<script>
</script>
</body>
</html>
I will not focus too much on JS and canvas now - these are not the main characters of this article. But for a general understanding, I’ll clarify that <canvas ...> is a rectangle (in my case, 800 by 600 pixels in size) on which I will display all the graphics. I registered canvas once and will not change it anymore.<script> … </script>
Script - an element within which we will write all the logic for rendering 3D graphics with our own hands (in JavaScript). When we just reviewed the structure of the index.html file of the newly created project, we will begin to deal with 3D graphics.When we draw something in the window, this in the final count turns into pixels, because it is them that the monitor displays. The more pixels, the sharper the picture, but the computer also loads more. How is what we draw in the window stored? The graphics in any window can be represented as an array of pixels, and the pixel itself is just a color. That is, a screen resolution of 800x600 means that our window contains 600 lines of 800 pixels each, namely 800 * 600 = 480000 pixels, a lot, isn't it? Pixels are stored in an array. Let's think in which array we would store the pixels. If we should have 800 by 600 pixels, then the most obvious option is in a two-dimensional array of 800 by 600. And this is almost the right option, or rather, the completely correct option. But the pixels of the window, it is better to store in a one-dimensional array of 480,000 elements (if the resolution is 800 by 600),just because it’s faster to work with a one-dimensional array, because it is stored in memory in a continuous sequence of bytes (everything lies nearby and therefore it is easy to get it). In a two-dimensional array (for example, in the case of JS), each line can be scattered at different places in memory, so accessing the elements of such an array will take longer. Also, to iterate over a one-dimensional array, only 1 cycle is needed, and for two-dimensional integers 2, given the need to do tens of thousands of iterations of the cycle, the speed is important here. What is a pixel in such an array? As mentioned above - this is just a color, or rather 3 of its components (red, green, blue). Any, even the most colorful picture is just an array of pixels of different colors. A pixel in memory can be stored as you like, either an array of 3 elements, or in a structure where red, gree,blue; or something else. An image consisting of an array of pixels that we just parse, I will continue to call the surface. It turns out that since everything that is displayed on the screen is stored in an array of pixels, then changing elements (pixels) in this array - we will pixel-by-pixel change the image on the screen. This is exactly what we will do in this article.There is no pixel drawing function in canvas, but it is possible to access a one-dimensional array of pixels, which we discussed above. How to do this is shown in the example below (this and all examples in the future will only be inside the script element):
const ctx = document
.getElementById('surface')
.getContext('2d')
const imageData = ctx.createImageData(800, 600)
In the example, imageData is an object in which there are 3 properties:- height and width - integers storing the height and width of the window for drawing
- data - 8-bit unsigned integer array (you can store numbers in the range from 0 to 255 in it)
The data array has a simple but explanatory structure. This one-dimensional array stores data of each pixel, which we will display on the screen in the following format:The first 4 elements of the array (indices 0,1,2,3) are the data of the first pixel in the first row. The second 4 elements (indices 4, 5, 6, 7) are the data of the second pixel of the first row. When we get to the 800th pixel of the first line, provided that the window is 800 pixels wide - the 801th pixel will already belong to the second line. If we change it, on the screen we will see that the 1st pixel of the 2nd row has changed (although by the count in the array it will be the 801st pixel). Why is there 4 elements for each pixel in the array? This is because in canvas, in addition to allocating 1 element for each color - red, green, blue (these are 3 elements), 1 more element for transparency (they also say the alpha channel or opacity). Alpha channel, like color, is set in the range from 0 (transparent) to 255 (opaque). With this structure, we get a 32-bit image,because each pixel consists of 4 elements of 8 bits. To summarize: each pixel contains: red, green, blue colors and alpha channel (transparency). This color scheme is called ARGB (Alpha Red Green Blue). And the fact that each pixel occupies 32 bits says that we have a 32 bit image (they also say an image with a color depth of 32 bits).By default, the entire array of pixels imageData.data (data is a property in which the array of pixels, and imageData is just an object) is filled with the values 0, and if we tried to output such an array, we would not see anything interesting on the screen, because 0 , 0, 0 is black, but since the transparency here will also be 0, and this is a completely transparent color, we won’t even see black on the screen!It is inconvenient to work directly with such a one-dimensional array, so we will write a class for it in which we will create methods for drawing. I will name the class - Drawer. This class will store only the necessary data and carry out the necessary calculations, abstracting as much as possible from the tool used for rendering. That is why we will place all the calculations and work with the array in it. And the very call to the display method on canvas, we will place outside the class, because there might be something else instead of canvas. In this case, our class will not have to be changed. To work with an array of pixels (surface), it is more convenient for us to save it in the Drawer class, as well as the width and height of the image, so that we can correctly access the desired pixel. So, the Drawer class, while preserving the minimum data necessary for drawing, looks like this for me:class Drawer {
surface = null
width = 0
height = 0
constructor(surface, width, height) {
this.surface = surface
this.width = width
this.height = height
}
}
As you can see in the constructor, the Drawer class takes all the necessary data and saves it. Now you can create an instance of this class and pass an array of pixels, width and height into it (we already have all this data, because we created it above and stored it in imageData):const drawer = new Drawer(
imageData.data,
imageData.width,
imageData.height
)
In the Drawer class, we will write several drawing functions, for ease of work in the future. We will have a function for drawing a pixel, a function for drawing a line, and in further articles functions for drawing a triangle and other shapes will appear. But let's start with the pixel drawing method. I'll call him drawPixel. If we draw a pixel, then it should have coordinates, as well as color:drawPixel(x, y, r, g, b) { }
Please note that the drawPixel function does not accept the alpha parameter (transparency), and above we figured out that the pixel array consists of 3 color parameters and 1 transparency parameter. I didn’t specifically indicate transparency, since we absolutely do not need it for examples. By default, we will set 255 (i.e. everything will be opaque). Now let's think about how to write the desired color into an array of pixels in x, y coordinates. Since we have all the information about the image is stored in a one-dimensional array, in which 1 pixel (8 bits) is allocated for each pixel. To access the desired pixel in the array, we first need to determine the red location index, because any pixel begins with it (eg [r, g, b, a]). A little explanation of the structure of the array: The table in green indicates how color components are stored in a one-dimensional surface array. Their indices in the same array are indicated in blue, and the coordinates of the pixel that accepts the drawPixel functions, which we need to convert to indices in the one-dimensional array, indicate r, g, b, a for the pixel in blue. So, from the table it can be seen that for each pixel the red component of the color comes first, let's start with it. Suppose we want to change the red component of the pixel color in the coordinates X1Y1 with an image size of 2 by 2 pixels. In the table we see that this is index 12, but how to calculate it? First we find the index of the row we need, for this we multiply the image width by Y and by 4 (the number of values per pixel) - this will be:
width * y * 4
//  :
2 * 1 * 4 = 8
We see that the 2nd line begins with index 8. If we compare with the plate, the result converges.Now you need to add a column offset to the found row index to get the desired red index. To do this, add X times 4 to the row index. The full formula will be:width * y * 4 + x * 4
// :
(width * y + x) * 4
// :
(2 * 1 + 1) * 4 = 12
Now we compare 12 with the table and see that the pixel X1Y1 really starts with index 12.To find the indices of other color components, you need to add the color offset to the red index: +1 (green), +2 (blue), +3 (alpha) . Now we can implement the drawPixel method inside the Drawer class using the formula above:drawPixel(x, y, r, g, b) {
const offset = (this.width * y + x) * 4
this.surface[offset] = r
this.surface[offset + 1] = g
this.surface[offset + 2] = b
this.surface[offset + 3] = 255
}
In this drawPixel method, I rendered the repeating part of the formula to the offset constant. It is also seen that in alpha I just write 255, because it is in the structure, but now we do not need to output pixels.It is time to test the code and finally see the first pixel on the screen. Here is an example using the pixel render method:
drawer.drawPixel(10, 10, 255, 0, 0)
drawer.drawPixel(10, 20, 0, 0, 255)
ctx.putImageData(imageData, 0, 0)
In the example above, I draw 2 pixels, one red 255, 0, 0, the other blue 0, 0, 255. But the changes in the imageData.data array (it is also the surface inside the Drawer class) will not appear on the screen. To draw, you need to call ctx.putImageData (imageData, 0, 0), where imageData is the object in which the pixel array and width / height of the drawing area, and 0, 0 is the point relative to which the pixel array will be displayed (always leave 0, 0 ) If you did everything correctly, then you will have the following picture in the upper left of the canvas element in the browser window: Did you see the pixels? They are so small, and how much work has been done.Now let's try to add a bit of dynamics to the example, for example, so that every 10 milliseconds our pixel shifts to the right (we change X pixels by +1 every 10 milliseconds), we correct the pixel drawing code by one at an interval:
let x = 10
setInterval(() => {
drawer.drawPixel(x++, 20, 0, 0, 255)
ctx.putImageData(imageData, 0, 0)
}, 10)
In this example, I left only the output of the blue pixel and wrapped the setInterval function with the parameter 10 in JavaScript. This means that the code will be called approximately every 10 milliseconds. If you run such an example, you will see that instead of a pixel shifting to the right, you will have something like this: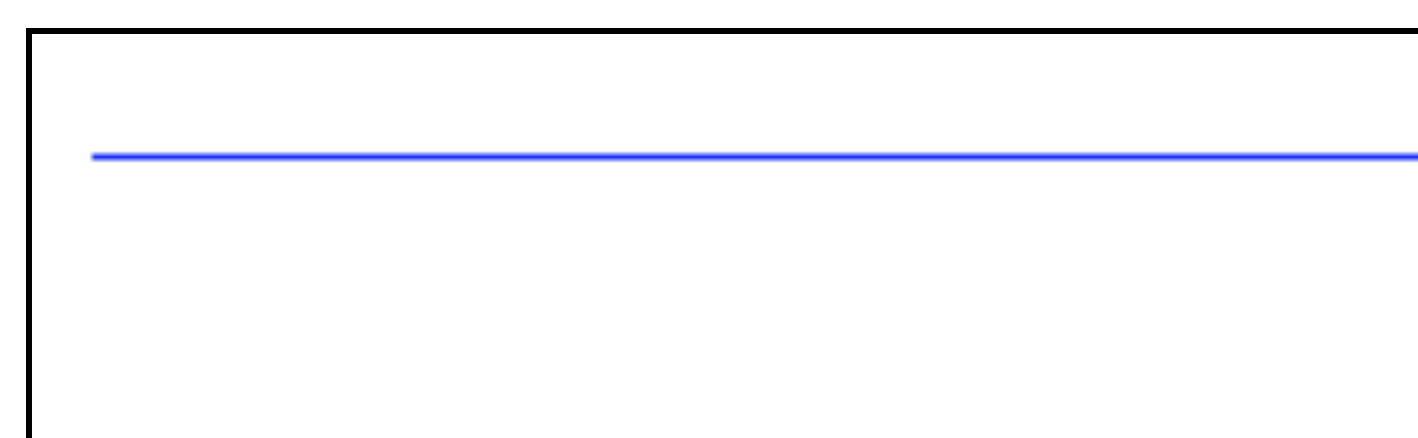 Such a long strip (or trace) remains because we do not clear the color of the previous pixel in the surface array, so with each invocation of the interval, we also add one pixel. Let's write a method that will clean the surface to its original state. In other words, fill the array with zeros. Add the clearSurface method to the Drawer class:
clearSurface() {
const surfaceSize = this.width * this.height * 4
for (let i = 0; i < surfaceSize; i++) {
this.surface[i] = 0
}
}
There are no logic in this array, just padding with zeros. It is recommended that you call this method each time before drawing a new image. In the case of pixel animation, before drawing this pixel:let x = 10
setInterval(() => {
drawer.clearSurface()
drawer.drawPixel(x++, 20, 0, 0, 255)
ctx.putImageData(imageData, 0, 0)
}, 10)
Now if you run this example, the pixel will shift to the right, one by one - without an unnecessary trace from previous coordinates.The last thing we implement in the first article is the line drawing method. Add it, of course, to the Drawer class. The method I will call drawLine. What will he take? Unlike a point, the line still has the coordinates at which it ends. In other words, the line has a beginning, end and color, which we will pass to the method:drawLine(x1, y1, x2, y2, r, g, b) { }
Any line consists of pixels, it remains only to correctly fill it with pixels from x1, y1 to x2, y2. To begin with, since the line consists of pixels, then we will output it pixel by pixel in the loop, but how to calculate how many pixels to output? For example, to draw a line from [0, 0] to [3, 0] it is intuitively clear that you need 4 pixels ([0, 0], [1, 0], [2, 0], [3, 0],) . But from [12, 6] to [43, 14], it is already not clear how long the line will be (how many pixels to display) and what coordinates they will have. To do this, recall a little geometry. So, we have a line that starts at x1, y1 and ends at x2, y2.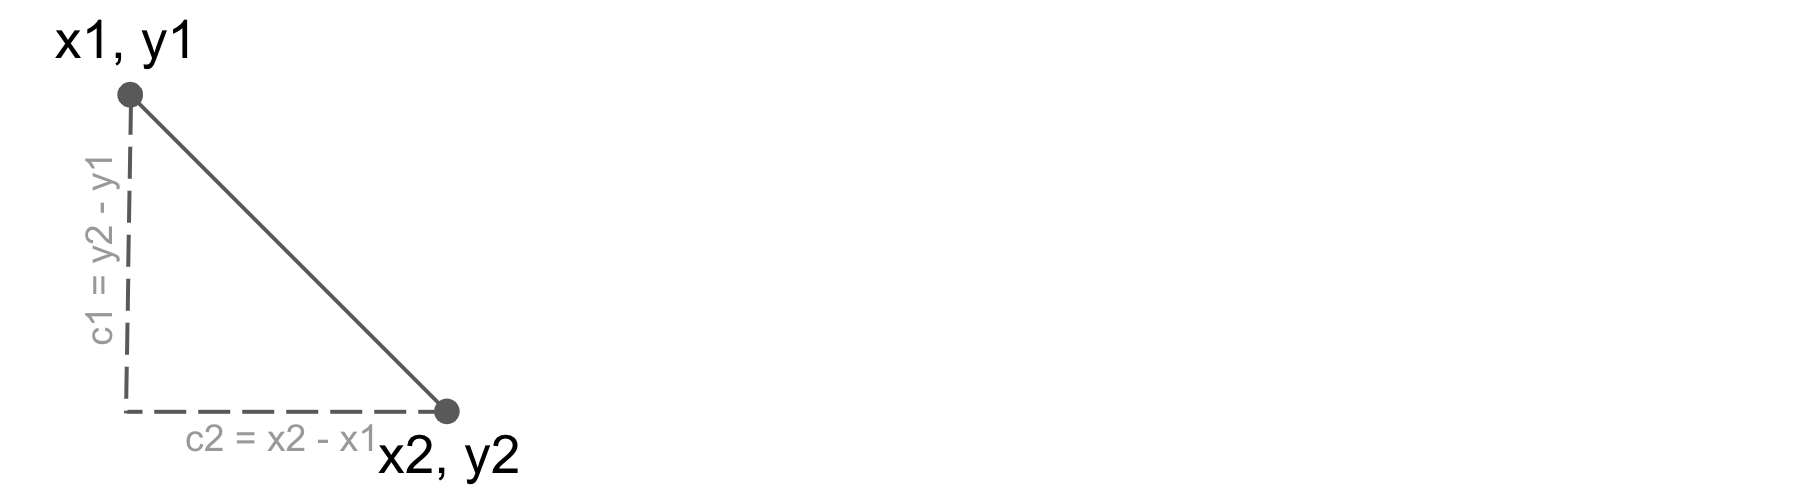 Let's draw a dotted line from the beginning and the end so that we get a triangle (picture above). We will see that at the junction of the drawn lines an angle of 90 degrees has formed. If the triangle has such an angle, then the triangle is called rectangular, and its sides, between which the angle is 90 degrees, are called legs. The third solid line (which we are trying to draw) is called hypotenuse in a triangle. Using these two introduced legs (c1 and c2 in the figure), we can calculate the length of the hypotenuse using the Pythagorean theorem. Let's see how to do it. The formula for the length of the hypotenuse (or line length) will be as follows:
How to get both legs is also seen from the triangle. Now, using the formula above, we find the hypotenuse, which will be the long line (the number of pixels): drawLine(x1, y1, x2, y2, r, g, b) {
const c1 = y2 - y1
const c2 = x2 - x1
const length = Math.sqrt(c1 * c1 + c2 * c2)
We already know how many pixels to draw to draw a line. But we do not yet know how pixels are shifted. That is, we need to draw a line from x1, y1 to x2, y2, we know that the line length will be, for example, 20 pixels. We can draw the 1st pixel in x1, y1 and the last in x2, y2, but how to find the coordinates of the intermediate pixels? To do this, we need to get how to shift each next pixel with respect to x1, y1 to get the desired line. I will give one more example in order to better understand what kind of displacement we are talking about. We have points [0, 0] and [0, 3], we need to draw a line on them. From the example it is clearly seen that the next point after [0, 0] will be [0, 1], and then [0, 2] and finally [0, 3]. That is, X of each point was not shifted, well, or we can say that it was shifted by 0 pixels, and Y was shifted by 1 pixel, this is the offset,it can be written as [0, 1]. Another example: we have a point [0, 0] and a point [3, 6], let's try to calculate in our mind how they shift, the first will be [0, 0], then [0.5, 1], then [1, 2] then [1.5, 3] and so on to [3, 6], in this example the offset will be [0.5, 1]. How to calculate it? You can use the following formula: = 2 /
Y = 1 /
In the program code, we will have this:const xStep = c2 / length
const yStep = c1 / length
All the data is already there: the length of the line, the offset of the pixels along X and Y. We start in the cycle to draw:for (let i = 0; i < length; i++) {
this.drawPixel(
Math.trunc(x1 + xStep * i),
Math.trunc(y1 + yStep * i),
r, g, b,
)
}
As the X coordinate of the Pixel function, we pass the beginning of the X line + offset X * i, thus, getting the coordinate of the i-th pixel, we also calculate the Y coordinate. Math.trunc is a method in JS that allows you to discard the fractional part of a number. The whole method code looks like this:drawLine(x1, y1, x2, y2, r, g, b) {
const c1 = y2 - y1
const c2 = x2 - x1
const length = Math.sqrt(c1 * c1 + c2 * c2)
const xStep = c2 / length
const yStep = c1 / length
for (let i = 0; i < length; i++) {
this.drawPixel(
Math.trunc(x1 + xStep * i),
Math.trunc(y1 + yStep * i),
r, g, b,
)
}
}
The first part has come to an end, a long but exciting path to comprehending the 3D world. There was nothing three-dimensional yet, but we performed preparatory operations for drawing: we implemented the functions of drawing a pixel, a line, clearing a window and learned a few terms. All code of the Drawer class can be viewed under the spoiler:Drawer class codeclass Drawer {
surface = null
width = 0
height = 0
constructor(surface, width, height) {
this.surface = surface
this.width = width
this.height = height
}
drawPixel(x, y, r, g, b) {
    const offset = (this.width * y + x) * 4

    this.surface[offset] = r
    this.surface[offset + 1] = g
    this.surface[offset + 2] = b
    this.surface[offset + 3] = 255
}
drawLine(x1, y1, x2, y2, r, g, b) {
const c1 = y2 - y1
const c2 = x2 - x1
const length = Math.sqrt(c1 * c1 + c2 * c2)
const xStep = c2 / length
const yStep = c1 / length
for (let i = 0 ; i < length ; i++) {
this.drawPixel(
Math.trunc(x1 + xStep * i),
Math.trunc(y1 + yStep * i),
r, g, b,
)
}
}
clearSurface() {
    const surfaceSize = this.width * this.height * 4
    for (let i = 0; i < surfaceSize; i++) {
        this.surface[i] = 0
    }
}
}
What's next?
In the next article, we will look at how such a simple operation as the output of a pixel and a line can turn into interesting 3D objects. We will get acquainted with matrices and operations on them, display a three-dimensional object in a window and even add animation.