Flant has a number of Open Source developments, primarily for Kubernetes, and loghouse is one of the most popular. This is our central logging tool in K8s, which was introduced more than 2 years ago. As we mentioned in a recent article about the logs , it required refinement, and its relevance only grew over time. Today we are pleased to introduce a new version of loghouse - v0.3.0 . Details about her - under the cut.
disadvantages
We have been using loghouse in many Kubernetes clusters all this time, and in general, this solution suits both ourselves and the various clients to whom we also provide access.Its main advantages are its simple and intuitive interface, the ability to execute SQL queries, good compression and low resource consumption when inserting data into the database, as well as low overhead during storage.The most painful problems in loghouse during operation:- use of partition tables joined by a merge table;
- lack of a buffer that would smooth out bursts of logs;
- Outdated and potentially vulnerable web panel gem
- outdated fluentd ( loghouse-fluentd: latest did not start due to a problematic gemset).
In addition, a significant number of issues have accumulated on GitHub , which I would also like to solve.Major changes in loghouse 0.3.0
In fact, we have accumulated enough changes, but we will highlight the most important ones. They can be divided into 3 main groups:- improving log storage and database schema;
- improved log collection;
- the appearance of monitoring.
1. Improvements in log storage and database design
Key innovations:- Log storage schemes have changed, the transition to work with a single table and the rejection of partition tables has been completed .
- The base cleaning mechanism built into ClickHouse of the latest versions has begun to be applied .
- Now you can use an external ClickHouse installation , even in cluster mode.
Compare the performance of the old and new circuits in a real project. Here is an example of searching for unique URLs in the application logs of the popular online resource dtf.ru :SELECT
string_fields.values[indexOf(string_fields.names, 'path')] AS path,
count(*) AS count
FROM logs
WHERE (namespace = 'kube-nginx-ingress') AND ((string_fields.values[indexOf(string_fields.names, 'vhost')]) LIKE '%foobar.baz%') AND (date = '2020-02-29')
GROUP BY string_fields.values[indexOf(string_fields.names, 'path')]
ORDER BY count DESC
LIMIT 20
Selection takes place over tens of millions of records. The old scheme worked out in 20 seconds: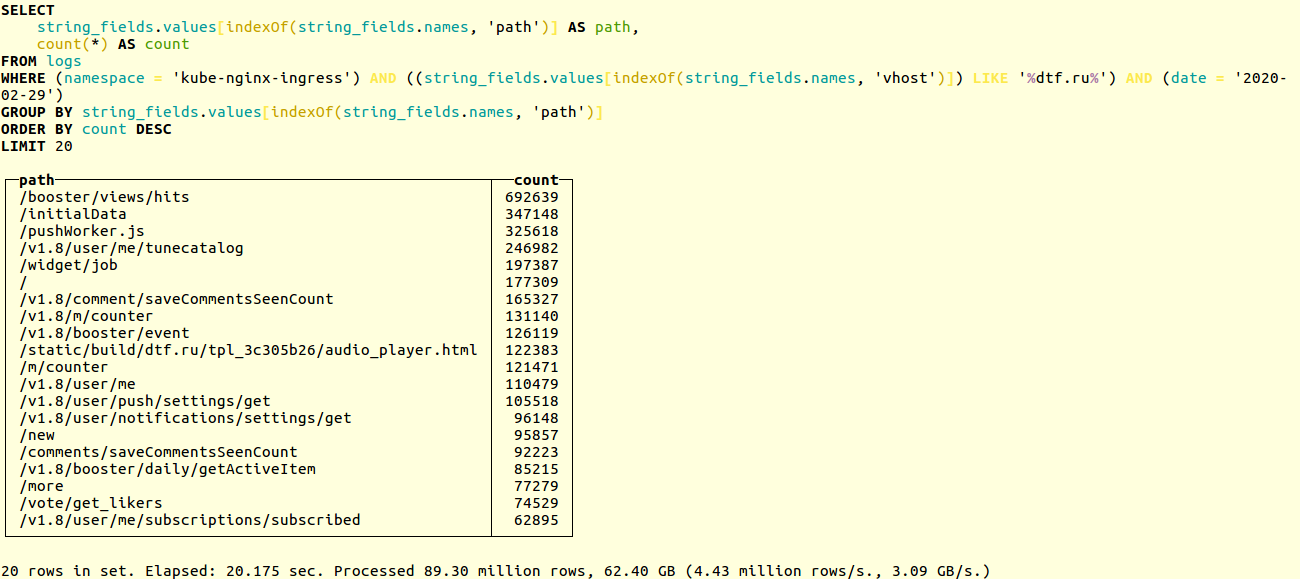 New - in 14:
 If you use our Helm-chart , then when updating the loghouse the database will be automatically migrated to the new format. Otherwise, you will have to do the migration manually. The process is described in the documentation . In short, just run:
DO_DB_DEPLOY=true rake create_logs_tables
In addition, we started using TTL for ClickHouse tables . This allows you to automatically delete data from the database that is older than the specified time interval:CREATE TABLE logs
(
....
)
ENGINE = MergeTree()
PARTITION BY (date)
ORDER BY (timestamp, nsec, namespace, container_name)
TTL date + toIntervalDay(14)
SETTINGS index_granularity = 32768;
Examples of database schemas and configs for ClickHouse, including an example of working with the CH cluster, can be found in the documentation .Improved log collection
Key innovations:- A buffer has been added that is designed to smooth out bursts when a large number of logs appear.
- Implemented the ability to send logs to the loghouse directly from the application: over TCP and UDP, in JSON format.
The loghouse battery in loghouse is a new table logs_bufferadded to the database schema. This table is in-memory, i.e. stored in RAM (has a special type of Buffer ); it is she who should smooth the load on the base. Thanks for the tip on adding it.Sovigod!The implemented sending logs directly to loghouse from the application allows you to do this even through netcat:echo '{"log": {"level": "info", "msg": "hello world"}}' | nc fluentd.loghouse 5170
These logs can be viewed in the namespace where loghouse is installed in the stream net: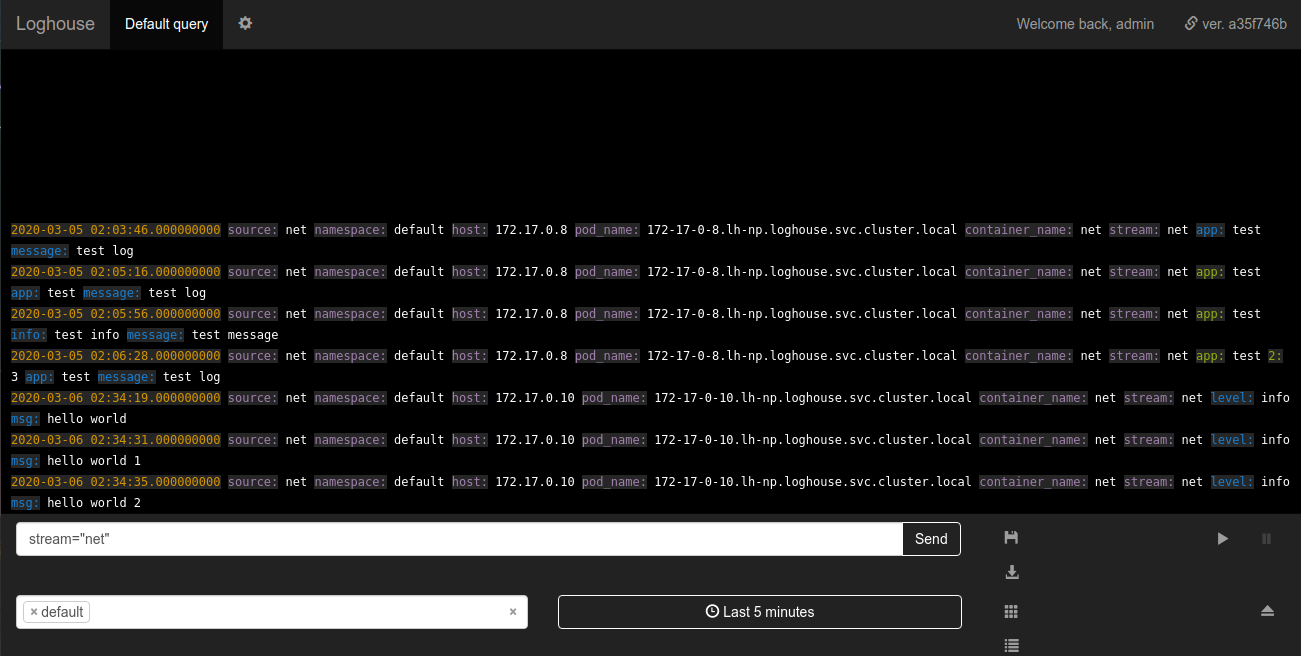 Requirements for the data to be sent are minimal: the message must be a valid JSON with a field
 log. The field log, in turn, can be either a string or nested JSON.Monitoring Logging Subsystem
An important improvement was the monitoring of fluentd through Prometheus. Now the loghouse comes with a panel for Grafana, which displays all the basic metrics, such as:- number of fluentd workers;
- number of events sent to ClickHouse;
- free buffer size in percent.
The panel code for Grafana can be seen in the documentation .The panel for ClickHouse is made on the basis of a ready-made product - from f1yegor , for which many thanks to the author.As you can see, the panel displays the number of connections to ClickHouse, the use of the buffer, the activity of background tasks and the number of merges. This is enough to understand the state of the system: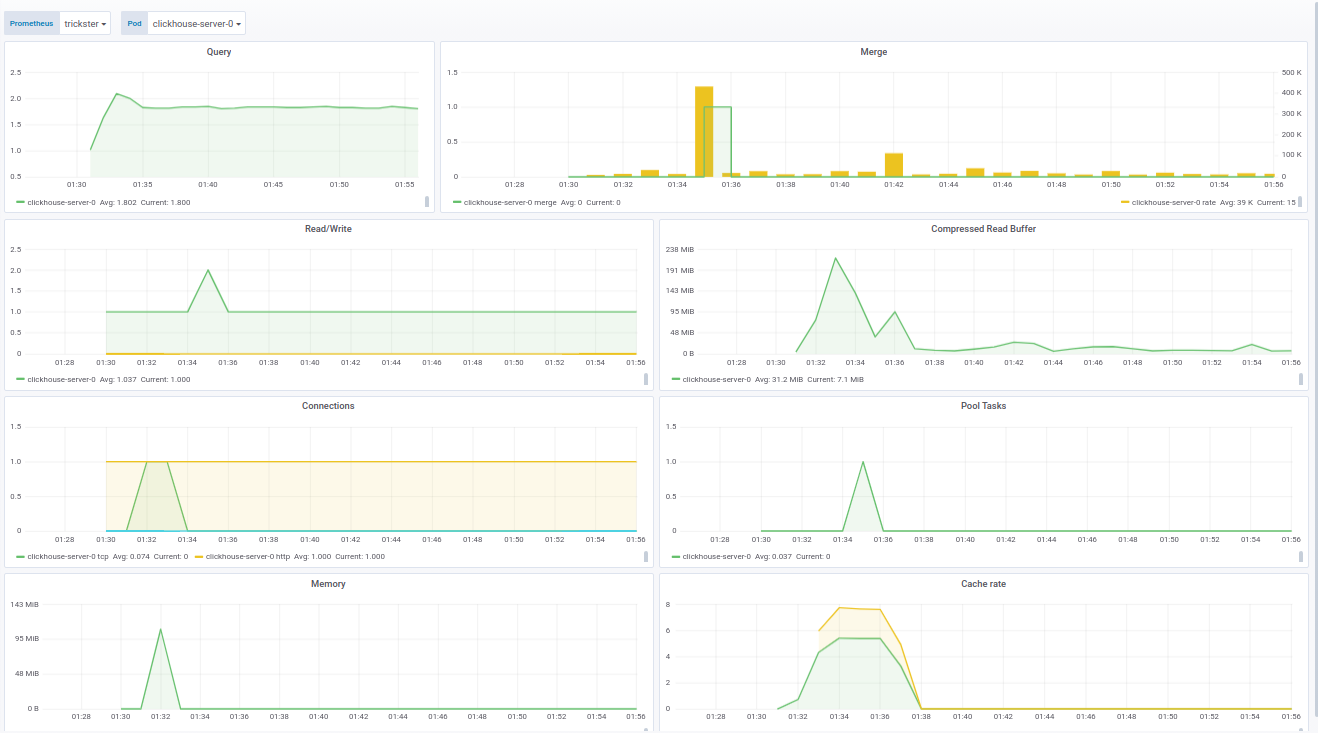 The panel for fluentd shows the active instances of fluentd. This is especially critical for those who do not want / cannot lose logs at all:
 In addition to the status of pods, the panel shows the load on the queue for sending logs to ClickHouse. In turn, you can understand if ClickHouse is handling the load or not. In cases where the log cannot be lost, this parameter also becomes critical.Examples of panels are sharpened for our supply of Prometheus Operator, however, they are easily modified through the variables in the settings.Finally, as part of the loghouse monitoring work, we put together an up-to-date Docker image with clickhouse_exporter 0.1.0 released by Percona Labs, as the author of the original clickhouse_exporter abandoned his repository.
Future plans
- Make it possible to deploy a ClickHouse cluster in Kubernetes.
- Make work with the selection of logs asynchronous and remove it from the Ruby part of the backend.
- Ruby- , .
- , Go.
- .
It's nice to see that the loghouse project found its audience, not only winning stars in GitHub (600+), but also encouraging real users to talk about their successes and problems.Having created loghouse more than 2 years ago, we were not sure of its prospects, expecting that the market and / or the Open Source community would offer the best solutions. However, today we see that this is a viable path, which we ourselves still choose and use on the many serviced Kubernetes clusters.We are looking forward to any assistance in improving and developing the loghouse. If you are missing something in the loghouse - write in the comments. Also, of course, we will be happy to be active on GitHub .PS
Read also in our blog: