The canary is a small bird that constantly sings. These birds are sensitive to methane and carbon monoxide. Even from a small concentration of excess gases in the air, they lose consciousness or die. Gold miners and miners took birds for prey: while the canaries sing, you can work, if you shut up, there is gas in the mine and it's time to leave. Miners sacrificed a small bird to get out of the mines alive. A similar practice has found itself in IT. For example, in the standard task of deploying a new version of a service or application to production with testing before that. The test environment can be too expensive, automated tests do not cover everything that we would like, and it’s risky to test and sacrifice quality. Just in such cases, the Canary Deployment approach helps, when a bit of real production traffic is launched on a new version. The approach helps to safely test the new version for production, sacrificing small things for a big purpose. In more detail, how the approach works, what is useful and how to implement it, will tell Andrey Markelov (Andrey_V_Markelov), using an example of implementation at Infobip.Andrey Markelov , a leading software engineer at Infobip, has been developing Java applications in finance and telecommunications for 11 years. He develops Open Source products, actively participates in the Atlassian Community and writes plugins for Atlassian products. Evangelist Prometheus, Docker, and Redis.
About Infobip
This is a global telecommunications platform that allows banks, retailers, online stores and transport companies to send messages to their customers using SMS, push, letters and voice messages. In such a business, stability and reliability are important so that customers receive messages on time.Infobip IT Infrastructure in numbers:- 15 data centers around the world;
- 500 unique services in operation;
- 2500 instances of services, which is much more than teams;
- 4.5 TB of monthly traffic;
- 4.5 billion phone numbers;
The business is growing, and with it the number of releases. We carry out 60 releases a day , because customers want more features and capabilities. But this is difficult - there are many services, but few teams. You have to quickly write code that should work in production without errors.Releases
A typical release with us goes like this. For example, there are services A, B, C, D and E, each of them is developed by a separate team.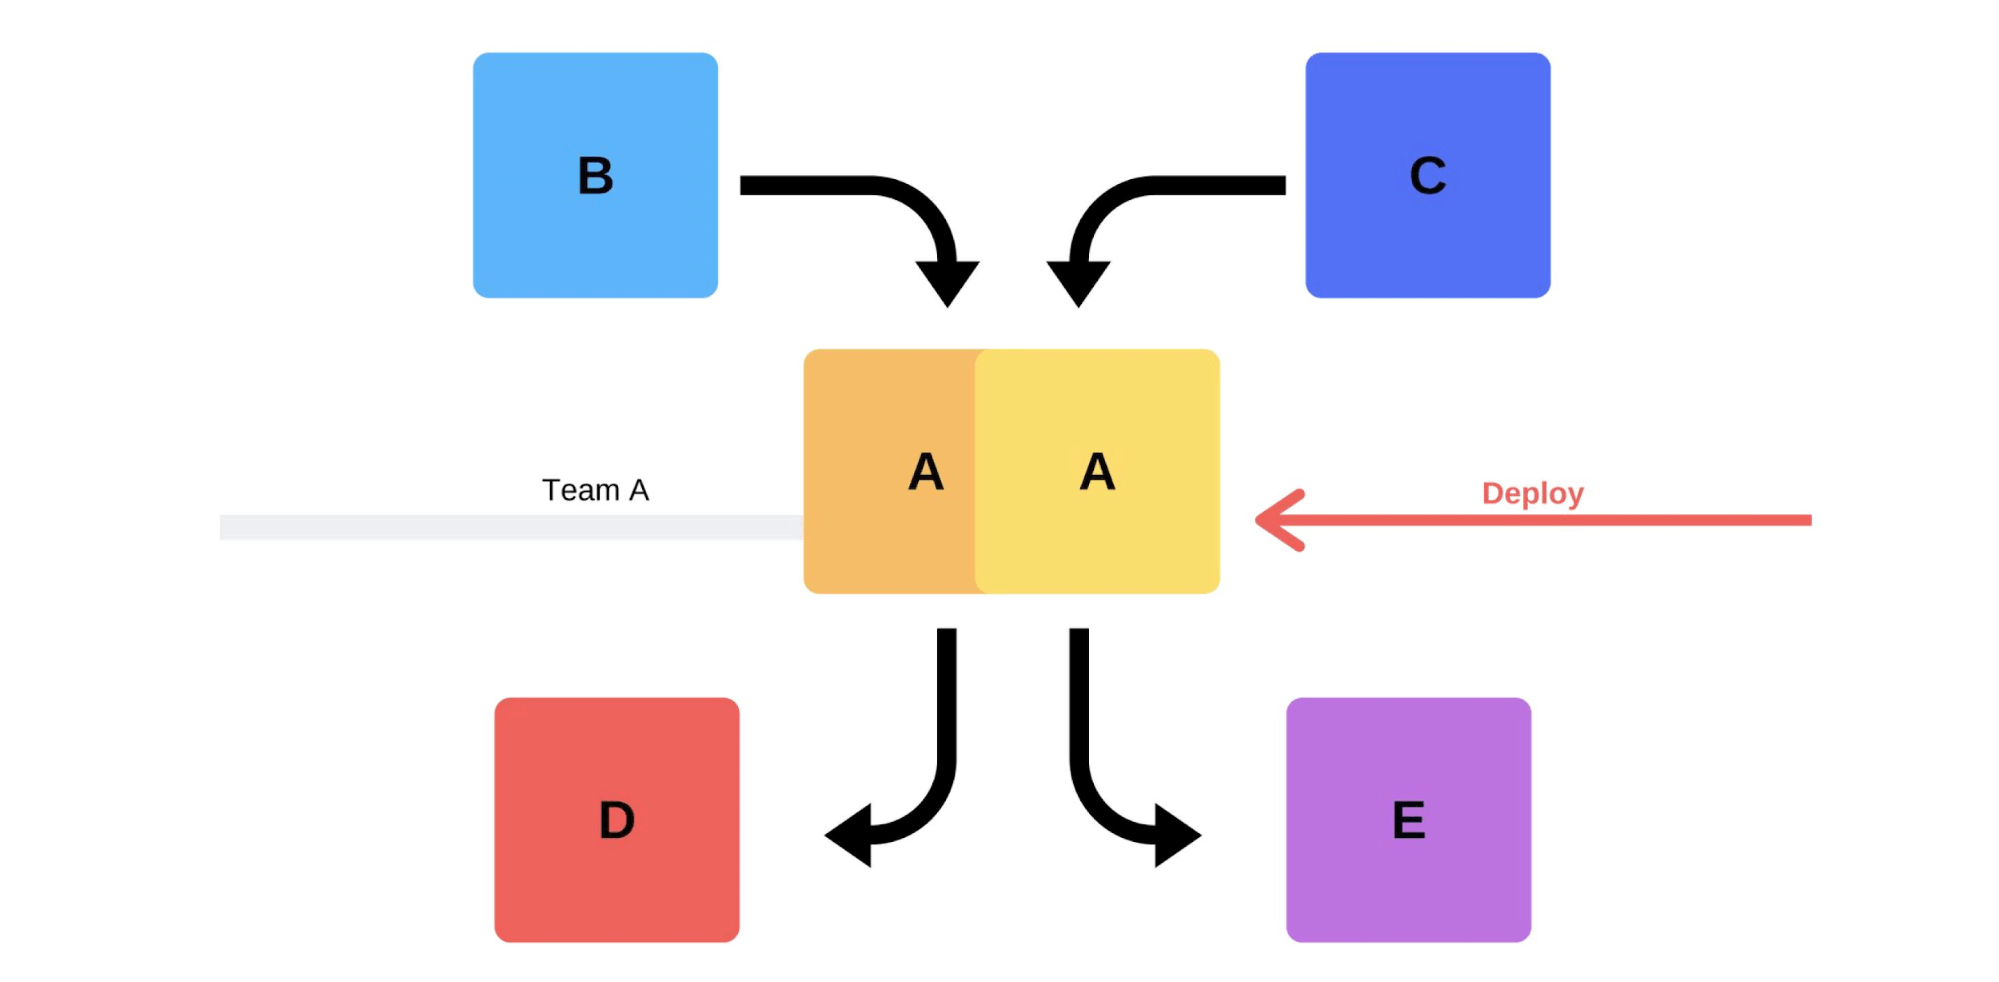 At some point, service team A decides to deploy a new version, but service teams B, C, D, and E are unaware of this. There are two options for how service team A arrives.Will carry out an incremental release: first it will replace one version, and then the second.
 But there is a second option: the team will find additional capacities and machines , deploy a new version, and then switch the router, and the version will start working on production.
 In any case, there will almost always be problems after the deployment, even if the version is tested. You can test it with your hands, it can be automated, you can not test it - problems will arise in any case. The easiest and most correct way to solve them is to roll back to the working version. Only then can you deal with the damage, with the causes and correct them.So what do we want?We don’t need problems. If customers find them faster than us, it will hit our reputation. Therefore, we must find problems faster than customers . By being proactive, we minimize damage.At the same time, we want to accelerate the deploymentso that this happens quickly, easily, by itself and without stress from the team. Engineers, DevOps engineers and programmers must be protected - the release of the new version is stressful. A team is not a consumable; we strive to rationally use human resources .
Deployment Issues
Client traffic is unpredictable . It is impossible to predict when client traffic will be minimal. We don’t know where and when clients will start their campaigns - maybe tonight in India, and tomorrow in Hong Kong. Given the large time difference, a deployment even at 2 a.m. does not guarantee that customers will not suffer.Provider issues . Messengers and providers are our partners. Sometimes they have crashes that cause errors during the deployment of new versions.Distributed teams . The teams that develop the client side and the backend are in different time zones. Because of this, they often cannot agree among themselves.Data centers cannot be repeated on stage. There are 200 racks in one data center - to repeat this in the sandbox will not even work out approximately.Downtimes are not allowed! We have an acceptable level of accessibility (Error Budget) when we work 99.99% of the time, for example, and the remaining percentages are “the right to make mistakes”. It is impossible to achieve 100% reliability, but it is important to constantly monitor downtime and downtime.Classic solutions
Write code without bugs . When I was a young developer, managers approached me with a request to release without bugs, but this is not always possible.Write tests . Tests work, but sometimes it’s not at all what the business wants. Making money is not a test task.Test on stage . Over the 3.5 years of my work at Infobip, I have never seen a stage state at least partially coincide with production. We even tried to develop this idea: first we had a stage, then pre-production, and then pre-production pre-production. But this did not help either - they did not even coincide in terms of power. With stage we can guarantee basic functionality, but we don’t know how it will work under loads.The release is made by the developer.This is good practice: even if someone changes the name of a comment, it immediately adds it to production. This helps to develop responsibility and not to forget about the changes made.There are additional difficulties too. For a developer, this is stressful - spend a lot of time to manually check everything.Agreed Releases . This option usually offers management: "Let's agree that you will test and add new versions every day." This does not work: there is always a team that waits for everyone else or vice versa.
Smoke tests
Another way to solve our deployment problems. Let's see how smoke tests work in the previous example, when team A wants to deploy a new version.First, the team deploys one instance to production. Messages to the instance from mocks simulate real traffic so that it matches normal daily traffic. If all is well, the team switches the new version to user traffic.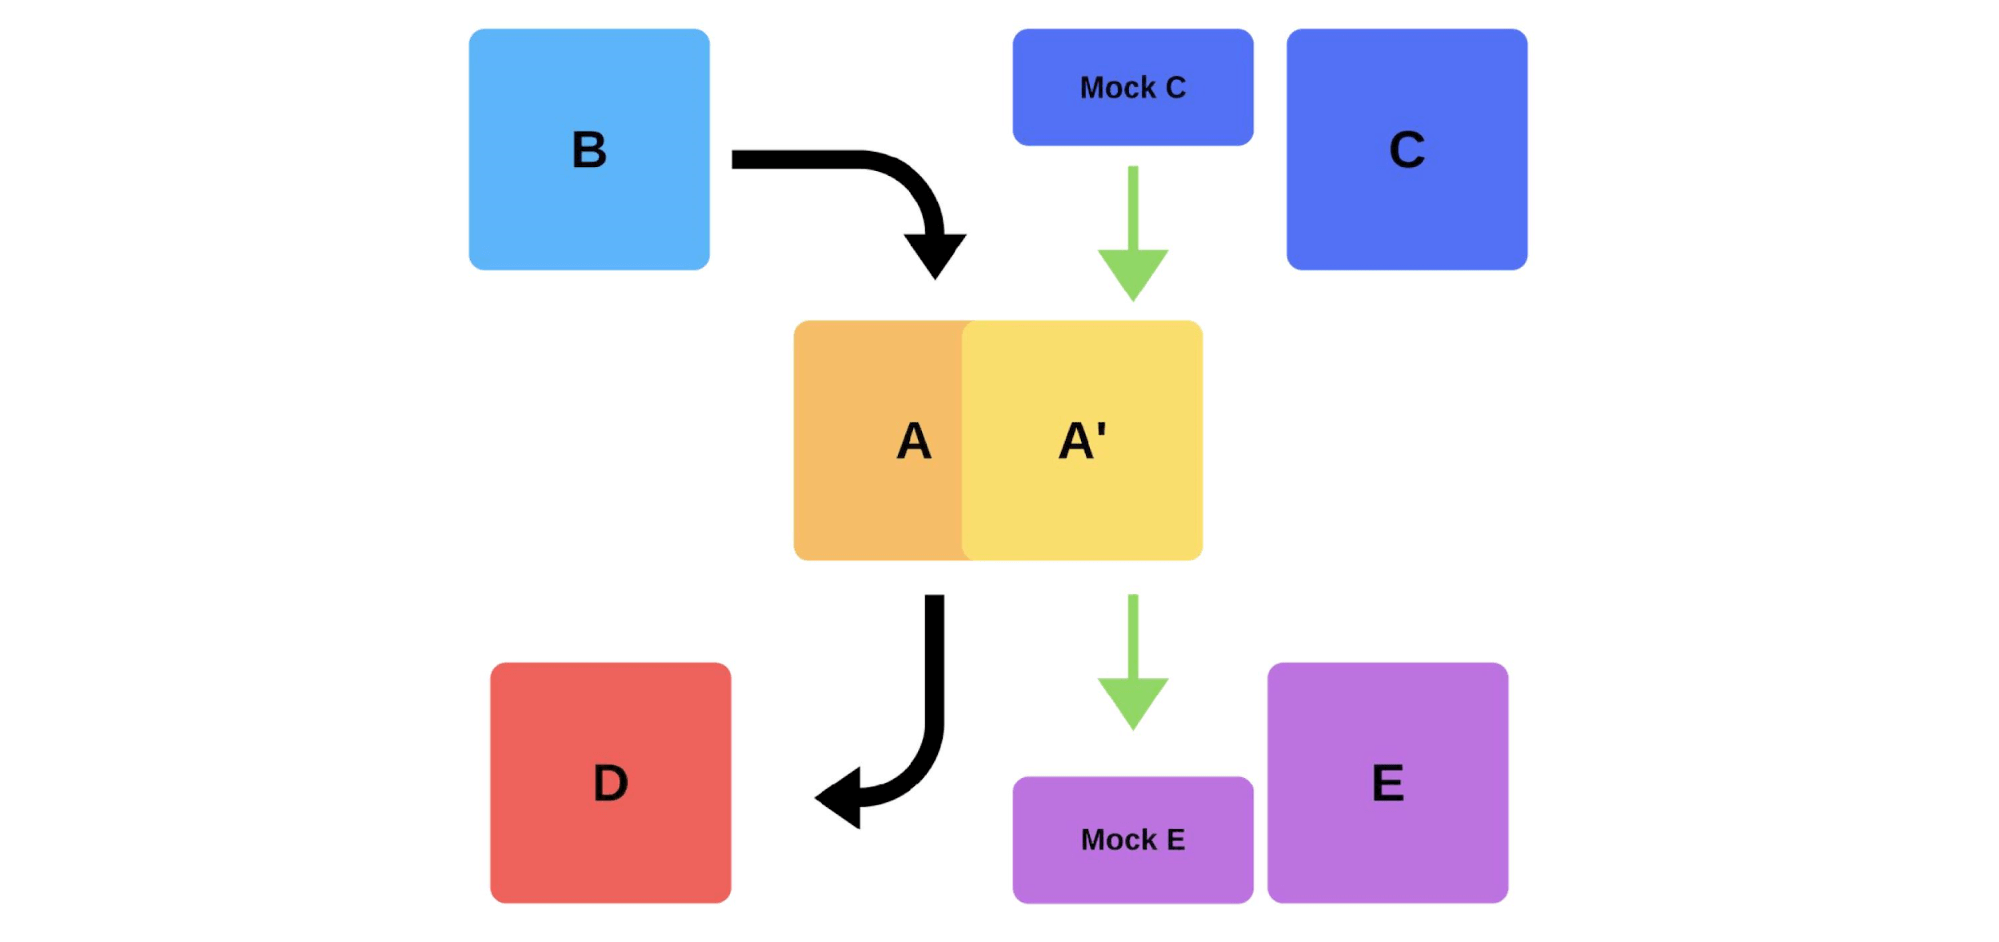 The second option is to deploy with additional iron. The team tests it for production, then switches it, and everything works.
 Disadvantages of smoke tests:
- Tests cannot be trusted. Where to get the same traffic as for production? You can use yesterday or a week ago, but it does not always coincide with the current one.
- It’s hard to maintain. You will have to support test accounts, constantly reset them before each deployment, when active records are sent to the repository. This is harder than writing a test in your sandbox.
The only bonus here is that you can check the performance .Canary releases
Due to the flaws of smoke tests, we started using canary releases.A practice similar to the way miners used canaries to indicate gas levels found themselves in IT. We are launching a bit of real production traffic to the new version , while trying to meet the Service Level Agreement (SLA). SLA is our “right to make mistakes”, which we can use once a year (or for some other period of time). If all goes well, add more traffic. If not, we will return the previous versions.
Implementation and nuances
How did we implement canary releases? For example, a group of customers sends messages through our service.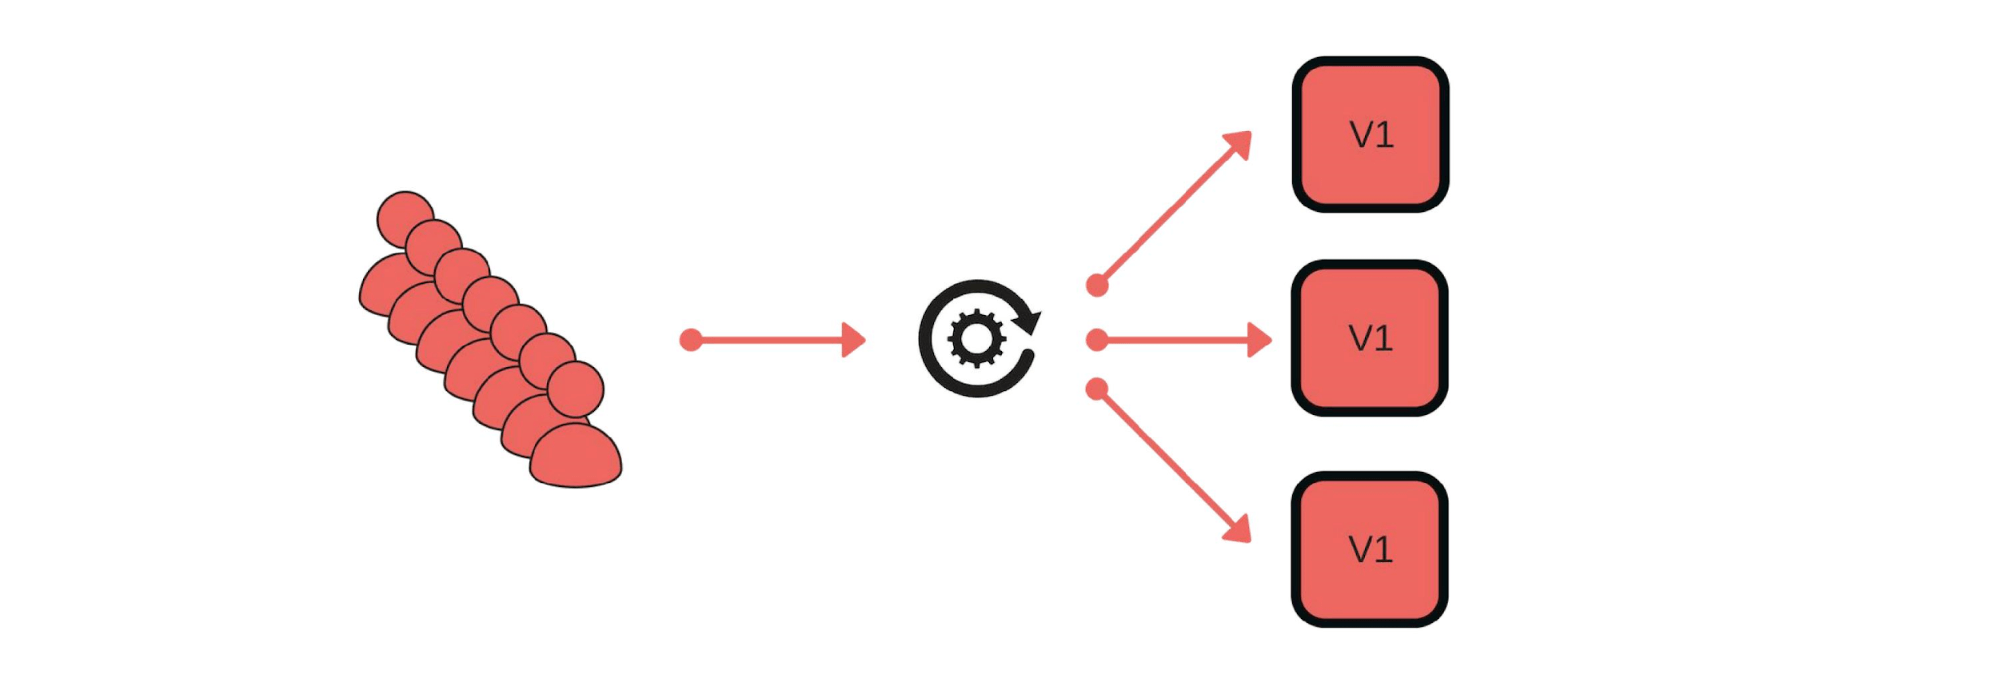 The deployment goes like this: remove one node from under the balancer (1), change the version (2) and separately start up some traffic (3).
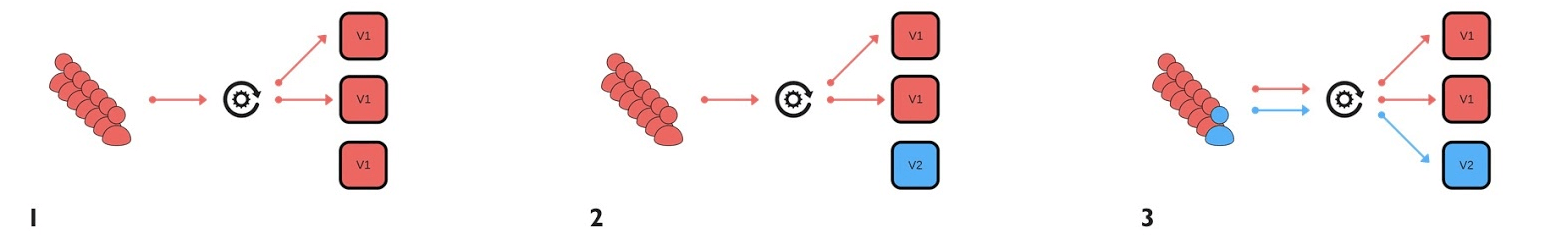 In general, everyone in the group will be happy, even if one user is not happy. If all is well - change all versions.
 I will show schematically how it looks for microservices in most cases.There is Service Discovery and two more services: S1N1 and S2. The first service (S1N1) notifies Service Discovery when it starts, and Service Discovery remembers it. The second service with two nodes (S2N1 and S2N2) also notifies Service Discovery at startup.
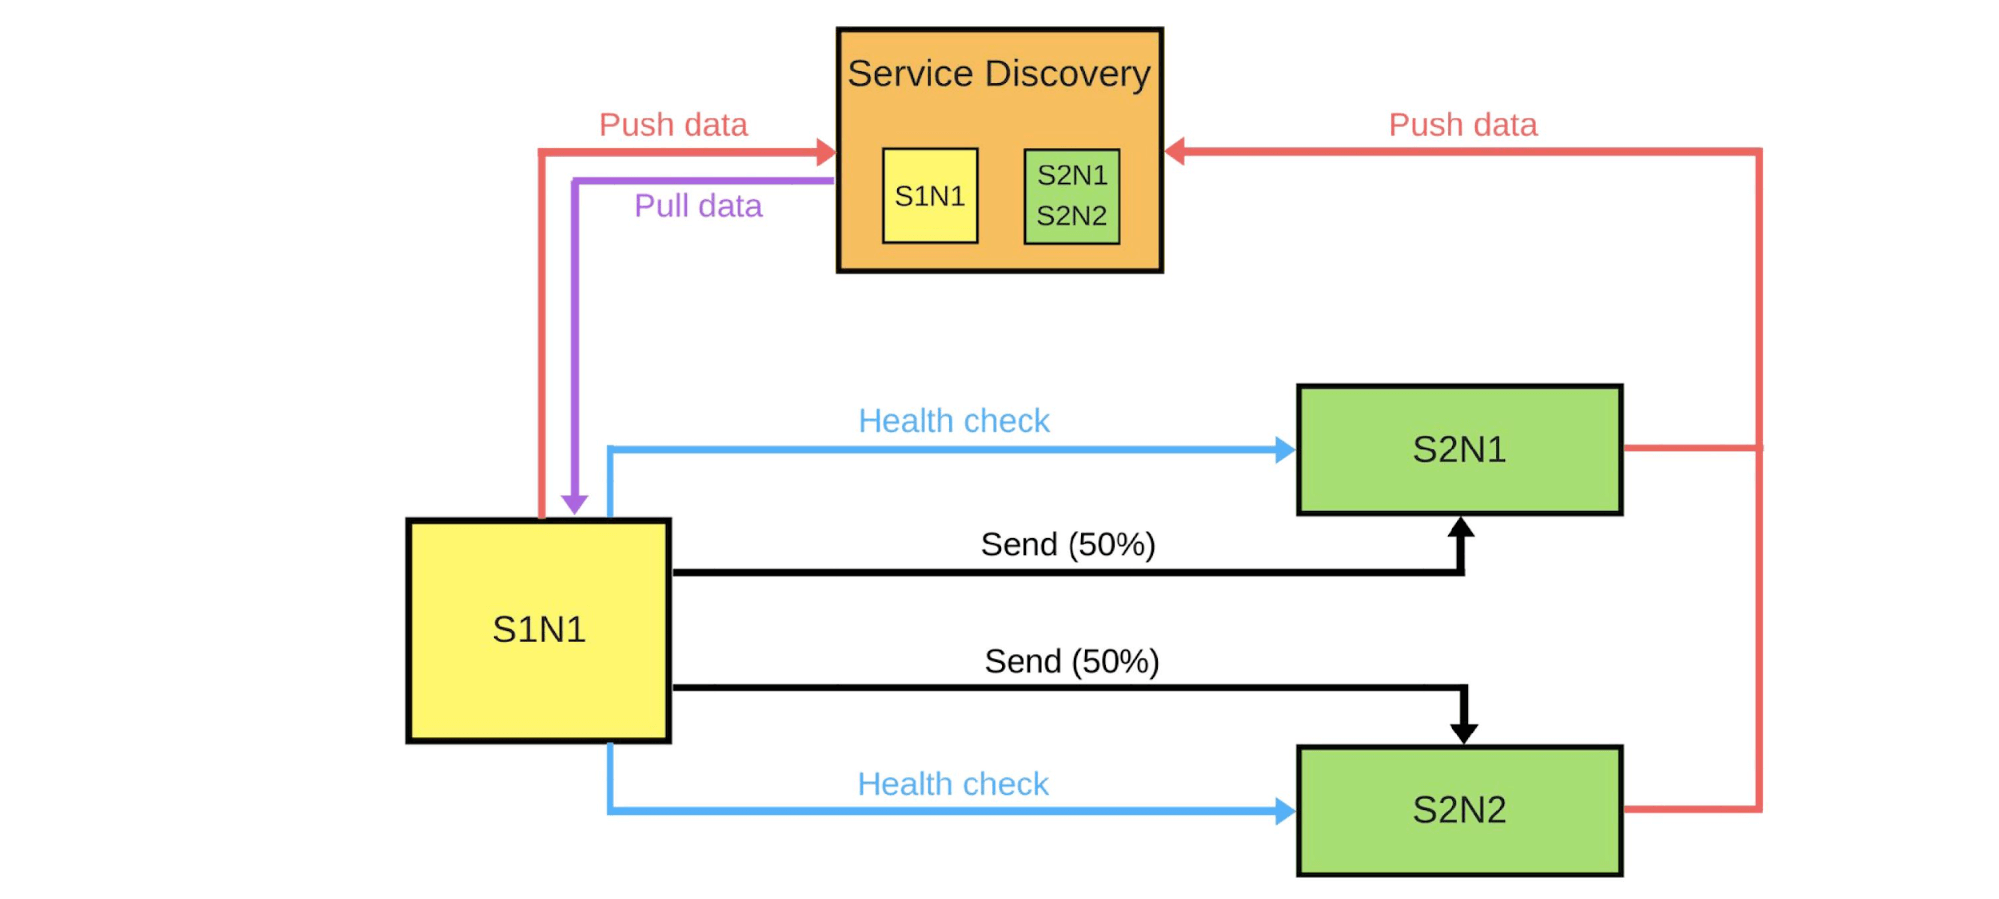 The second service for the first works as a server. The first one requests information about its servers from Service Discovery, and when it receives it, it searches for and checks them (“health check”). When he checks, he will send them messages.When someone wants to deploy a new version of the second service, he tells Service Discovery that the second node will be a canary node: less traffic will be sent to it, because it will be deployed now. We remove the canary node from under the balancer and the first service does not send traffic to it.
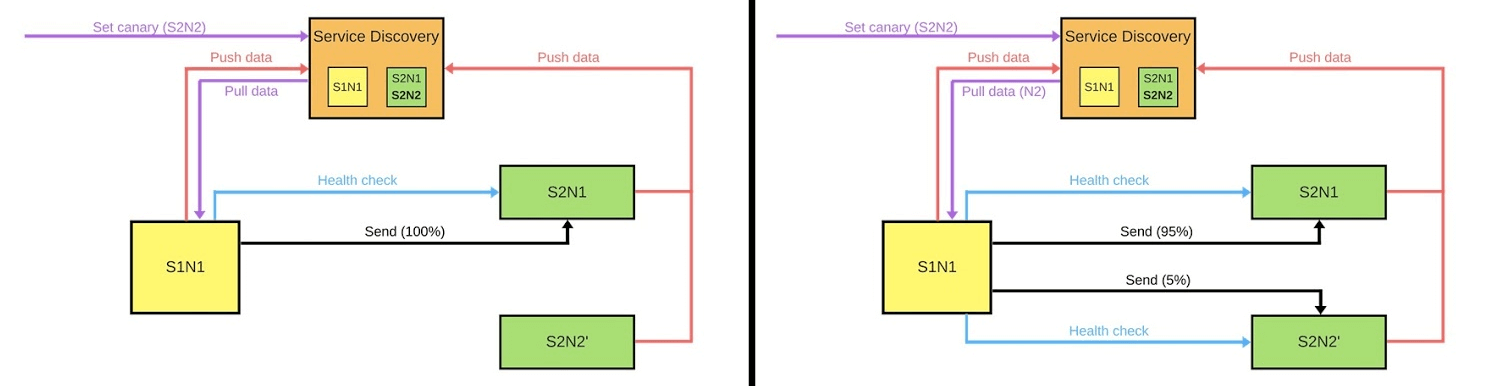 We change the version and Service Discovery knows that the second node is now canary - you can give it less load (5%). If all is well, change the version, return the load and work on.To implement all this, we need:
- balancing;
- , , , ;
- , , ;
- — (deployment pipeline).
 This is the first thing we should think about. There are two balancing strategies.The simplest option is when one node is always canary . This node always gets less traffic and we start deploying from it. In case of problems, we will compare her work to the deployment and during it. For example, if there are 2 times more errors, then the damage has increased 2 times.The Canary node is set during the deployment process . When the deployment ends and we remove the status of the canary node from it, the traffic balance will be restored. With fewer cars, we get an honest distribution.
Monitoring
The cornerstone of canary releases. We must understand exactly why we are doing this and what metrics we want to collect.Examples of metrics that we collect from our services.- , . , . , .
- (latency). , .
- (throughput).
- .
- 95% .
- -: . , , .
Examples of metrics in most popular monitoring systems.Counter This is some increasing value, for example, the number of errors. It’s easy to interpolate this metric and study the chart: yesterday there were 2 errors, and today 500, then something went wrong.The number of errors per minute or per second is the most important indicator that can be calculated using Counter. These data give a clear idea of the system's operation at a distance. Let's look at an example of a graph of the number of errors per second for two versions of a production system. There were few errors in the first version; audit may not have worked. In the second version, everything is much worse. We can say for sure that there are problems, so we must roll back this version.Gauge.Metrics are similar to Counter, but we record values that can either increase or decrease. For example, query execution time or queue size.The graph shows an example of response time (latency). The graph shows that the versions are similar, you can work with them. But if you look closely, it is noticeable how the quantity changes. If the execution time of requests increases when users are added, then it is immediately clear that there are problems - this was not the case before.
 Summary One of the most important indicators for business is percentiles. The metric shows that in 95% of cases, our system works the way we want. We can accept it if there is a problem somewhere, because we understand the general tendency of how good or bad everything is.
Tools
ELK Stack . You can implement canary using Elasticsearch - we write errors into it when events occur. Simply call the API, you can get errors at any time, and compare it with previous segments: GET /applg/_cunt?q=level:errr.Prometheus. He showed himself well in Infobip. It allows you to implement multidimensional metrics because labels are used.We can use level, instance, service, to combine them in a single system. Using offsetit, you can see, for example, the value of a week ago with just one command GET /api/v1/query?query={query}, where {query}:rate(logback_appender_total{
level="error",
instance=~"$instance"
}[5m] offset $offset_value)
Version Analysis
There are several versioning strategies.See metrics of only canary nodes. One of the simplest options: deployed a new version and study only the work. But if the engineer at this time begins to study the logs, constantly nervously reloading the pages, then this solution is no different from the rest.A canary node is compared to any other node . This is a comparison with other instances that run on full traffic. For example, if with small traffic things are worse, or not better than on real instances, then something is wrong.A canary node is compared to itself in the past. The nodes allocated for canary can be compared with historical data. For example, if a week ago everything was fine, then we can focus on this data in order to understand the current situation.Automation
We want to free engineers from manual comparisons, so it’s important to implement automation. The deployment pipeline process usually looks like this:- we start;
- remove the node from under the balancer;
- set the canary node;
- turn on the balancer already with a limited amount of traffic;
- compare.
 At this point, we implement an automatic comparison . How it can look and why it is better than checking after the deployment, we will consider the example from Jenkins.This is the pipeline to Groovy.
while (System.currentTimeMillis() < endCanaryTs) {
    def isOk = compare(srv, canary, time, base, offset, metrics)
    if (isOk) {
        sleep DEFAULT SLEEP
    }   else {
        echo "Canary failed, need to revert"
        return false
    }
}
Here in the cycle we set that we will compare the new node for an hour. If the canary process has not finished the process yet, we call the function. She reports that all is well or not: def isOk = compare(srv, canary, time, base, offset, metrics).If all is well - sleep DEFAULT SLEEPfor example, for a second, and continue. If not, we exit - the deployment failed.Description of the metric. Let's see how a function might look compareon the example of DSL.metric(
'errorCounts',
'rate(errorCounts{node=~"$canaryInst"}[5m] offset $offset)',
{ baseValue, canaryValue ->
if (canaryValue > baseValue * 1.3) return false
return true
}
)
Suppose we compare the number of errors and want to know the number of errors per second in the last 5 minutes.We have two values: base and canary nodes. The value of the canary node is the current one. Basic - baseValueis the value of any other non-canary node. We compare the values with each other according to the formula, which we set based on our experience and observations. If the value is canaryValuebad, then the deployment failed, and we roll back.Why is all this necessary?Man cannot check hundreds and thousands of metricsespecially to do it quickly. An automatic comparison helps check all metrics and quickly alerts you to problems. The notification time is critical: if something happened in the last 2 seconds, then the damage will not be as big as if it happened 15 minutes ago. Until someone notices a problem, writes support, and we can lose customers to roll back support.If the process went well and everything is fine, we will deploy all other nodes automatically. Engineers are not doing anything at this time. Only when they run canary do they decide which metrics to take, how long to do the comparison, which strategy to use. If there are problems, we automatically roll back the canary node, work on previous versions and fix the errors that we found. By metrics they are easy to find and see the damage from the new version.
Obstacles
To implement this, of course, is not easy. First of all, we need a common monitoring system . Engineers have their own metrics, support and analysts have different ones, and business has third. A common system is a common language spoken by business and development.It is necessary to check in practice the stability of metrics. Verification helps to understand what is the minimum set of metrics needed to ensure quality .How to achieve this? Use canary service not at the time of deployment . We add a certain service on the old version, which at any moment of time will be able to take any allocated node, reduce traffic without deployment. After we compare: we study errors and look for that line when we achieve quality.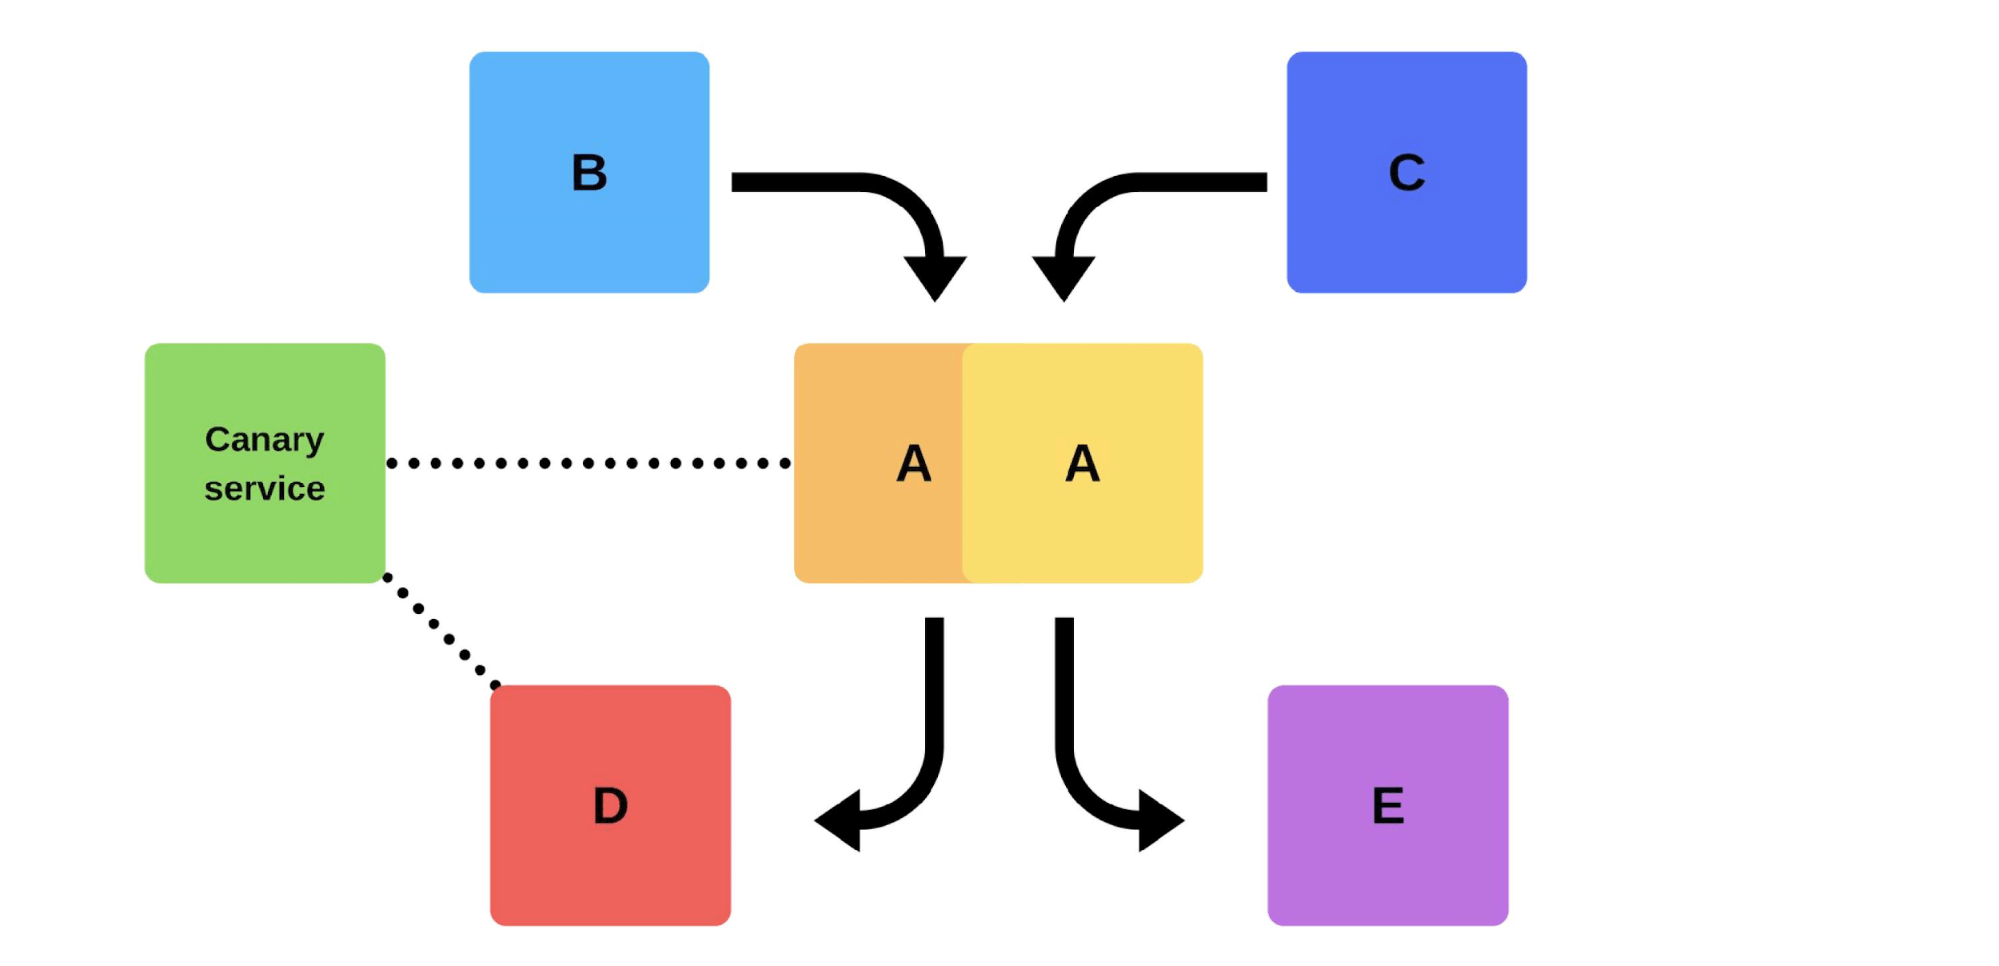
What benefit have we got from canary releases
Minimized the percentage of damage from bugs. Most deployment errors occur due to inconsistency in some data or priority. Such errors have become much smaller, because we can solve the problem in the first seconds.Optimized the work of teams. Beginners have a “right to make a mistake”: they can deploy to production without fear of mistakes, an additional initiative appears, an incentive to work. If they break something, then it will not be critical, and the wrong person will not be fired.Automated deployment . This is no longer a manual process, as before, but a real automated one. But it takes longer.Highlighted important metrics. The whole company, starting from business and engineers, understands what is really important in our product, which metrics, for example, the outflow and influx of users. We control the process: we test metrics, introduce new ones, see how the old ones work to build a system that will make money more productive.We have many cool practices and systems that help us. Despite this, we strive to be professionals and do our job efficiently, regardless of whether we have a system that will help us or not.— TechLead Conf. , , — .
TechLead Conf 8 9 . , , — , .