Also see other articles in the series "How to visualize and animate (geophysical) models":
Visual visualization allows you to quickly understand the essence of the work and the results obtained, but it happens to misunderstand. How to unambiguously demonstrate the results and, moreover, avoid a pile of confirming formulas and links to other works - so that everything is visually obvious (in the good sense of the word)?
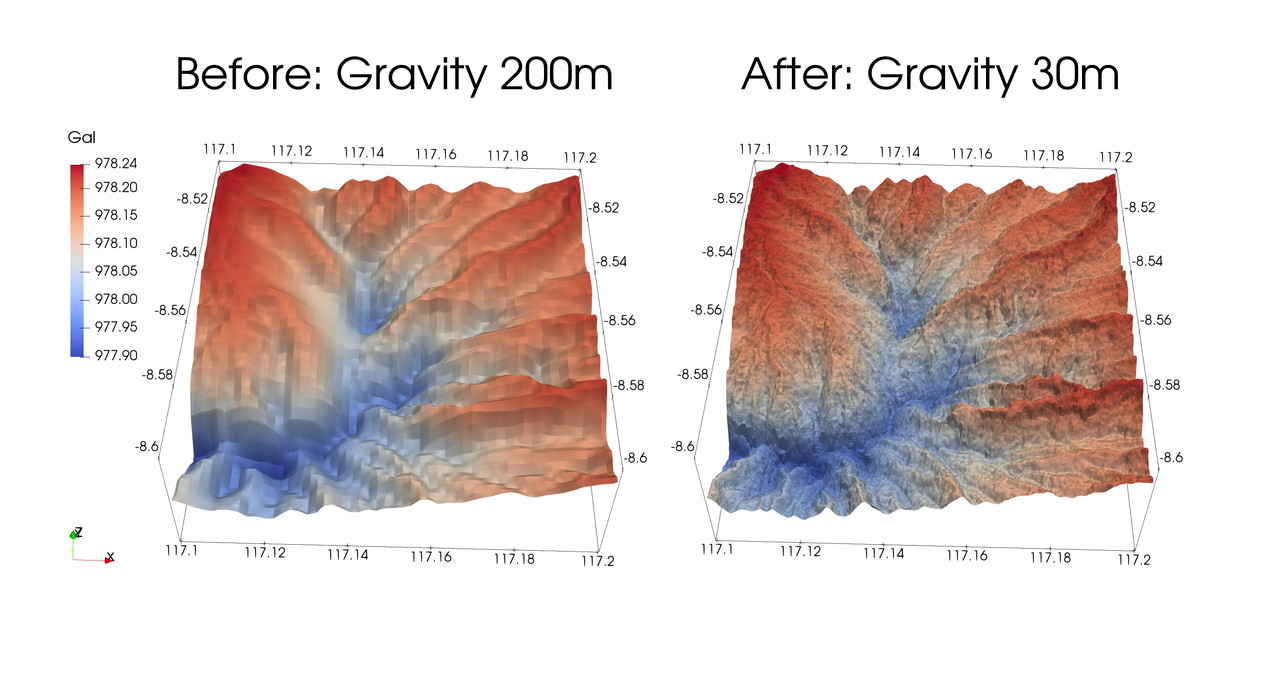
The picture above shows the results of the improvement of the gravity data of the GGMplus Free-Air Gravity Anomaly 200m using the SRTM terrain 30m using the technique of transferring the components of the spatial spectrum.
Formulation of the problem
Consider the task of improving the quality of the source data - this can be either a separate project, or part of a larger project. For example, to obtain detailed 3D geological models shown in previous articles in the series, detailed data of the gravel and topography obtained by this method were used.
, , - (super-resolution), . — , .
— , " -0.98, ". , , , - … , () , . ? , … ! , , , , , , . , , . , .
Python 3 GitHub, .
matplotlib :

, , . ? … . . 3D ParaView ( matplotlib 3D , ):
, , . " -0.98" matplotlib:

, -1 , , . , , — ( ). — 3D , .
3D , .
Python 3 source code (Jupyter notebook)
Build Super-resolution Gravity from GGMplus Free-Air Gravity Anomaly (200m) enhanced by SRTM topography (30m) is a more technical article in English on LinkedIn.