A few months ago, we announced explain.tensor.ru , a public service for parsing and visualizing PostgreSQL query plans .Over the past time, you have already used it more than 6,000 times, but one of the convenient functions could go unnoticed - these are structural hints that look something like this: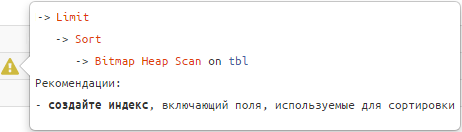 Listen to them and your requests will “become smooth and silky.” :)But seriously, many of the situations that make the request slow and “gluttonous” in terms of resources are typical and can be recognized by the structure and data of the plan .In this case, each individual developer will not have to look for an optimization option on their own, relying solely on their experience - we can tell him what is happening here, what could be the reason, and how to approach the solution . Which we did.
 Let's take a closer look at these cases - how they are determined and what recommendations they lead to.For a better insight into the topic, you can first listen to the corresponding block from my report on PGConf.Russia 2020 , and only then go on to a detailed analysis of each example:
# 1: index "undersorting"
When arises
Show the last invoice for the client "LLC Bell".How to recognize
-> Limit
   -> Sort
      -> Index [Only] Scan [Backward] | Bitmap Heap Scan
Recommendations
Use the index used to sort fields .Example:CREATE TABLE tbl AS
SELECT
generate_series(1, 100000) pk
, (random() * 1000)::integer fk_cli;
CREATE INDEX ON tbl(fk_cli);
SELECT
*
FROM
tbl
WHERE
fk_cli = 1
ORDER BY
pk DESC
LIMIT 1;
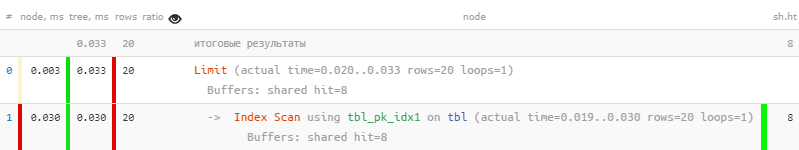
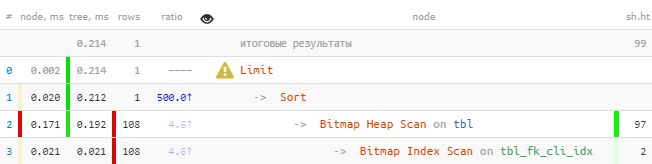 [look at explain.tensor.ru] Youcan immediately notice that the index subtracted more than 100 entries, which were then sorted, and then the only one was left.We fix:
DROP INDEX tbl_fk_cli_idx;
CREATE INDEX ON tbl(fk_cli, pk DESC);
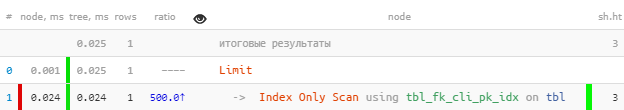 [look at explain.tensor.ru]Even on such a primitive sample - 8.5 times faster and 33 times less readings . The effect will be more visible the more “facts” you have for each value
 fk.I note that such an index will work as "prefix" no worse than the previous one for other queries with fk, where pkthere was no sorting and no sorting (more about this can be found in my article about finding inefficient indexes ). In particular, it will provide normal support for an explicit foreign key in this field.# 2: index intersection (BitmapAnd)
When arises
Show all the contracts for the client LLC Kolokolchik concluded on behalf of NAO Buttercup.How to recognize
-> BitmapAnd
   -> Bitmap Index Scan
   -> Bitmap Index Scan
Recommendations
Create a composite index for the fields from both the source or expand one of the existing fields from the second.Example:CREATE TABLE tbl AS
SELECT
generate_series(1, 100000) pk
, (random() * 100)::integer fk_org
, (random() * 1000)::integer fk_cli;
CREATE INDEX ON tbl(fk_org);
CREATE INDEX ON tbl(fk_cli);
SELECT
*
FROM
tbl
WHERE
(fk_org, fk_cli) = (1, 999);
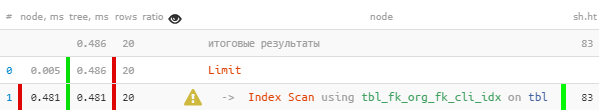
 [look at explain.tensor.ru]Correct:
DROP INDEX tbl_fk_org_idx;
CREATE INDEX ON tbl(fk_org, fk_cli);
 [look at explain.tensor.ru]Here the gain is less, because Bitmap Heap Scan is quite effective in itself. But still 7 times faster and 2.5 times less readings .
# 3: index pooling (BitmapOr)
When arises
Show the first 20 oldest “own” or unassigned applications for processing, and their priority.How to recognize
-> BitmapOr
   -> Bitmap Index Scan
   -> Bitmap Index Scan
Recommendations
Use UNION [ALL] to combine subqueries for each of the OR blocks of conditions.Example:CREATE TABLE tbl AS
SELECT
generate_series(1, 100000) pk
, CASE
WHEN random() < 1::real/16 THEN NULL
ELSE (random() * 100)::integer
END fk_own;
CREATE INDEX ON tbl(fk_own, pk);
SELECT
*
FROM
tbl
WHERE
fk_own = 1 OR
fk_own IS NULL
ORDER BY
pk
, (fk_own = 1) DESC
LIMIT 20;
 [look at explain.tensor.ru]Correct:
(
SELECT
*
FROM
tbl
WHERE
fk_own = 1
ORDER BY
pk
LIMIT 20
)
UNION ALL
(
SELECT
*
FROM
tbl
WHERE
fk_own IS NULL
ORDER BY
pk
LIMIT 20
)
LIMIT 20;
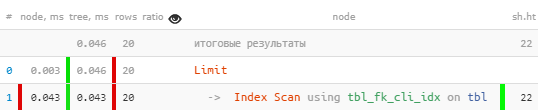
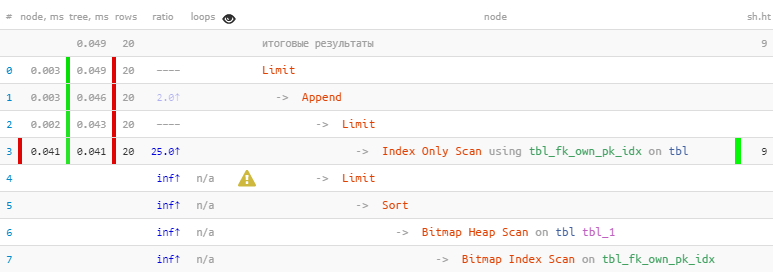 [look at explain.tensor.ru]We took advantage of the fact that all 20 necessary records were immediately received in the first block, so the second one, with the more “expensive” Bitmap Heap Scan, was not even performed - as a result , 22 times faster, in 44 times less readings !
A more detailed story about this optimization method using specific examples can be found in the articles of PostgreSQL Antipatterns: harmful JOIN and OR and PostgreSQL Antipatterns: a tale about iterative refinement of the search by name, or “Optimization there and back” .
A generalized version of ordered selection by several keys (and not just by a const / NULL pair) is considered in SQL HowTo article : we write a while-loop directly in the query, or “Elementary three-way” .
# 4: read a lot of unnecessary
When arises
As a rule, it arises if you want to “fasten another filter” to an existing request.“And you don’t have the same, but with pearl buttons ?” film "Diamond Hand"
For example, modifying the task above, show the first 20 oldest “critical” applications for processing, regardless of their purpose.How to recognize
-> Seq Scan | Bitmap Heap Scan | Index [Only] Scan [Backward]
   && 5 × rows < RRbF --  >80%
   && loops × RRbF > 100 --     100
Recommendations
Create a [more] custom index with a WHERE clause or include additional fields in the index.If the filtering condition is “static” for your tasks — that is, it does not involve expanding the list of values in the future — it is better to use a WHERE index. Different boolean / enum statuses fit well into this category.
If the filter condition can take different values , then it is better to expand the index with these fields - as in the situation with BitmapAnd above.
Example:CREATE TABLE tbl AS
SELECT
generate_series(1, 100000) pk
, CASE
WHEN random() < 1::real/16 THEN NULL
ELSE (random() * 100)::integer
END fk_own
, (random() < 1::real/50) critical;
CREATE INDEX ON tbl(pk);
CREATE INDEX ON tbl(fk_own, pk);
SELECT
*
FROM
tbl
WHERE
critical
ORDER BY
pk
LIMIT 20;
 [look at explain.tensor.ru]Correct:
CREATE INDEX ON tbl(pk)
WHERE critical;
 [look at explain.tensor.ru]As you can see, filtering has completely disappeared from the plan, and the request has become 5 times faster .
# 5: sparse table
When arises
Various attempts to make their own queue of processing tasks when a large number of updates / deletes of records on the table lead to a situation of a large number of "dead" records.How to recognize
-> Seq Scan | Bitmap Heap Scan | Index [Only] Scan [Backward]
   && loops × (rows + RRbF) < (shared hit + shared read) × 8
      --   1KB
   && shared hit + shared read > 64
Recommendations
Manually carry out VACUUM [FULL] manually or achieve adequate frequent autovacuum testing by fine-tuning its parameters, including for a specific table .In most cases, these problems are caused by poorly structured queries when calling from business logic, such as those discussed in PostgreSQL Antipatterns: fighting hordes of the “dead” .
But you need to understand that even VACUUM FULL may not always help. For such cases, you should familiarize yourself with the algorithm from the DBA article : when VACUUM passes, we clean the table manually .
# 6: reading from the middle of the index
When arises
It seems that they didn’t read much, and everything was indexed, and they didn’t filter anyone else - but anyway, significantly more pages were read than we would like.How to recognize
-> Index [Only] Scan [Backward]
   && loops × (rows + RRbF) < (shared hit + shared read) × 8
      --   1KB
   && shared hit + shared read > 64
Recommendations
Closely look at the structure of the index used and the key fields specified in the request - most likely, part of the index is not specified . Most likely, you will have to create a similar index, but without prefix fields or learn how to iterate over their values .Example:CREATE TABLE tbl AS
SELECT
generate_series(1, 100000) pk
, (random() * 100)::integer fk_org
, (random() * 1000)::integer fk_cli;
CREATE INDEX ON tbl(fk_org, fk_cli);
SELECT
*
FROM
tbl
WHERE
fk_cli = 999
LIMIT 20;
 [look at explain.tensor.ru]It seems that everything is fine, even by index, but somehow suspiciously - for each of the 20 read records I had to subtract 4 pages of data, 32KB per record - isn't it bold? Yes, and the name of the index is suggestive. We fix:
tbl_fk_org_fk_cli_idxCREATE INDEX ON tbl(fk_cli);
 [look at explain.tensor.ru]Suddenly - 10 times faster and 4 times less read !
Other examples of situations of inefficient use of indexes can be seen in the DBA article : Find Useless Indexes .
# 7: CTE × CTE
When arises
In the query we typed “fat” CTEs from different tables, and then decided to do between them JOIN.The case is relevant for versions below v12 or requests from WITH MATERIALIZED.How to recognize
-> CTE Scan
   && loops > 10
   && loops × (rows + RRbF) > 10000
      --     CTE
Recommendations
Carefully analyze the request - is CTE needed here at all ? If all the same, then apply “tearing” in hstore / json according to the model described in PostgreSQL Antipatterns: hit the dictionary with a heavy JOIN .# 8: swap to disk (temp written)
When arises
A single processing (sorting or uniqueization) of a large number of records does not fit into the memory allocated for this.How to recognize
-> *
   && temp written > 0
Recommendations
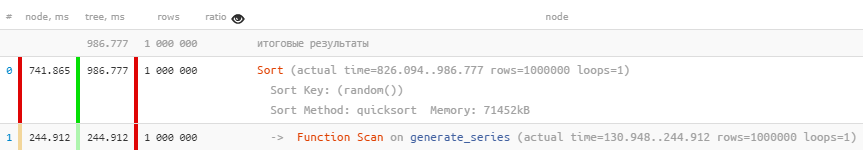
If the amount of memory used by the operation does not greatly exceed the set value of the work_mem parameter , it is worth adjusting it. You can immediately in the config for everyone, but you can through SET [LOCAL]for a specific request / transaction.Example:SHOW work_mem;
SELECT
random()
FROM
generate_series(1, 1000000)
ORDER BY
1;
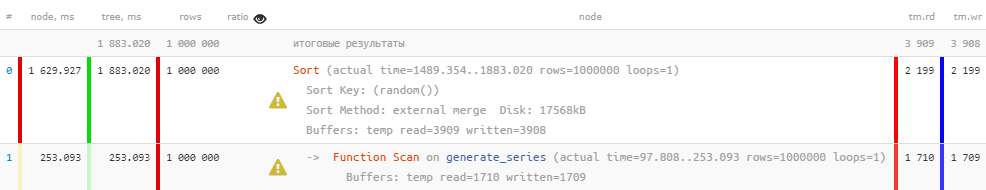 [look at explain.tensor.ru]Correct:
SET work_mem = '128MB';
 [look at explain.tensor.ru]For obvious reasons, if only memory is used, not a disk, then the request will be executed much faster. At the same time, part of the load from the HDD is also removed.But you need to understand that allocating a lot of memory always does not work either - it will not be enough for everyone.
# 9: irrelevant statistics
When arises
They poured a lot at once into the database, but did not manage to drive them away ANALYZE.How to recognize
-> Seq Scan | Bitmap Heap Scan | Index [Only] Scan [Backward]
   && ratio >> 10
Recommendations
Do the same ANALYZE.This situation is described in more detail in PostgreSQL Antipatterns: statistics are all over the head .
# 10: “something went wrong”
When arises
There was an expectation of a lock imposed by a competing request, or there were not enough CPU / hypervisor hardware resources.How to recognize
-> *
   && (shared hit / 8K) + (shared read / 1K) < time / 1000
      -- RAM hit = 64MB/s, HDD read = 8MB/s
   && time > 100ms --  ,
Recommendations
Use an external system to monitor the server for locks or abnormal resource consumption. About our version of the organization of this process for hundreds of servers, we already talked here and here .