 When working on data visualization for an article, it became necessary to have 4 axes with positive labels on all.As with other article charts, I decided to use gnuplot . First of all, I looked at the official website, where there are many examples. I was very glad when I found the necessary example (I will not work a lot with a file and it will be beautiful, I thought).
 Quickly copied the code, run it. I get an error. I understand. It turned out that I have an old gnuplot (
 Version 5.0 patchlevel 3 last modified 2016-02-21) and it doesn’t.Knowing the flexibility of gnuplot, he began to rummage around the world wide web and came across several suitable examples on stackoverflow ( Double x-axis on a spider plot with Gnuplot and How to Create a Spider Plot in Gnuplot? ) And github ( gnuplot-radarchart ). They became the starting point.Further, my manipulations with the commands led to the following:0) Turn off the bordersunset border
1) Create 4 zero lines - 2 main and 2 additional:set xzeroaxis
set yzeroaxis
set x2zeroaxis
set y2zeroaxis
A few words about the zero lines in the documentation . This operation allows you to reduce the axis to the center of the picture. And additional ones are needed to display positive ticks on them.2) Configure the display of ticks on the axes:max = 1.5 #
min = -max
set xtics axis 0,.5,max in scale 0.5,0.25 mirror norotate autojustify offset 0.35
set ytics axis .5,.5,max in scale 0.5,0.25 mirror norotate autojustify
set x2tics axis .5,.5,max in scale 0.5,0.25 mirror norotate autojustify
set y2tics axis .5,.5,max in scale 0.5,0.25 mirror norotate autojustify
With ticks on the axes of settings a little more.axis- where the ticks will be located, on the axis or (border - on the border).For an axis xthat goes to the right 0,.5,max. The first number is the origin, the second is the step, the third is the end of the count. For the first from 0, and for the rest from 0.5, so that the zeros do not interfere at the origin.The setting scale 0.5,0.25 mirror adds serifs to the axis. If you play around with numbers, then their size will change.I also introduce variables max, minwith which I control the boundaries of the graph axes.For more information on setting ticks, see the documentation in the Xtics section .3) Configure axes ranges:set xrange [ min : max ]
set yrange [ min : max ]
set x2range [ max : min ]
set y2range [ max : min ]
It should be noted that 2 axes start counting from minincreasing and 2 axes starting maxfrom decreasing.See the Xrange section for more information .4) We give the axes names and place them nicely:set label "H_1" at 0, max center offset char 2, 0
set label "H_2" at max+0.1, 0 center offset char -1, 1
set label "H_3" at 0, min center offset char -2, 0
set label "H_4" at min, 0 center offset char 0, 1
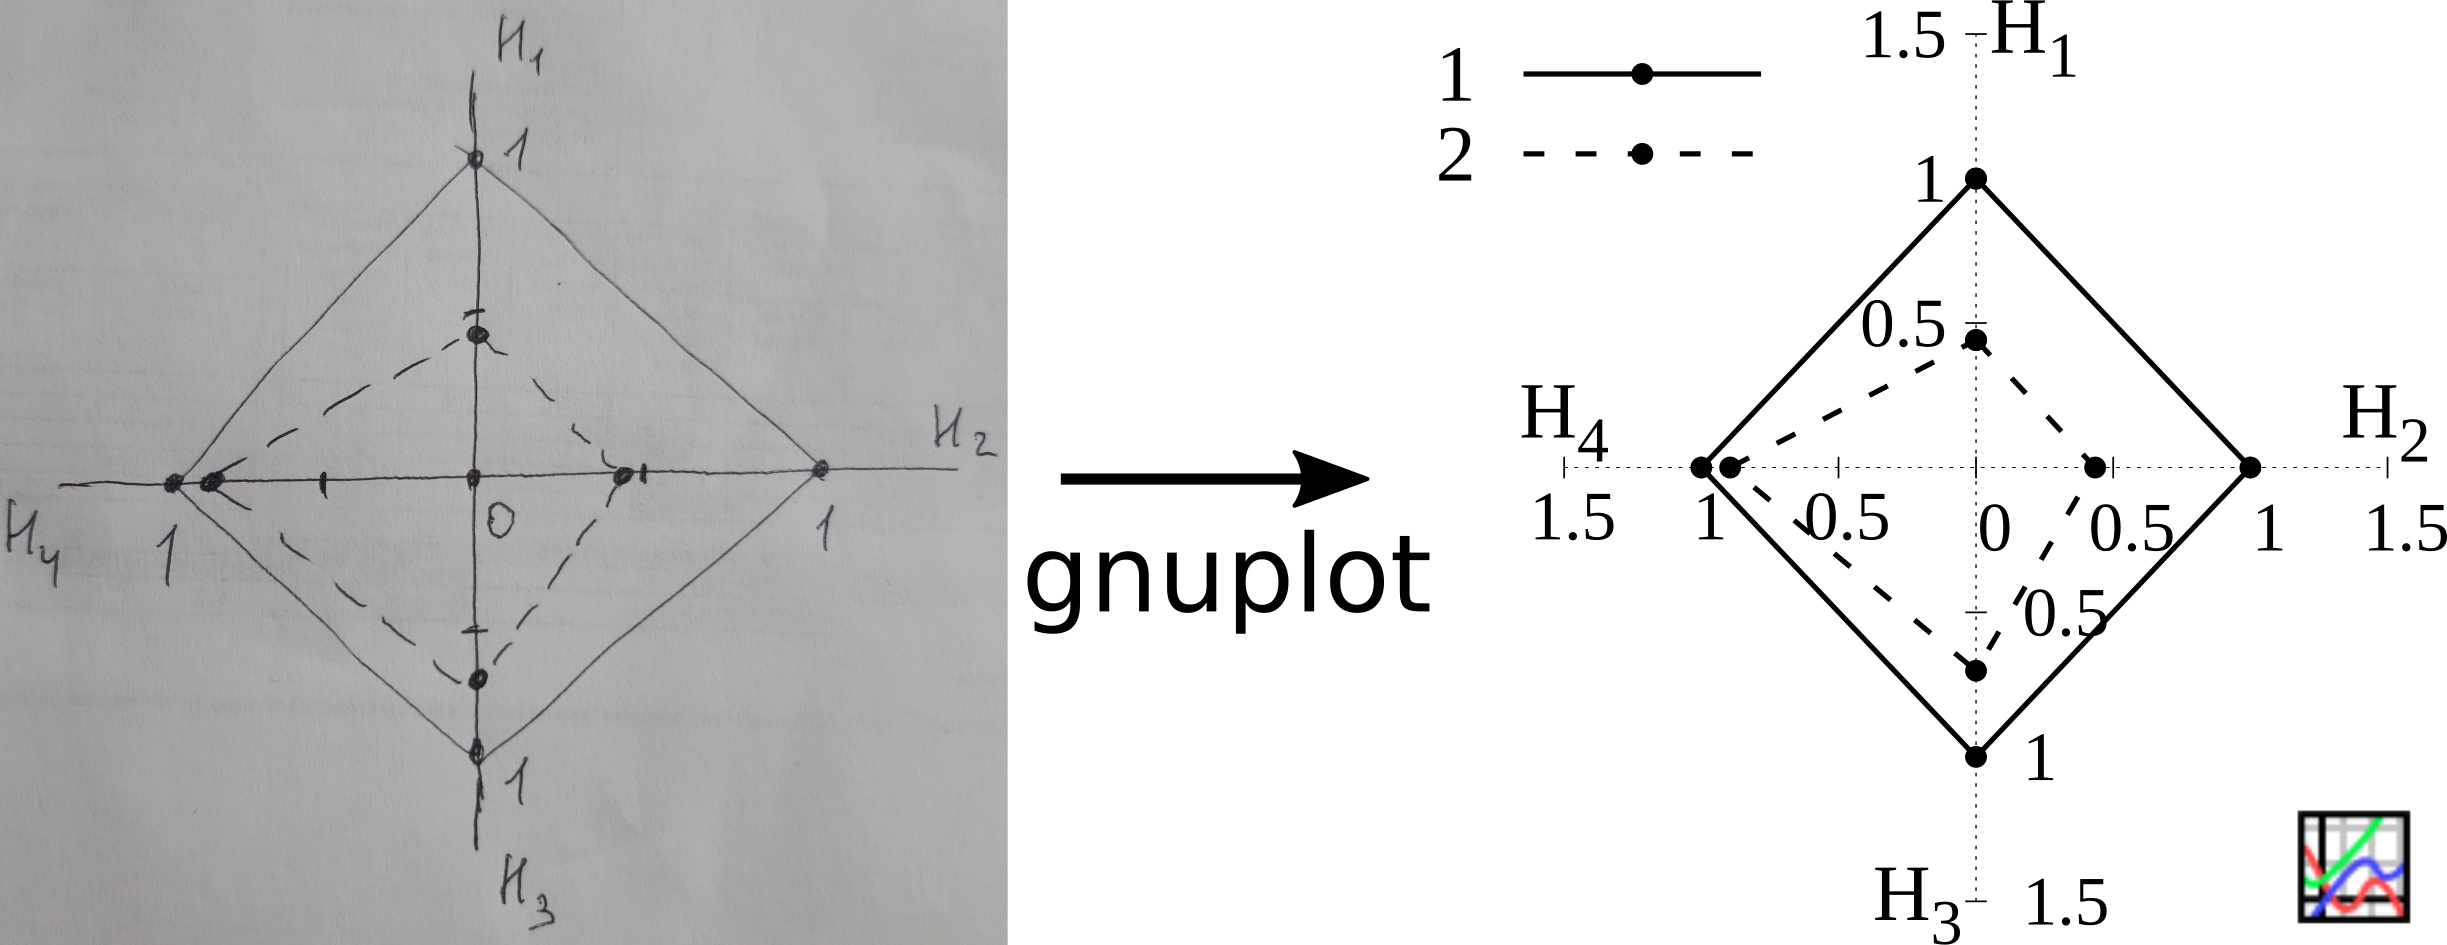
5) We form the input data. Each column has 2 columns. Line number - axis number, fifth line to close the loop. Odd column - coordinate x, even - y. Due to the fact that all points are located on the axes, one of a pair (x, y)is always equal to zero.Despite the fact that all 4 axes are positive, some data are artificially moved to the negative half, because they are located on the main axes xand y. 0 1 0 1.21
1 0 1.21 0
0 -1 0 -1.06
-1 0 -1.19 0
0 1 0 1.21 #
Result
Full code#!/usr/bin/gnuplot -persist
# cp1251 eps
set encoding cp1251
set terminal postscript eps enhanced monochrome size 5cm,5cm
set output "./img/eps/fig2.eps"
unset border
set key at -2, 1.5 font 'LiberationSerif, 23'
set key left top samplen 4.5
set xzeroaxis
set yzeroaxis
set x2zeroaxis
set y2zeroaxis
max = 1.5
min = -max
set xtics axis 0,.5,max in scale 0.5,0.25 mirror norotate autojustify offset 0.35 font 'LiberationSerif, 20
set ytics axis .5,.5,max in scale 0.5,0.25 mirror norotate autojustify font 'LiberationSerif, 20
set x2tics axis .5,.5,max in scale 0.5,0.25 mirror norotate autojustify font 'LiberationSerif, 20
set y2tics axis .5,.5,max in scale 0.5,0.25 mirror norotate autojustify font 'LiberationSerif, 20
set xrange  [ min : max ]
set yrange  [ min : max ]
set x2range [ max : min ]
set y2range [ max : min ]
set label "H_1" at 0, max center offset char 2, 0 font 'LiberationSerif, 23'
set label "H_2" at max+0.1, 0 center offset char -1, 1 font 'LiberationSerif, 23'
set label "H_3" at 0, min center offset char -2, 0 font 'LiberationSerif, 23'
set label "H_4" at min, 0 center offset char 0, 1 font 'LiberationSerif, 23'
set style line 1 linetype 1 pointtype 7 linewidth 3 linecolor black
set style line 2 linetype 2 pointtype 7 linewidth 3 linecolor black
plot 'data.csv' using 1:2 title "1" w lp ls 1 ,\
'data.csv' using 3:4 title "2" w lp ls 2