We are pleased to announce the release of the C ++ Build Insights SDK , a framework that gives you access to MSVC build time information through the C and C ++ APIs. In addition to this release, we are publishing vcperf open source on GitHub . Since vcperf itself is built using the SDK, you can use it as a reference when developing your own tools. We will be glad to see which applications you will create using the SDK, and we look forward to your feedback!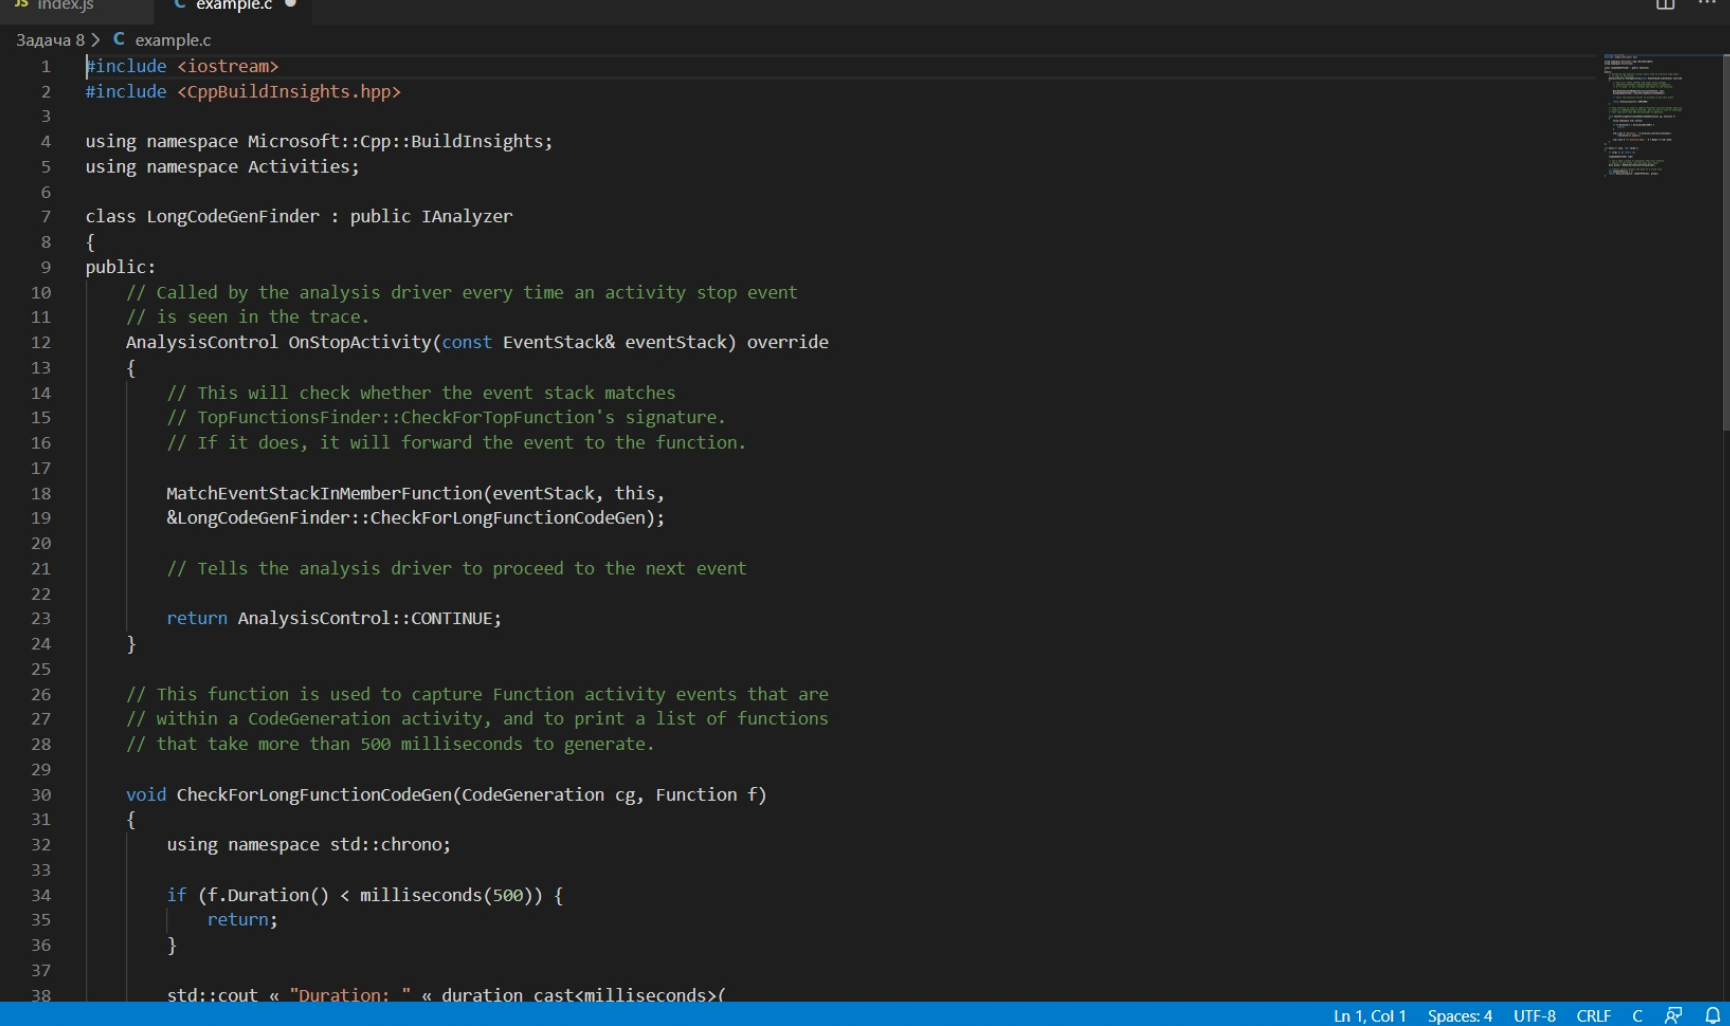
Background
Last November, we introduced vcperf and its Windows Performance Analyzer (WPA) plugin , which help MSVC users understand their build time. Both components were announced under the auspices of C ++ Build Insights. But what is C ++ Build Insights?In November, we already said that C ++ Build Insights is based on Event Tracing for Windows (ETW), a convenient tracing mechanism available on the Windows operating system. But ETW was not enough to scale our technology to the very large C ++ builds made by our customers. We needed to fine-tune the event model and the analysis algorithms used. The result of this work is a new data analysis platform for MSVC, which we now call C ++ Build Insights.Today, the C ++ Build Insights platform is what vcperf and some of our internal tools support. Nevertheless, we wanted to give all of you the opportunity to benefit from this. To do this, we assembled it with the C and C ++ interfaces to create a complete software development kit.Get started with the C ++ Build Insights SDK
Use the C ++ Build Insights SDK to create custom tools that fit your scripts:- Analyze traces programmatically, not through WPA.
- Add build time analysis to your continuous integration (CI).
- Or just have some fun!
Here's how you can get started with the SDK. This example shows how to create a program that lists functions that take more than 500 milliseconds to create.
- Download and install a copy of Visual Studio 2019 .
- (trace) .
- x64 Native Tools VS 2019.
- : vcperf /start MySessionName
- C++ , Visual Studio (vcperf ).
- : vcperf /stopnoanalyze MySessionName outputFile.etl. (trace) outputFile.etl.
- Visual Studio C++.
- , « NuGet…» Microsoft.Cpp.BuildInsights NuGet nuget.org. .
- .
- , outputFile.etl .
#include <iostream>
#include <CppBuildInsights.hpp>
using namespace Microsoft::Cpp::BuildInsights;
using namespace Activities;
class LongCodeGenFinder : public IAnalyzer
{
public:
AnalysisControl OnStopActivity(const EventStack& eventStack) override
{
MatchEventStackInMemberFunction(eventStack, this,
&LongCodeGenFinder::CheckForLongFunctionCodeGen);
return AnalysisControl::CONTINUE;
}
void CheckForLongFunctionCodeGen(CodeGeneration cg, Function f)
{
using namespace std::chrono;
if (f.Duration() < milliseconds(500)) {
return;
}
std::cout << "Duration: " << duration_cast<milliseconds>(
f.Duration()).count();
std::cout << "\t Function Name: " << f.Name() << std::endl;
}
};
int main(int argc, char *argv[])
{
if (argc <= 1) return -1;
LongCodeGenFinder lcgf;
auto group = MakeStaticAnalyzerGroup(&lcgf);
int numberOfPasses = 1;
return Analyze(argv[1], numberOfPasses, group);
}
A cloned and embedded version of this example is also available in our GitHub repository with C ++ Build Insights examples. .Note that you can also get the trace programmatically, and not through vcperf, using the SDK. See the C ++ Build Insights SDK white papers for more details .vcperf is now open source
vcperf itself is created using the C ++ Build Insights SDK, and we make it open-source on GitHub . We hope you can use it to learn more about the SDK and customize vcperf to your needs. The repository includes an example commit that extends vcperf to detect linkers that were restarted due to errors. The example highlights these calls in the C ++ Build Insights' Build Explorer view in WPA. We recommend reading this commit example in the following order:- RestartedLinkerDetector.h
- BuildExplorerView.cpp
- Commands.cpp
The reason you might want to build and run vcperf from GitHub today is to access new events that are not yet supported in the released version of vcperf, including new template creation events. Please note that vcperf is not tied to any specific version of Visual Studio, but new events are only supported in Visual Studio 2019 version 16.4 and higher. Here is the updated event table: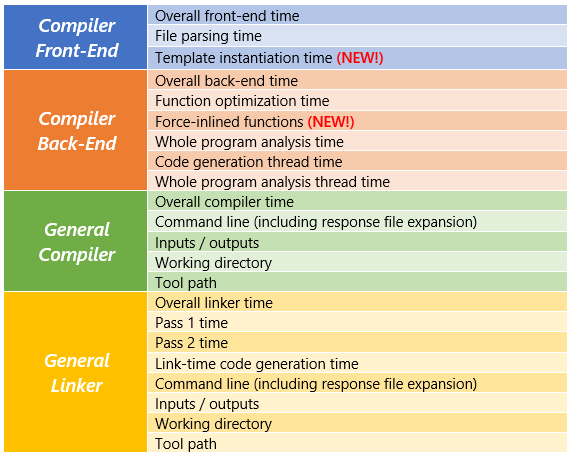
Share your opinion
We hope you enjoy the C ++ Build Insights SDK release , as well as the open source version of vcperf. Download Visual Studio 2019 today and get started on the first C ++ Build Insights app.