Modern coverage reports are in some cases rather useless, and the methods for measuring them are mainly suitable only for developers. You can always find out the percentage of coverage or view the code that was not used during the tests, but what if you want visibility, simplicity and automation? Under the cut - video and transcript of a report by Artem Eroshenko from Qameta Software from the Heisenbug conference . He introduced several developed simple and elegant solutions that help the Yandex.Verticals team evaluate the coverage of tests written by test automation engineers. Artem will tell you how to quickly find out what is covered, how covered, what tests have passed, and instantly see visual reports.My name is Artyom Eroshenko eroshenkoam, I have been doing test automation for over 10 years. I was a testing automation manager, a tool development team manager, a tool developer.At the moment I am a consultant in the field of testing automation, I work with several companies with whom we build processes.I am also the developer and secret manager of Allure Report. We recently fixed a cool thing : now in JUnit 5 there are fixtures.
Atlas Framework
My development is the Atlas Framework . If someone started to automate in 2012, when Java web drivers were just starting their way, at that moment I made an open source library called HTML Elements .Html Elements has its continuation and rethinking in the Atlas library, which is built on interfaces: there are no classes as such, no fields, a very convenient, lightweight and easily extensible library. If you have a desire to understand it, you can read the article or see the report .My report is devoted to the problem of test automation and mainly to coatings. As a background, I would like to refer to how the testing processes are organized in Yandex.Verticals.How does automation work in verticals?
There are only four people in the Yandex.Verticals testing automation team who automate four services: Yandex.Avto, Work, Real Estate and Parts. That is, this is a small team of automators who do a lot. We automate the API, web interface, mobile applications and so on. In total, we have somewhere around 15.5 thousand tests that are performed at different levels.The stability of the tests in the team is about 97%, although some of my colleagues say about 99%. Such high stability is achieved precisely thanks to short tests on very native technologies. As a rule, our tests take about 15 minutes, which is very capacious, and we run them in approximately 800 threads. That is, we have 800 browsers starting at the same time - such a stress test of our testing. As iron we use Selenoid (Aerokube). You can learn more about testing automation in Yandex.Verticals by watching my 2017 report, which is still relevant.Another feature of our team is that we automate everything , including manual testers, who make a great contribution to the development of test automation. For them, we organize schools, teach them tests, teach how to write tests for the API, the web interface, and often they help accompany the tests. Thus, the guys who are responsible for the release themselves can immediately correct the test, if necessary.In Verticals, test developers write tests, and they are so keen on test development that they compete with us. You can learn more about this process from the report “The full cycle of testing React applications”, where Alexei Androsov and Natalya Stus talk about how they write Unit tests on Puppeteer in parallel with our Java end-to-end tests.Test automation engineers also write tests in our team. But often we are developing some new approaches to optimize them. For example, we implemented screenshot testing, testing through moki, reduction of testing. In general, our area is mainly software developer in test (SDET), we are more about how to write tests, and the test base is partially filled by us and is supported by manual testers.Developers also help us, and that's cool.
The problem that arises within these processes is that we do not always understand what is already covered and what is not. Looking through 15 thousand tests, it is not always clear what exactly we check. This is especially true in the context of communication with managers, who, of course, do not test, but monitor and ask questions. In particular, if the question arises whether a particular button has been tested in the interface or flow, then it is difficult to answer, because you need to go to the test code and look at this information.What is tested and what is not?
If you have many tests in different languages and are written by people with varying degrees of training, then sooner or later the question arises, are these tests not intersected at all? In the context of this problem, the issue of coverage is becoming particularly relevant. I will outline three key topics:- Ways to effectively measure coverage.
- Coverage for API tests.
- Coverage for web tests.
First of all, let’s determine that there are two ways of covering: covering requirements and covering product code.How requirements coverage is measured
Consider the requirements coverage using auto.ru as an example. In place of the auto.ru tester, I would do the following. Firstly, I would google and immediately find a special requirements table. This is the basis of the requirements coverage.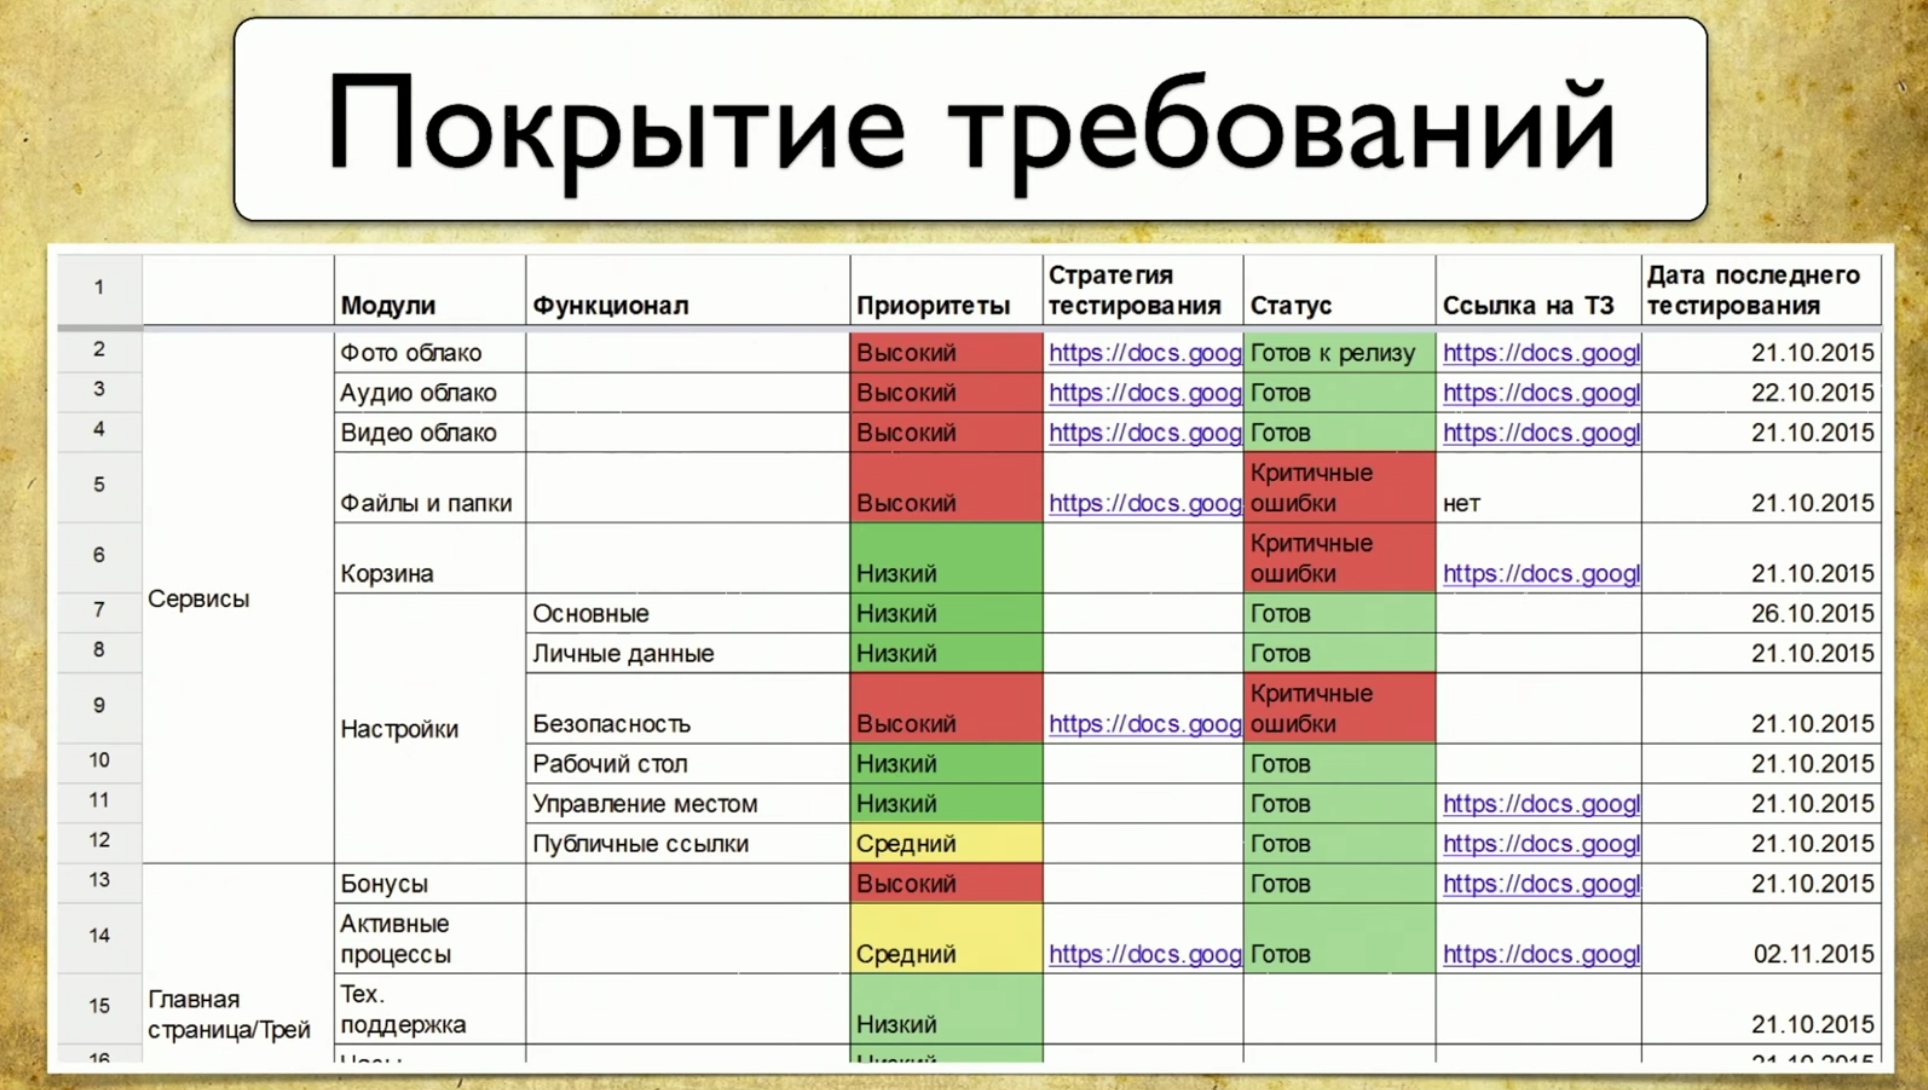 In this table, the names of the requirements are written on the left. In this case: account, ads, verification and payment, that is, verification of the announcement. In general, this is the coverage. The detail of the left part depends on the tester level. For example, engineers from Google have 49 types of coatings that are tested at different levels.The right side of the table is the requirements attributes. We can use anything in the form of attributes, for example: priority, coverage and state. This may be the date of the last release.
 Thus, some data appears in the table. You can use professional tools to maintain a requirements table, for example, TestRail.There is information about the tree on the right: the folders indicate what requirements we have, how they can be covered. There are test cases and so on.
 In the Verticals, this process looks like this: a manual tester describes the requirements and test cases, then passes them to the test automation, and the automated tool writes code for these tests. Moreover, earlier we were given detailed test cases in which the manual tester described the entire structure. Then someone made a commit on the github, and the test began to be beneficial.What are the pros and cons of this approach? The plus is that this approach answers our questions. If the manager asks what we have covered, I will open the tablet and show what features are covered. On the other hand, these requirements must always be kept up to date, and they become obsolete very quickly.When you have 15 thousand tests, looking at TestRail is like looking at a star in space: it exploded for a long time, and the light has reached you just now. You look at the current test case, and it is already outdated a long time and irrevocably.This problem is difficult to solve. For us, these are generally two different worlds: there is a world of automation that revolves according to its own laws, where every test that fails is immediately fixed, and there is a world of manual testing and requirements cards. The wall between them is impenetrable, unless you use Allure Server. We now just solve this problem for them.The third point of the “pros and cons” is the need for manual work. In a new project, you need to re-create a requirements map, write all test cases, and so on. It always requires manual work, and it is actually very sad.
How code coverage is measured
An alternative to this approach is code coverage. This seems to be the solution to our problem. This is how the coverage of the product code looks: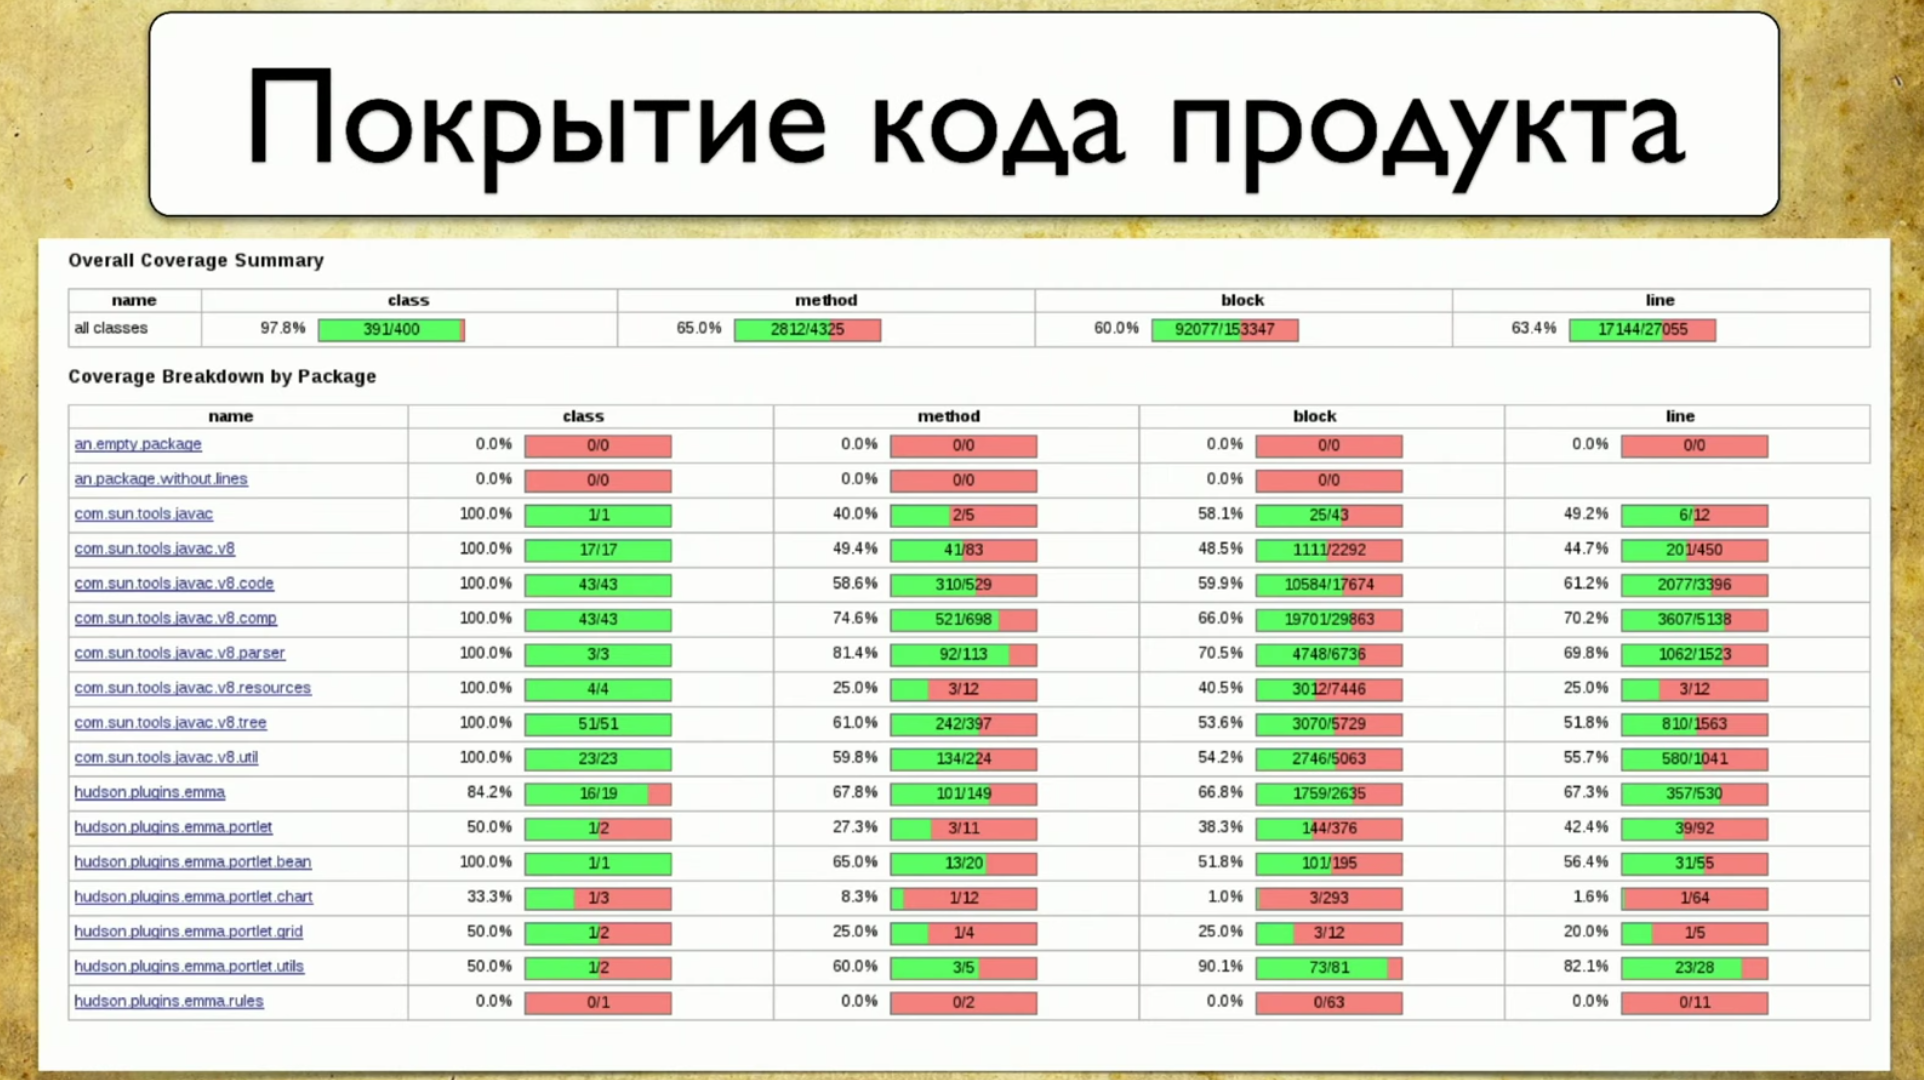 It reflects the coverage of the package, or rather a small part of what is actually usually in the product. The package is written on the left, as features were written before. That is, our coating is finally attached to some tangible things, in this case - Package. Attributes are written on the right: coverage by class, coverage by methods, coverage by code blocks and coverage by lines of code.The process of collecting coverage is to understand which line of code the test passed and which didn’t. This is a fairly simple task, but recently very relevant.
The first mention of code coverage was back in 1963, but serious progress in this direction appears only now.
So, we have a test that interacts with the system. It doesn’t matter how he interacts with her: through the front-end, API or directly creeps into the back-end - we’ll just assume that we have it.Then instrumentation should be done. This is some process that allows you to understand which lines of code were checked and which were not. You do not need to study it in detail, you just need to look for the name of your framework on which you write, say, Spring , then instrumentation , and coverage - these three words will help you understand how this is done.When your tests check which line of code the test hit and which didn’t hit, they save files with information about which lines are covered. Based on this information, you have data.What are the pros and cons of code coverage?
Code coverage I would immediately call a minus . You will not come to the manager, you will not show this plate and you will not say that everyone has automated, because this data cannot be read, he will ask you to return clear data that you can quickly look at and understand everything.Code coverage report closer to development. It cannot be used as a normal approach to providing all the data to a team if we want the whole team to be able to watch. The advantage of this approach is that it always provides relevant data. You do not have to do a lot of work, everything is automated for you. Just plug in the library, your covers begin to take off - and it's really cool.Another advantage of this approach is that it requires only customization. There is nothing special to do there - just come with a specific instruction, adjust the coverage, and it works automatically.Coverage of requirements allows you to identify unfulfilled requirements, but does not allow to evaluate the completeness in relation to the code. For example, you started writing a new feature “authorization”, just enter the “feature of authorization”, you start to throw test cases on it. You cannot immediately see this coverage in the code, even if you write some new class, there will still be no information - there is a gap. On the other hand, this is a requirement of authorization, even when it will already be implemented, when you count the coverage on it, this part cannot be relevant, it must be kept up to date manually.Therefore, we had an idea: what if we take the best from everyone? So that the coverage answered our questions, it was always relevant and required only customization. We just need to look at the coating from a different angle, that is, take another system as the basis of the coating. At the same time, make sure that it is collected completely automatically and brings a bunch of benefits. And for this we will go into coverage for the API tests.
Test Coverage API
What is the basis of coverage? To do this, we use Swagger - this is the documentation API. Now I can not imagine my work without Swagger, it is a tool that I constantly use for testing. If you do not use Swagger, I highly recommend visiting the site and familiarizing yourself. There you will immediately see a very intuitive and understandable example of use.In fact, Swagger is the documentation that is generated by your service. It contains:- List of requests.
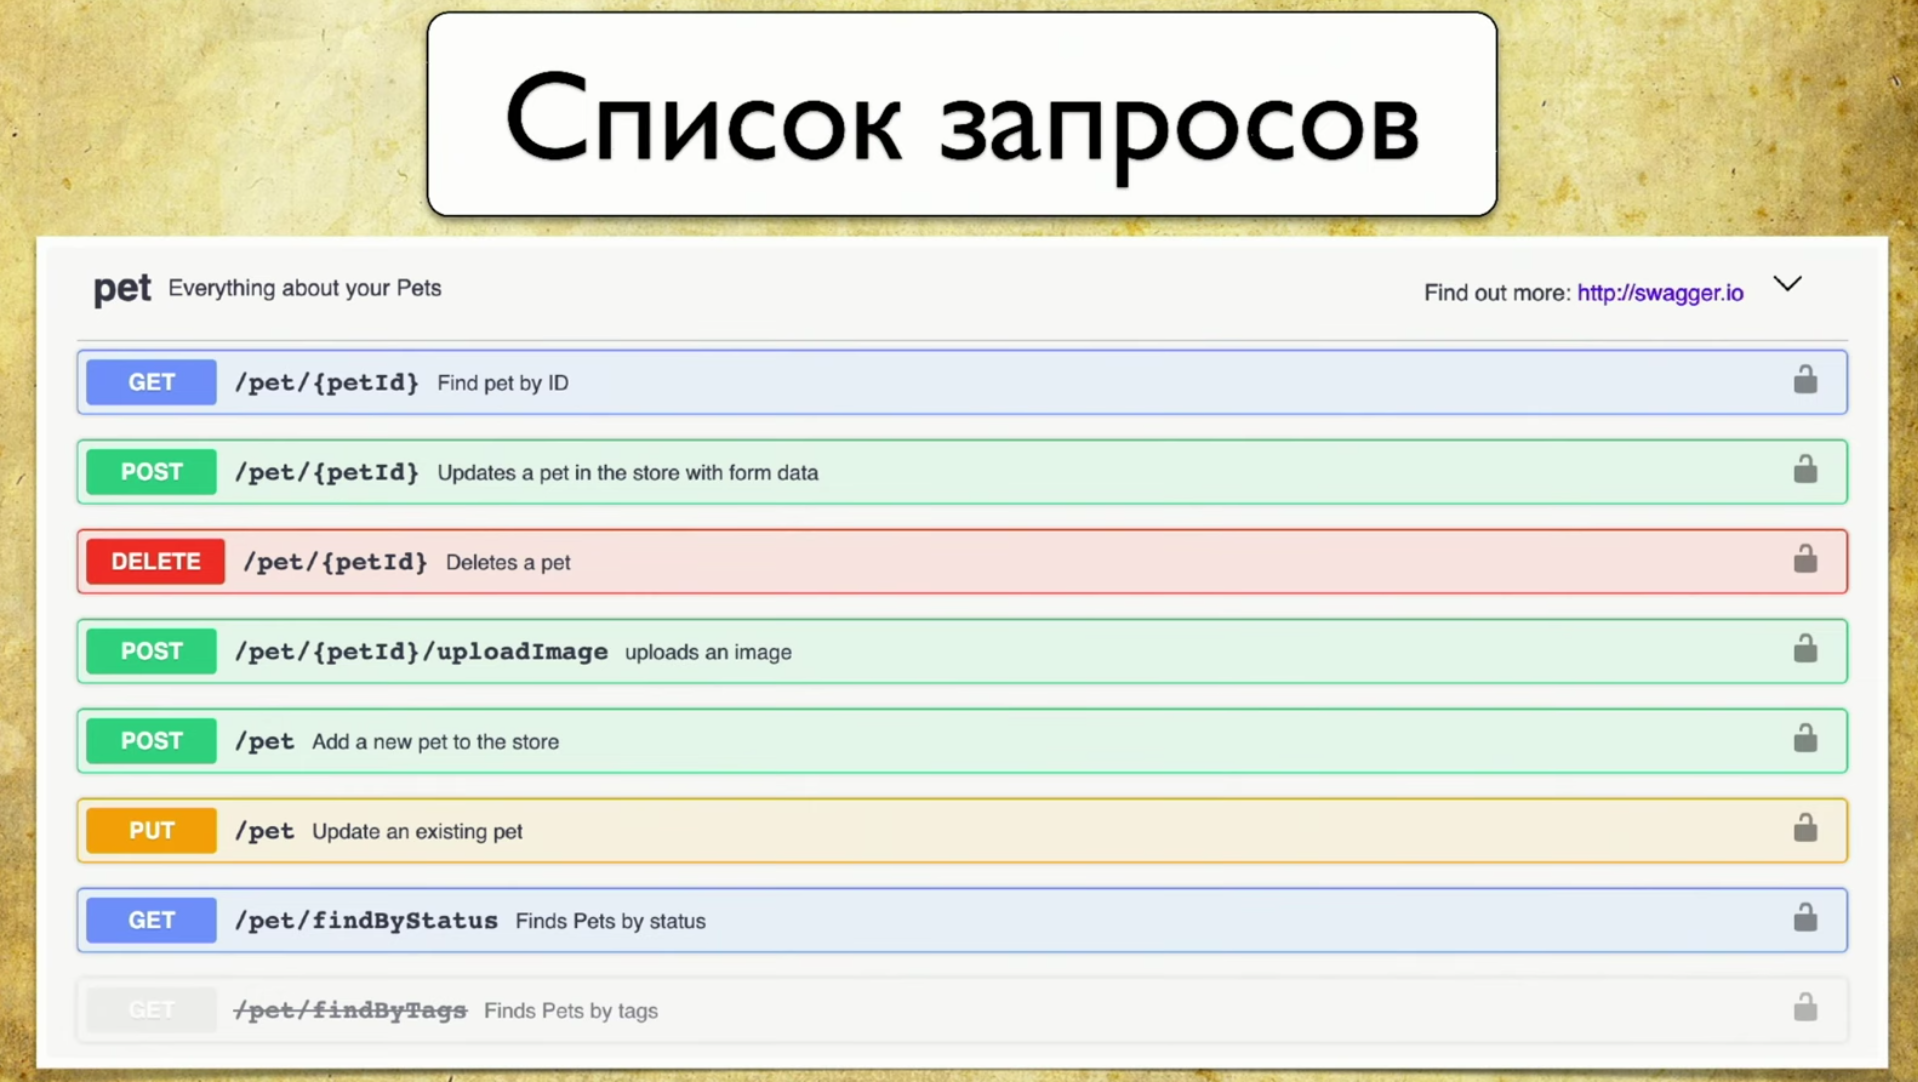
- Request parameters: there is no need to pull the developer and ask what parameters are.
- Answer Codes

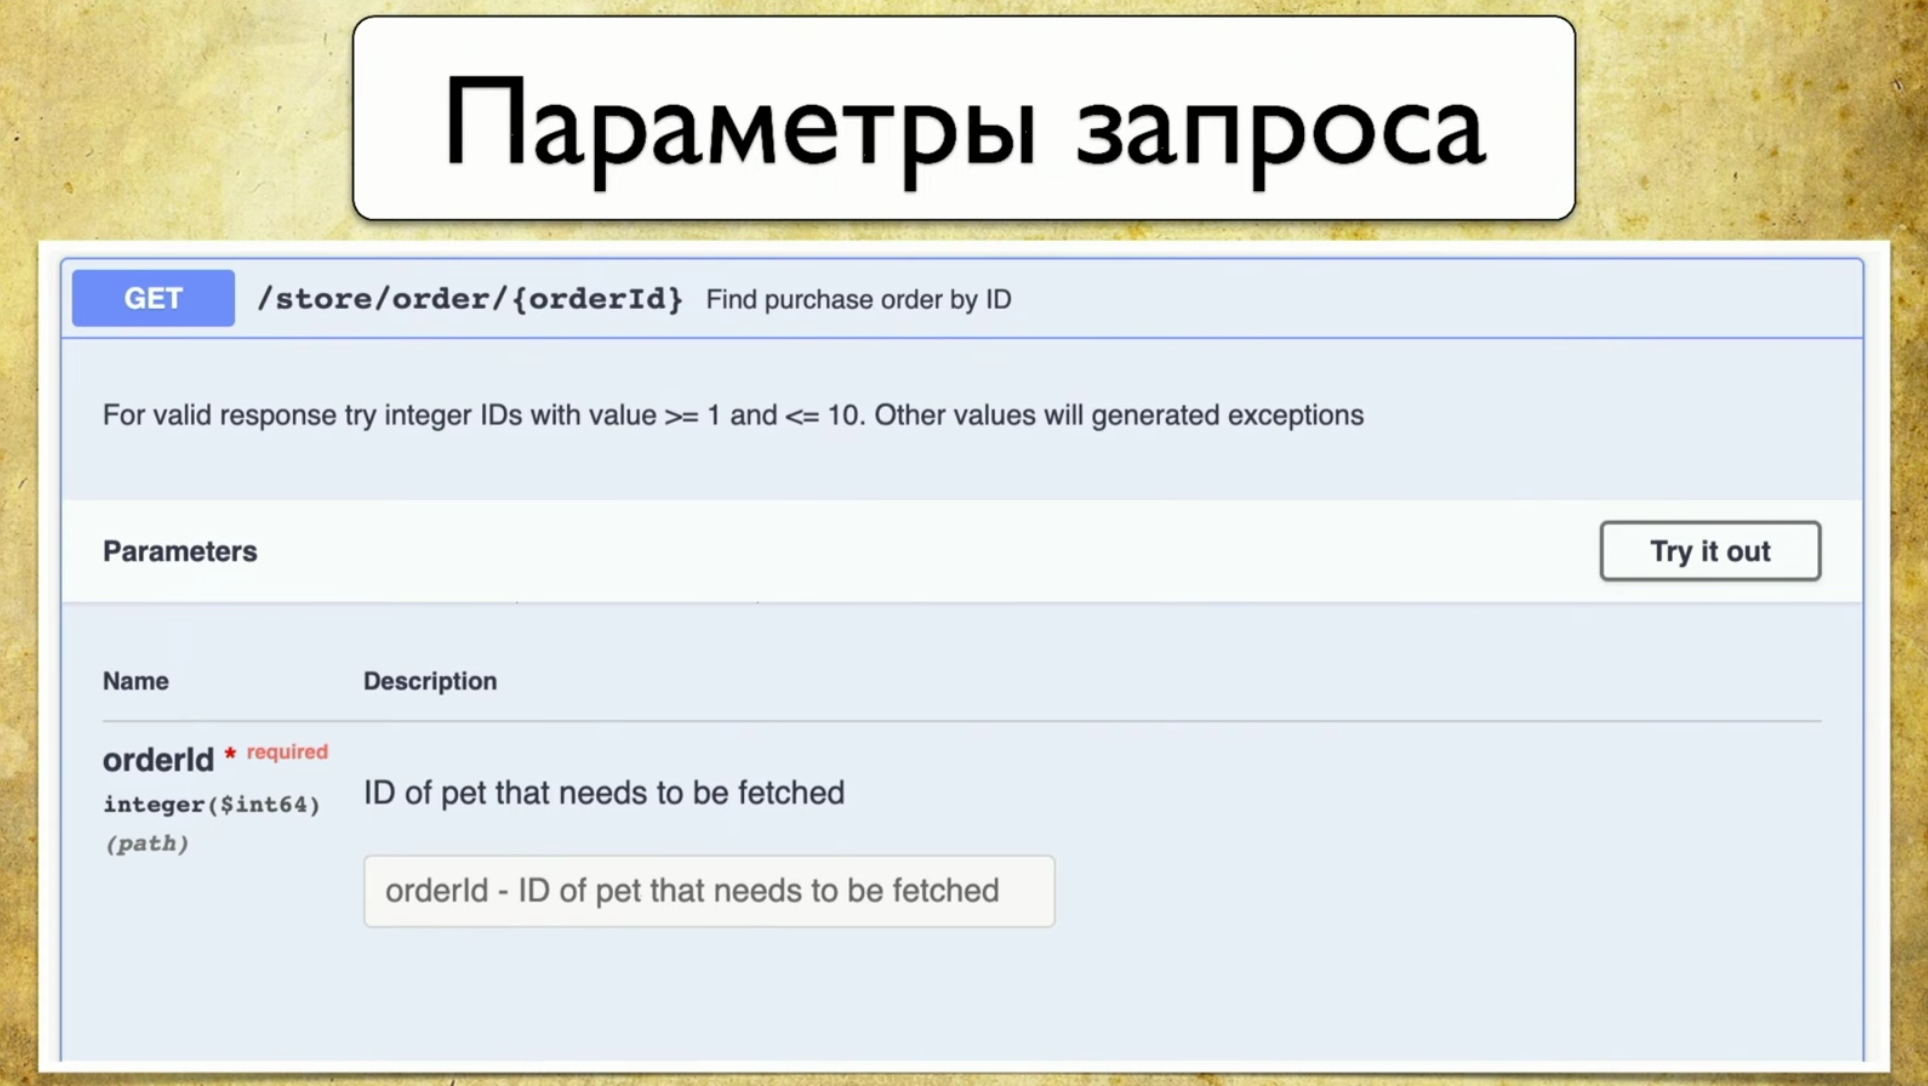
The principle of operation of Swagger is generation. It doesn’t matter which framework you use. Let's say Spring or Go Server, you use the Swagger Codegen component and generate swagger.json . This is some specification, on the basis of which a beautiful UI is then drawn.It is important for us that swagger.json is used : its support is available for all widely used languages.We have the Open API specification swagger.json . It looks like this: Requests look something like this: summary, description, response codes and a “handle” (path: / users). There is also information about the query parameter: everything is structured, there is a user ID parameter, it is in the path where there is required, such a description and type - integer.
 There are response codes, they are also documented:
 And the idea came to our mind: we have a service that Swagger generates, and we wanted to keep the same Swagger in the tests, so that we could compare them later. In other words, when the tests run, they generate exactly the same Swagger, we throw it at the Swagger Diff, we understand what parameters, handles, status codes we have checked, and so on. This is the same instrumentation, the same coverage, only finally in the requirements that we understand.
But what if you build a diff?
We turned to the Swagger diff library , which is what we need for this. Its principle of operation is something like this: you have version 1.0, with API version 1.1, they both generate swagger.json , then you throw them at Swagger diff and see the result.The result looks something like this: You have information that there is, for example, a new pen. You also have information about what is deleted. This means that it’s time to remove the tests, they are no longer relevant. With the appearance of information about changes, the parameters also change, so it is obvious that your tests will fall at that moment.We liked this idea, and we started to implement. As we decided to do: we have a “reference” Swagger that generates from the developer code, we also have API tests that will generate our Swagger, and we will diff between them.So, we run tests for the service: we have Rest Assured , which itself accesses the services on the API. And we instrument it. There is an approach: you can make filters, the request goes to it - and it saves the information about the request in the form of swagger.json directly for itself.Here is the whole code that we needed to write, there were 69-70 lines - this is a very simple code.
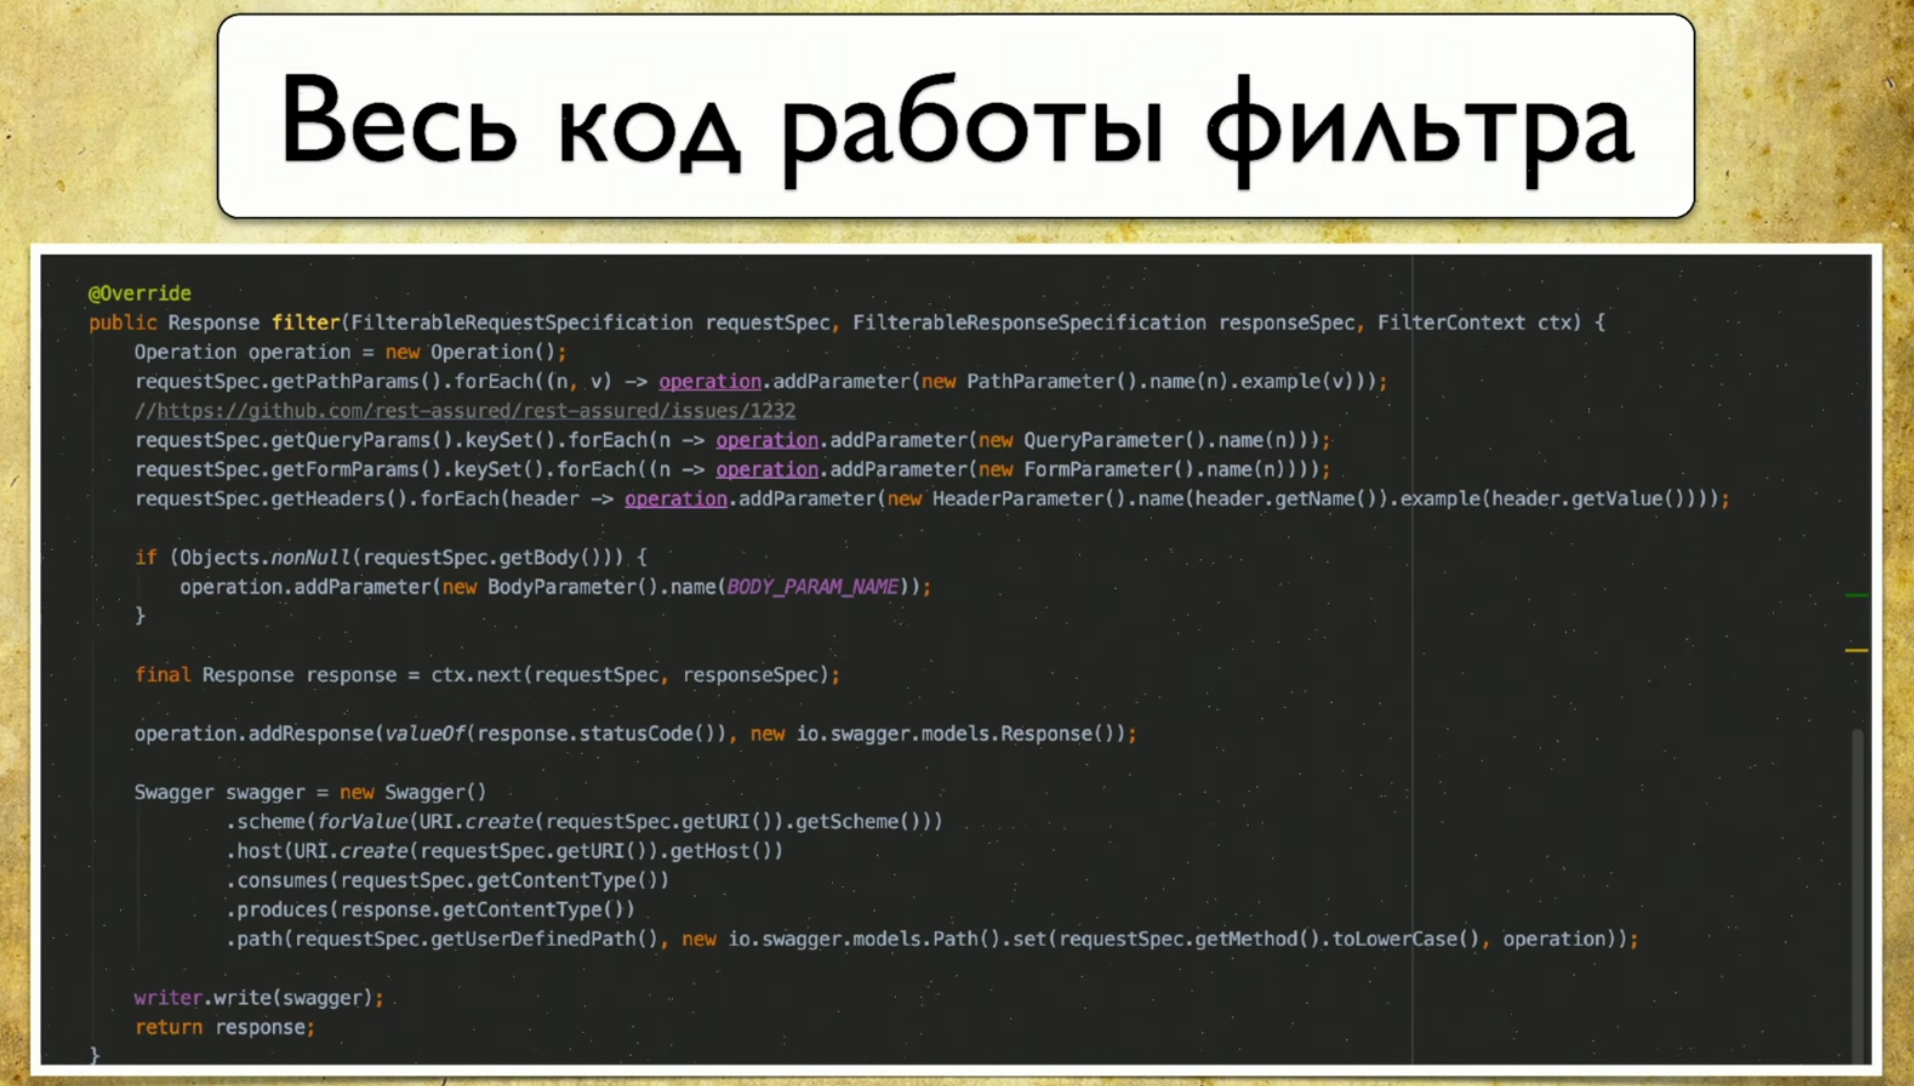 The funny thing is that we used the native client for Swagger, wrote right there. We didn’t even need to create our binaries, we just filled out the Swagger specification.
 We got a lot of .json files with which we had to do something - they wrote a Swagger aggregator. This is a very simple program that works according to the following principle:
- She meets a new request, if it is not in our database, she adds.
- She meets the request, he has a new parameter - adds.
- Same thing with status codes.
Thus, we get information about all the pens, parameters and status codes that we used. In addition, here you can collect data with which these requests were performed: username, logins, and so on. We have not yet figured out how to use this information, because everything is generated with us, but you can understand with what parameters certain requests were called.So, we were almost a stone's throw from the victory, but as a result we refused Swagger Diff, because it works in a slightly different concept - in the concept of differential.
Swagger Diff says what has changed, not what is covered, but we wanted to display the result of the coverage. There is a lot of extra data, it stores information about description, summary and other meta-information, but we do not have this information. And when we make Diff, they write to us that “this pen does not have a description”, but it didn’t exist.Own report
We made our implementation, and it works as follows: we have many files that came from autotests, we have the Swagger service API, and we generate a report based on it.A simple report looks like this: above you can see information on how many pens (349) in total, information on which are fully covered (each parameter, status code, and so on). You can choose your own criteria, for example, cover several parameters.There is also information here that 40% is partially covered - this means that we already have tests for these pens, but some things are not covered yet, and you need to look carefully there. Empty coverage is also reflected.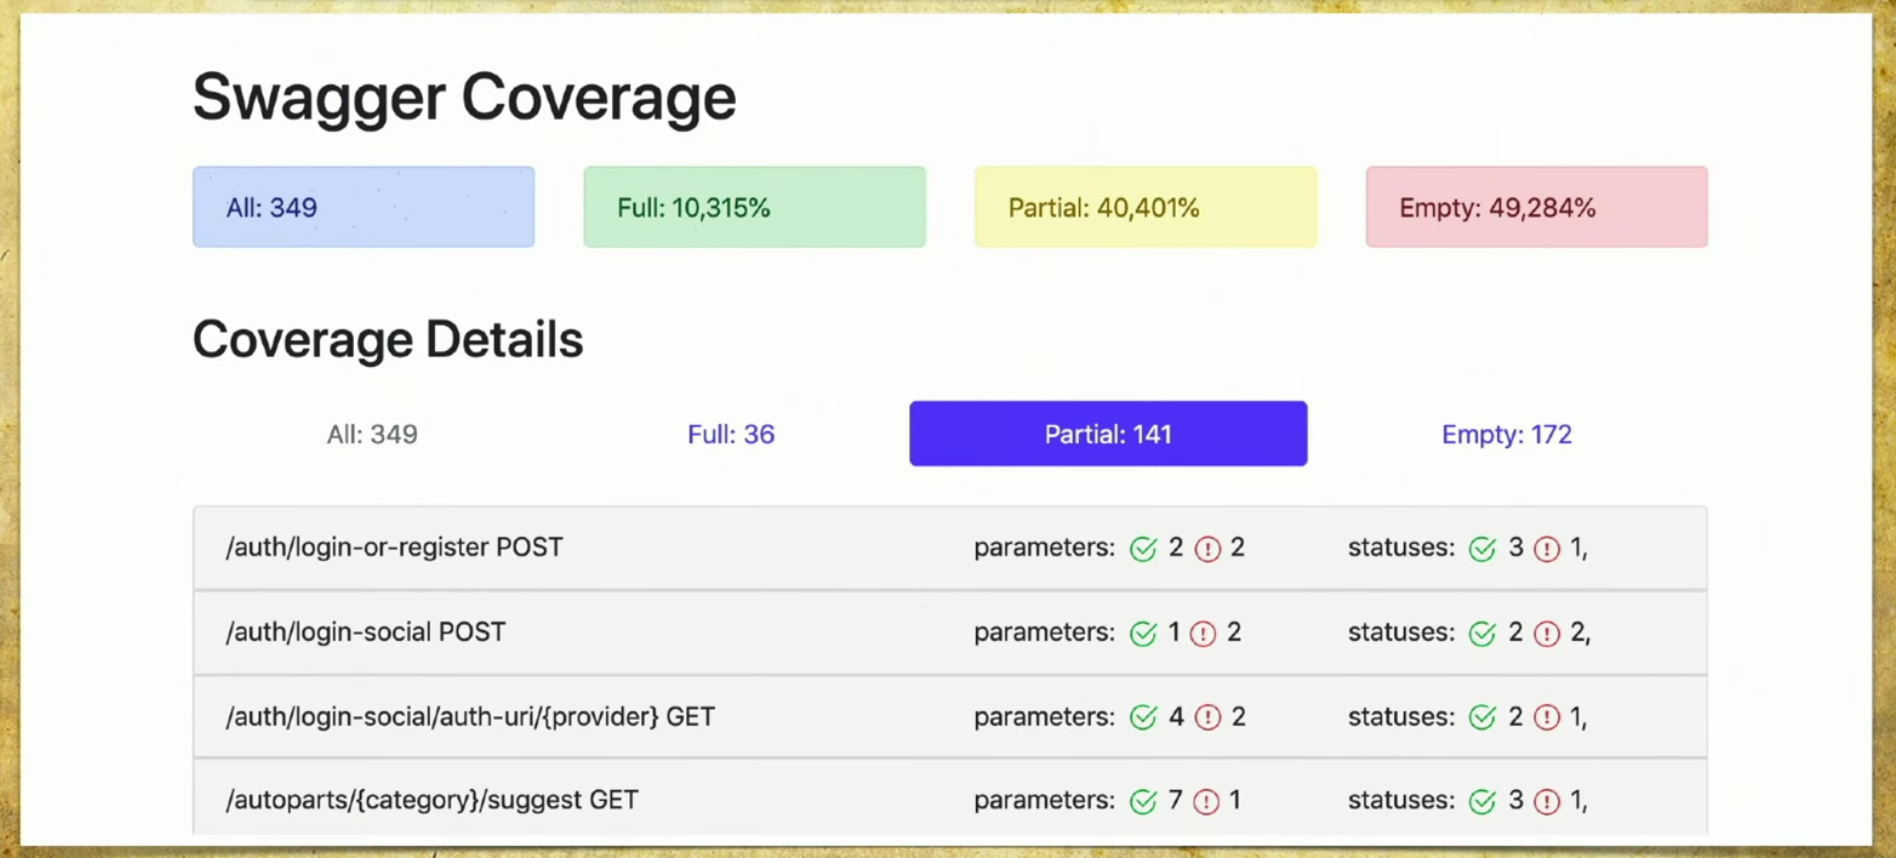 Let's go through the tabs. This is a full-coverage , we see all the parameters that we have, which are covered, status codes and so on.
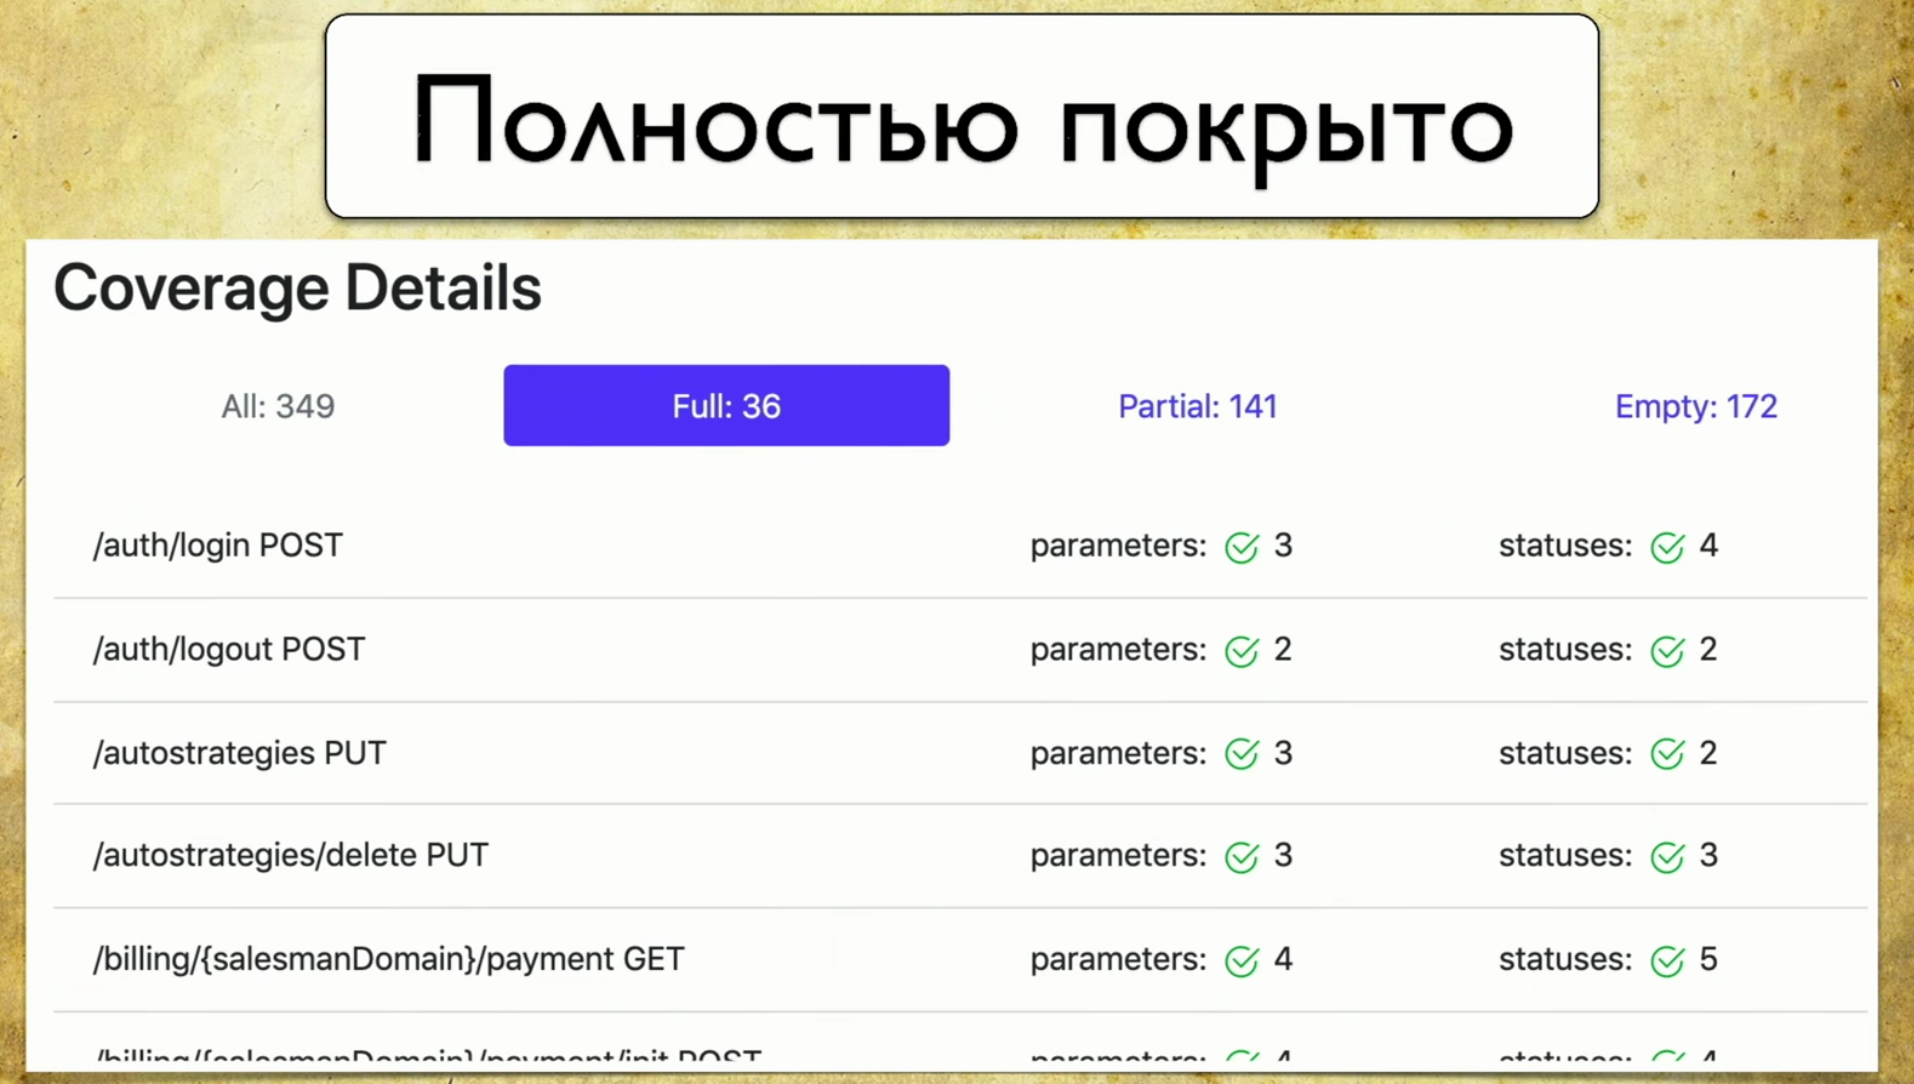 Then we have a partial coverage . We see that on the login-social handle one parameter is covered, and two are not. And we can expand it and see what specific parameters and status codes are covered. And at this moment it becomes very convenient for the developer: the versions of the application roll very quickly, and we often can forget some parameters.
 This tool allows you to always be in good shape and understand what we have partially covered, which parameter is forgotten, and so on.Last - Glory of shame, we still have to do it. When you look at this page and see Empty there: 172 - your hands drop, and then you start teaching hand testers how to write autotests, that’s the point.
What benefit did we get when we rolled out our solution?
First, we began to write tests more meaningfully. We understand that we are testing, and at the same time we have two strategies. First, we automate something that is not there when manual testers come and say that for a particular service it is critical that one request is executed at least once, and we open Empty.The second option - we do not forget about the tails. As I said, the APIs will be released very quickly, there may be some releases two or three times a day. Some parameters are constantly added there: in five thousand tests it is impossible to understand what is checked and what is not. Therefore, this is the only way to consciously choose a testing strategy and at least do something.The third profit is a fully automatic process. We have borrowed the approach, and automation works: we do not need to do anything, everything is collected automatically.Development ideas
Firstly, I really do not want to keep the second report, but I want to integrate it into Swagger UI. This is my favorite “Photoshop Edition report”: a chip I’ve been developing lately. Here immediately there is information about the parameters that we have tested and which are not. And it would be cool to give this information right away with Swagger.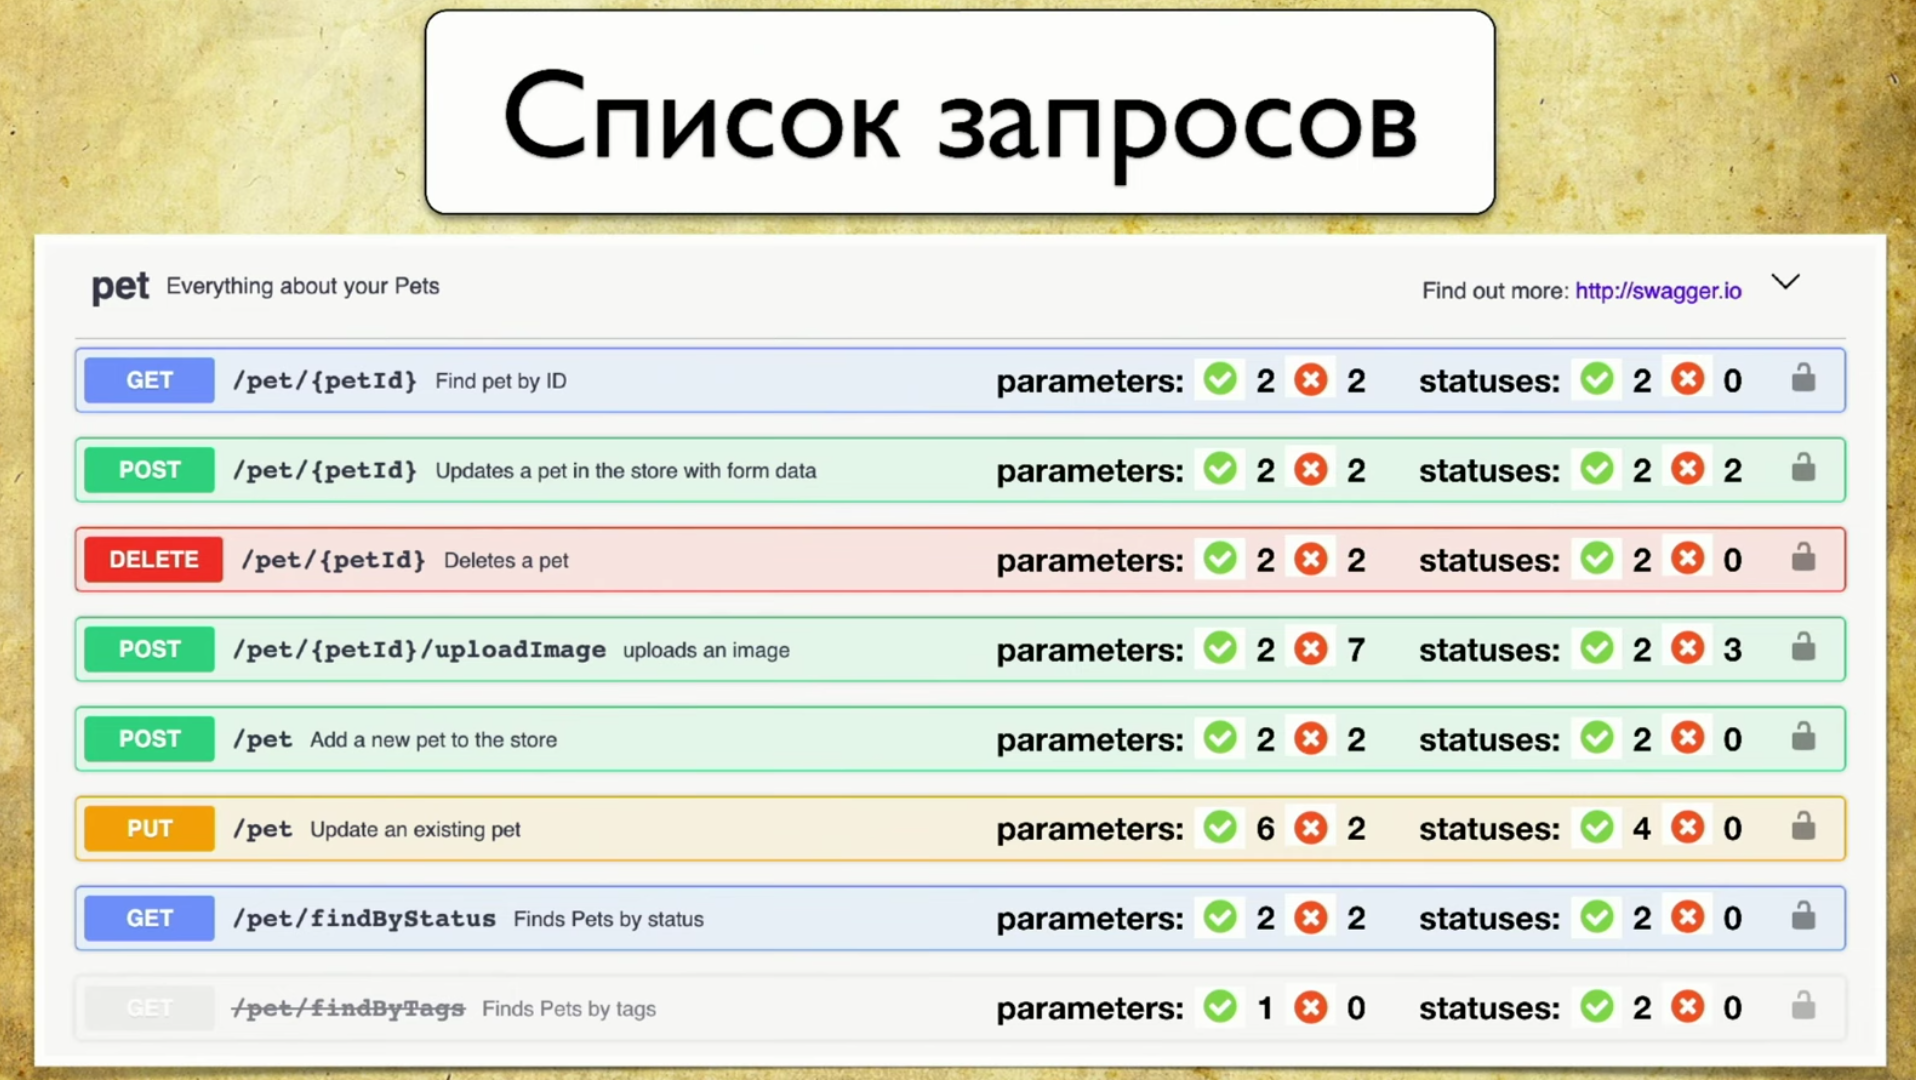 For example, the front-end can see for himself what parameters have not been tested, prioritize and decide that while they do not need to be taken into development, it is not known how well they work. Or the backend writes a new pen, sees red and kicks testers so that everything is green. This is quite easy to do, we are going in this direction.The second idea is to support other tools. In fact, I do not want to write filters for specific implementations: for Java, Python, and so on. There is an idea to make a kind of proxy that will pass all requests through itself, and save Swagger information for itself. Thus, we will have a universal library that can be used no matter what language you have.The third development idea is integration with Allure Report. I see it like this:
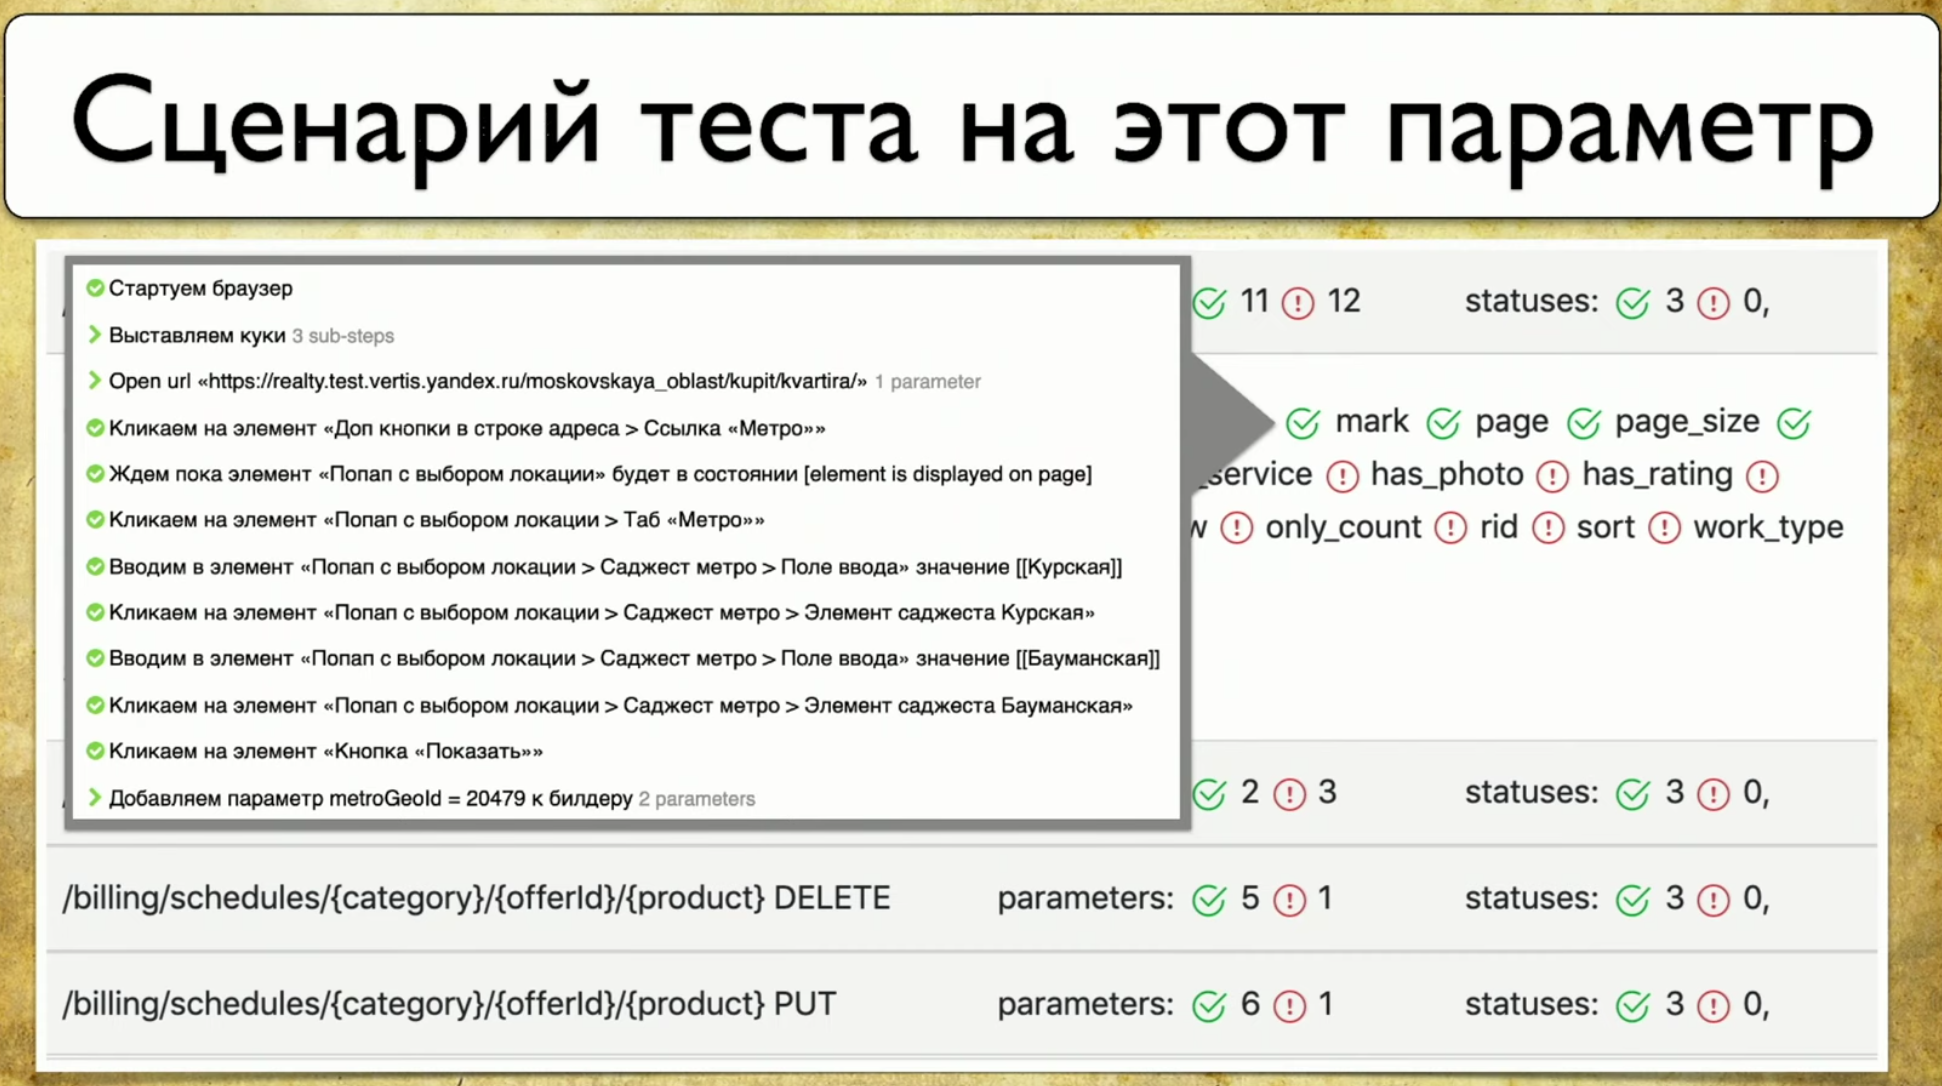 As a rule, when the parameter is “tested”, this does not always tell us how it is tested. And I want to point at this parameter and see the specific steps of the test.
Web Testing Coverage
The next point I want to talk about is coverage for Web tests. The coverage is based on the site you are testing, writing tests on the site. But you can make it a web interface to your coverage. For example, it will look like this: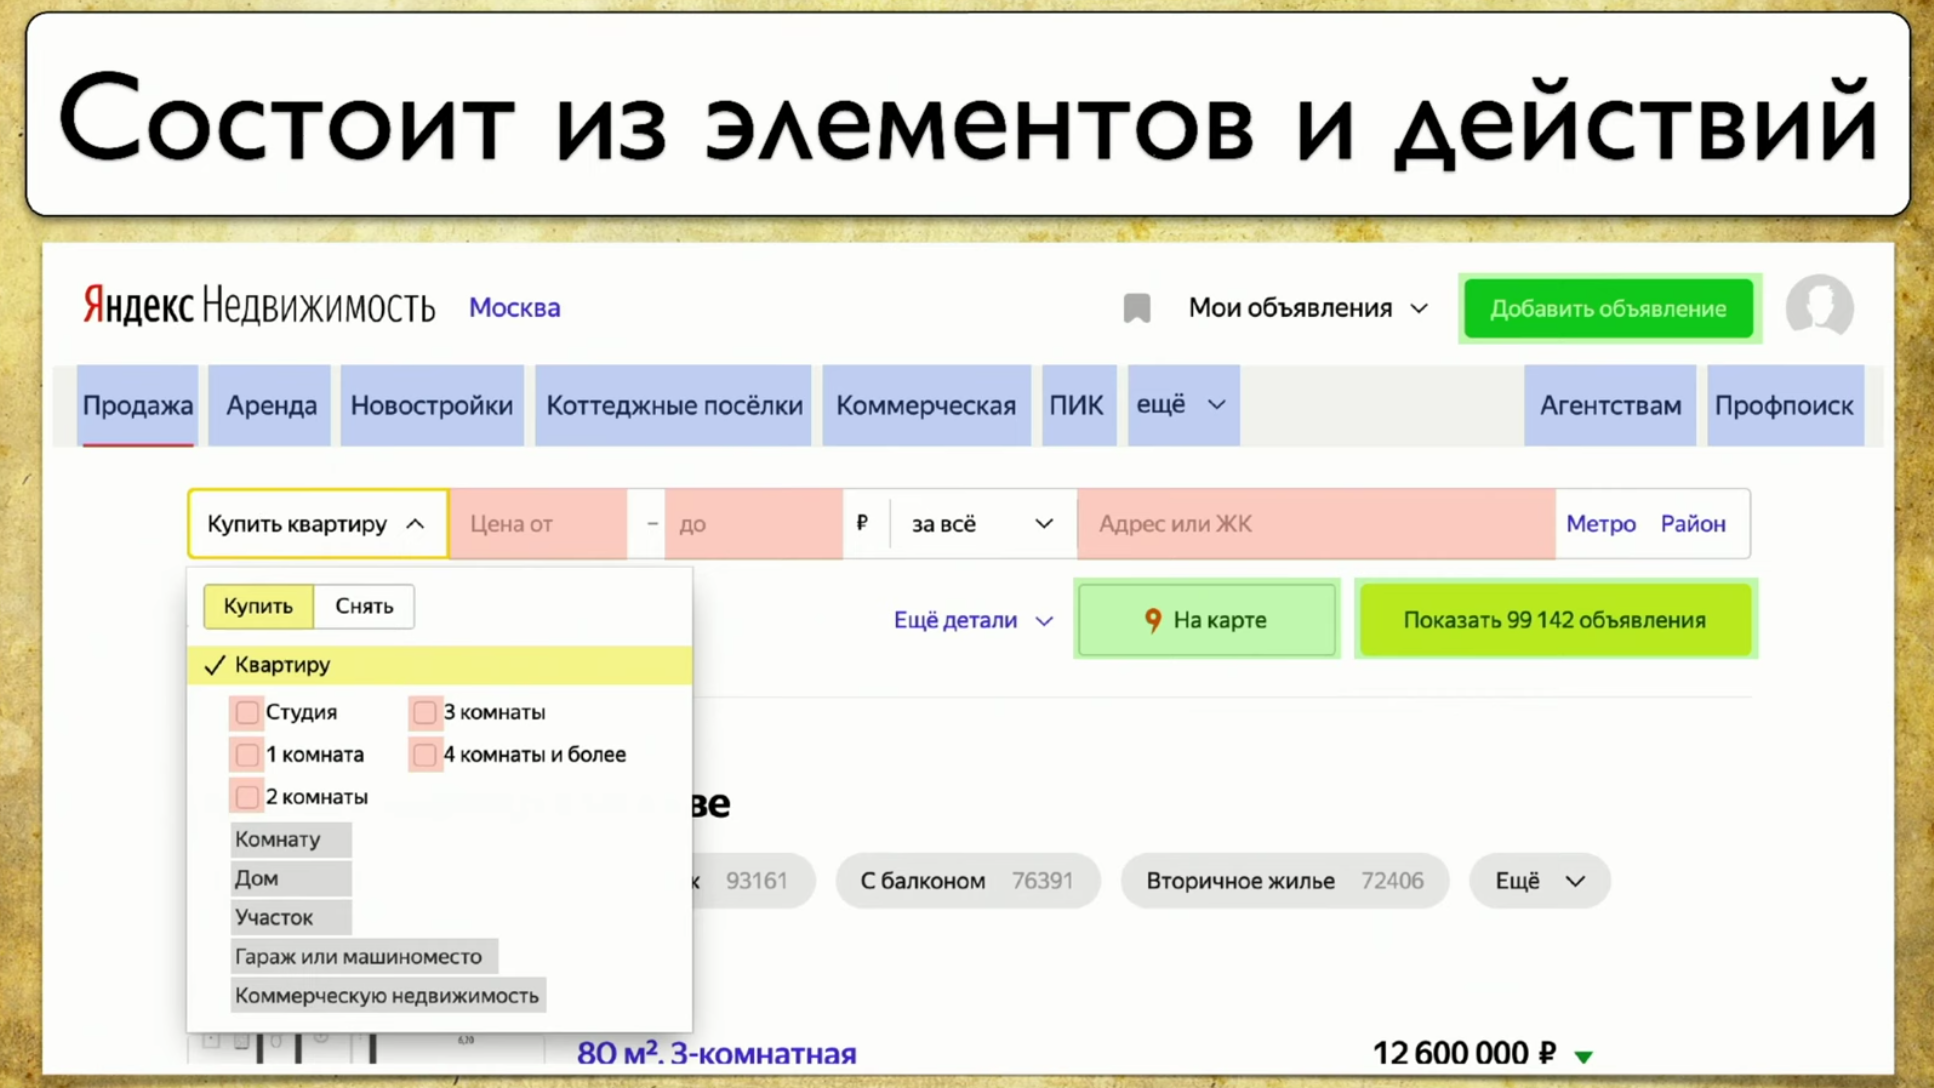 If you look at your site - this is some set of elements and ways to interact with them. This is a complete description: "an element is a way to interact with it." You can click on the link, you can copy the text, you can drive something into input. The site as a whole consists of elements and ways of their interaction:
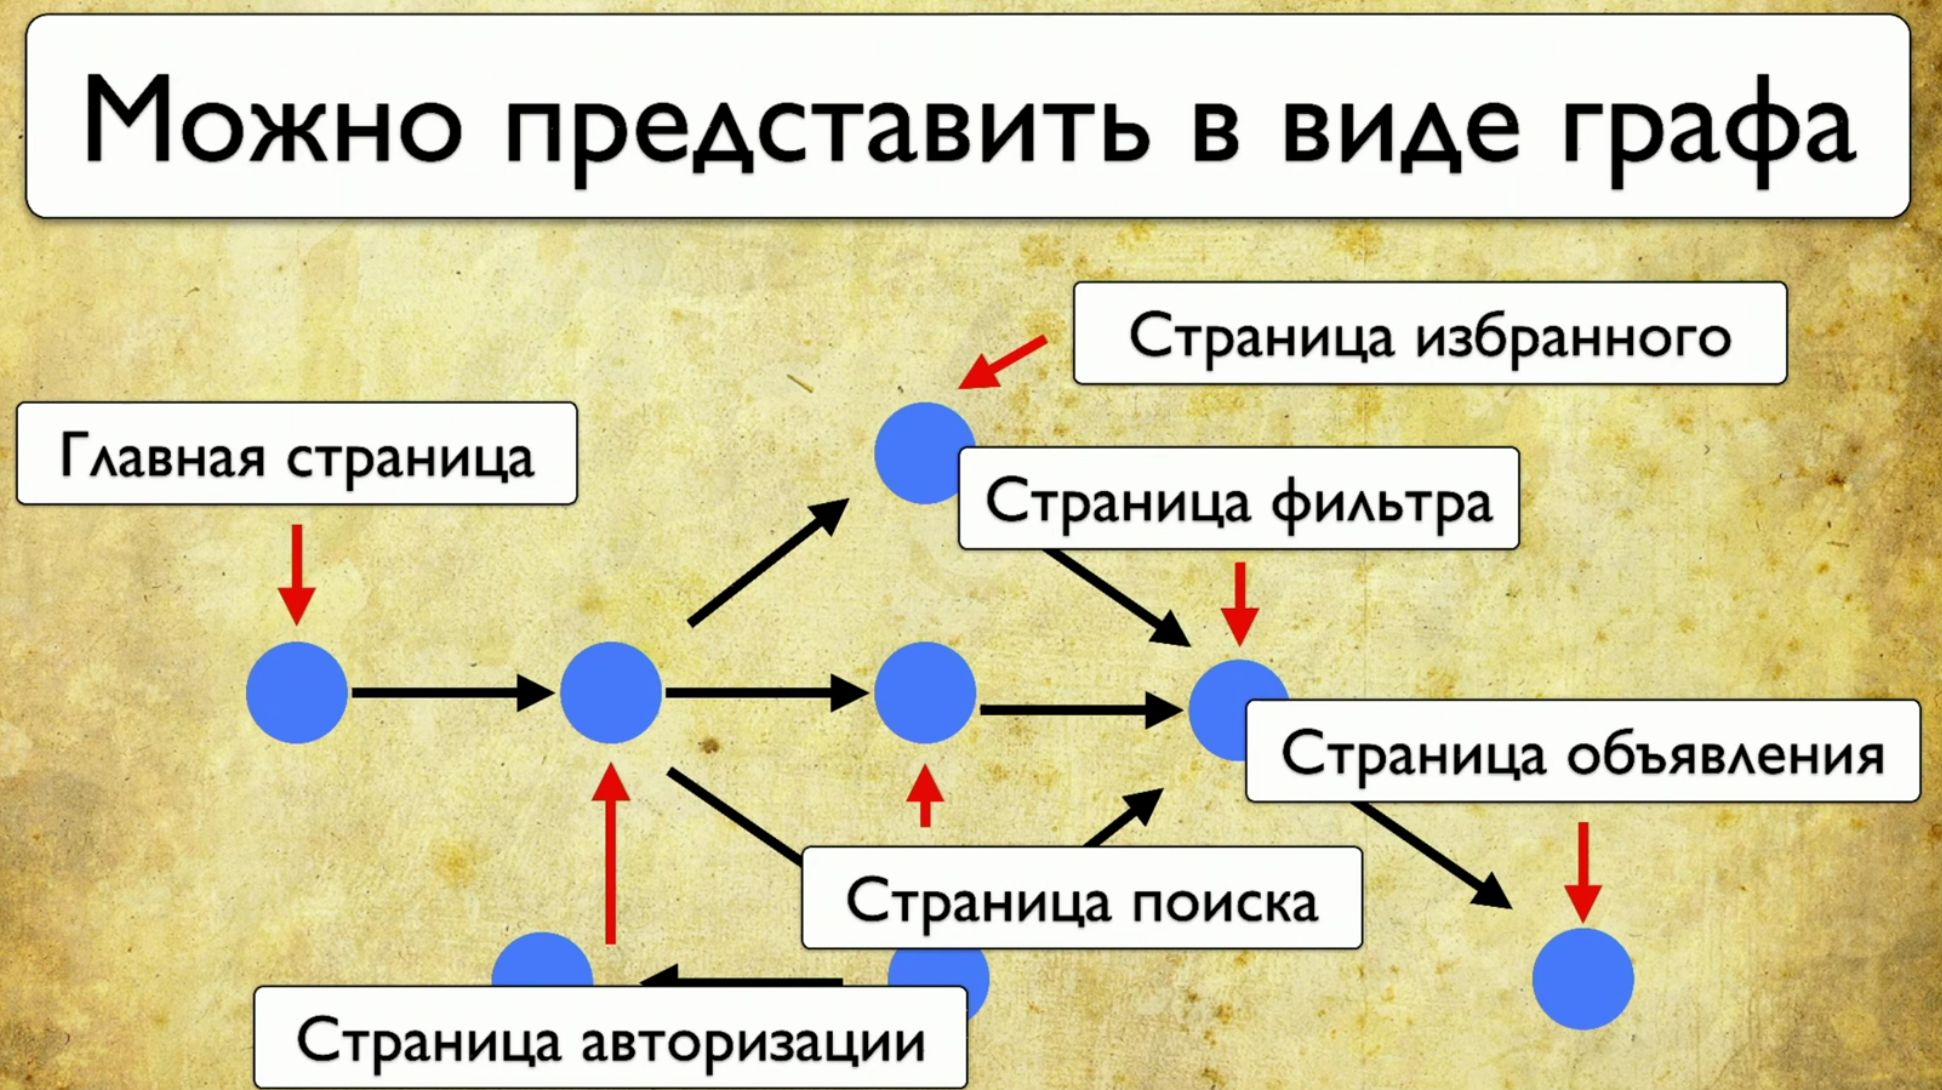 How tests run: they start from some point, then, for example, fill out some form, say, an authorization form, then scatter to other pages, then another to another and end .If the manager asks if a particular button is being tested, but this question is difficult to answer: you need to open the code or go to TestRail, then I want to see this solution to the problem:
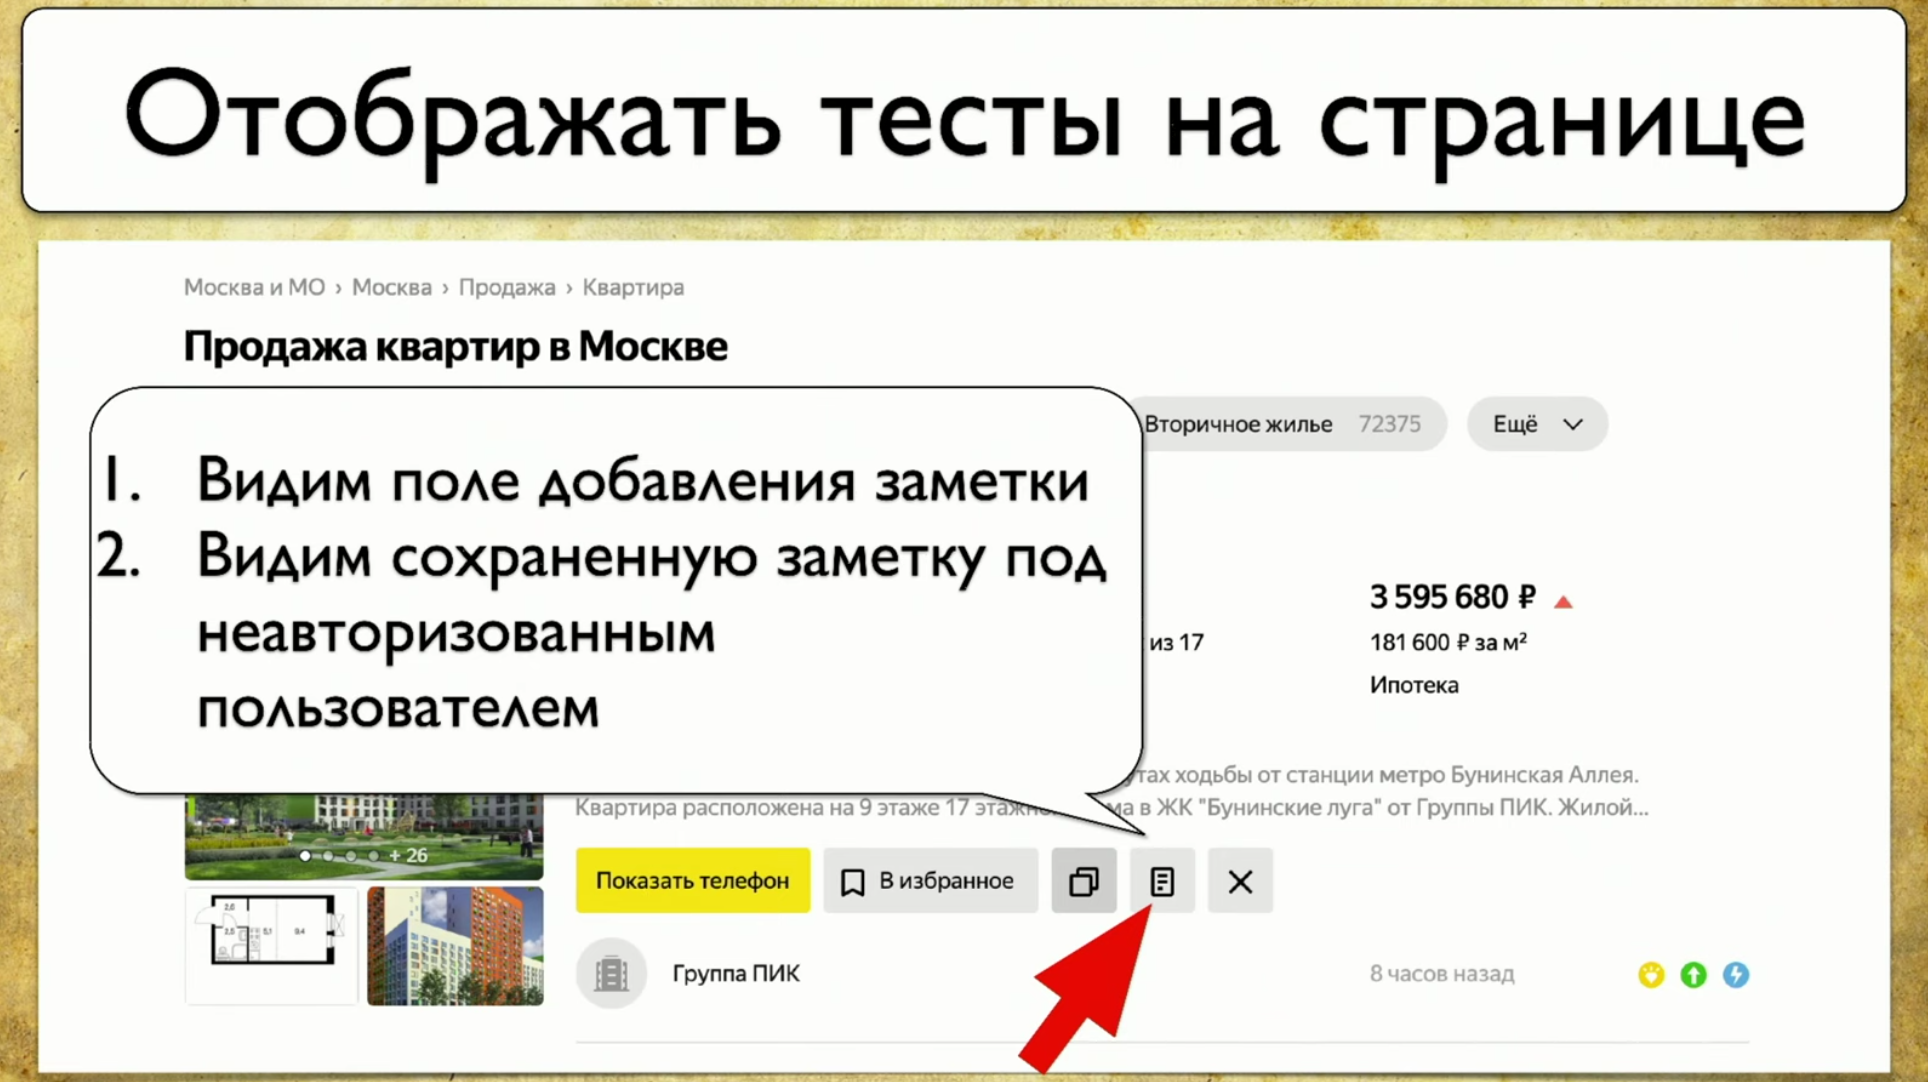 I want to point at this element and see all the tests that we have on this item. If there was such an instrument, I would be happy. When we started thinking about this idea, we first looked at Yandex.Metrica. They actually have roughly the same functionality as a link map. A good idea.The bottom line is that they are highlighted exactly as if they already give the information we need. They say: “Here we have passed this link 14 times”, which in translation into the testing language means: “14 tests were tested in this link” and somehow passed through it. But this red link took as many as 120 tests, what interesting tests!You can draw all sorts of trends, add meta-information, but what happens if we take it all and draw from the point of view of testing? So, we have a task: to point at some element and get a note with a list of tests.
 In order to implement this, you need to click on the icon, then write a note, and this is our whole test. We use Atlas at our place, and integration so far is only with it.Atlas looks something like this:
SearchPage.open ();
SearchPage.offersList().should(hasSizeGreaterThan(0));
We want at least one result to be displayed, otherwise we will not test it. Then we move the cursor to the element, then click on it.searchPage.offer(FIRST).moveCursor();
searchPage.offer(FIRST).actionBar().note().click();
Then we save in input User_Text and submit it.searchPage.offer(FIRST).addNoteInput().sendKeys(USER_TEXT);
searchPage.offer(FIRST).saveNote().click();
After that, we check that the text is exactly the one that should have been. searchPage.offer(FIRST).addNoteInput().should(hasValue(USER_TEXT));
Tests run in a browser, Atlas is a proxy for this test, we apply the same approach here that everyone uses when collecting coverage: we will make a locator with .json. We will save there information about all page openings, all iterations with elements, who submitted, who did sendkey, who click, which IDs and so on - we will keep a complete log.Then we attach this log to Allure in the form of each test, and when we have a lot of locators.json , we generate meta.json . The scheme is the same for all elements.We have a plugin for Google Chrome. We wanted to make a decision in the form of a plugin. I specially made a curve screenshot so that one important detail was visible on the slide - path to locators.json . If you generated a report now, then there is a coverage map for today. If you take the report for the previous two weeks and paste it here, a coverage map for the period two weeks ago will appear. You have a time machine!However, when you plug in this plugin, it draws a not-so-friendly interface.
 Each element has a number of tests that pass through it: it is clear that 40 tests pass through “buy an apartment”, header is tested one test at a time, it's cool, and the “apartment” option is also displayed. You get a complete coverage map.If you hover over some element, it will take the data and print your real tests from your tms, Allure Board and so on. The result is complete information about what is being tested and how.Please note that from each test you can fail directly in the Allure report.
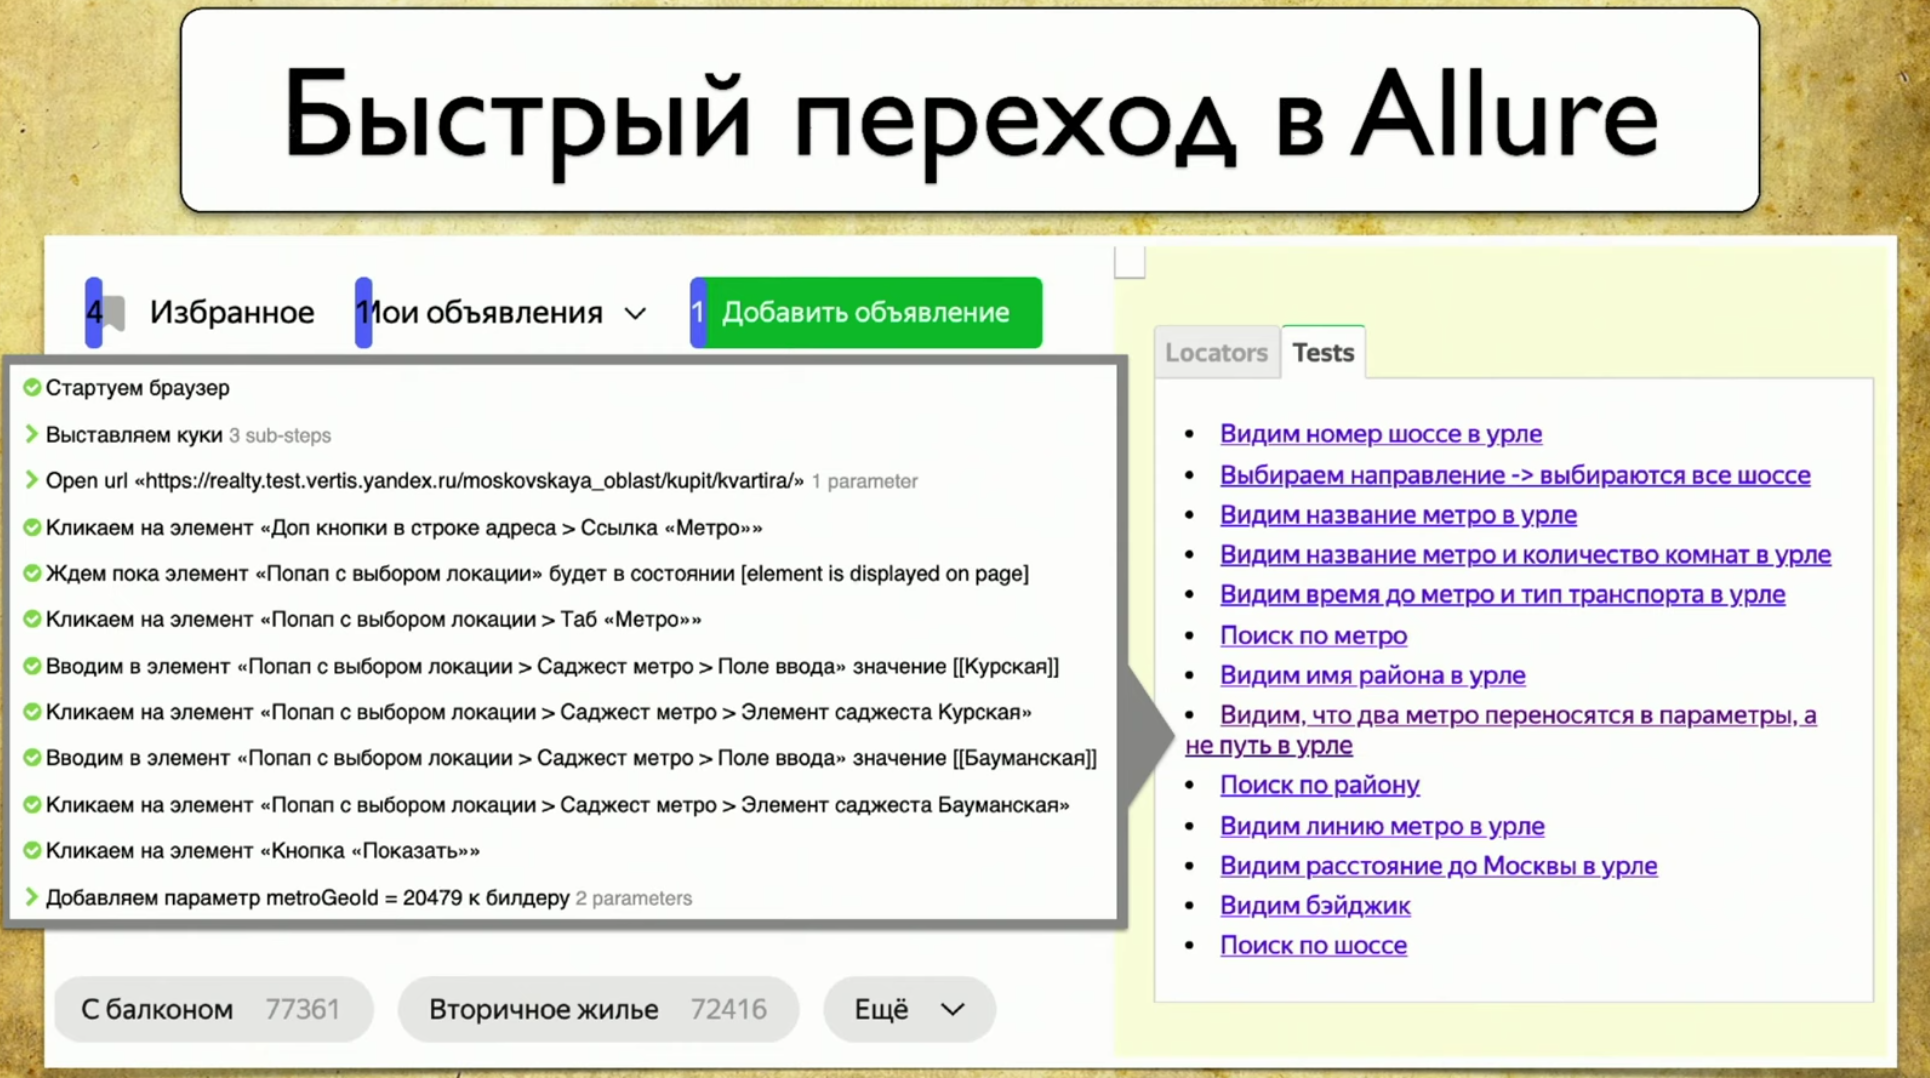 When you open any thing, it loads new selectors: if you have any tests that go through these selectors and you did something with the site, it will process and show the whole picture.
What is the profit?
As soon as we implemented this simple approach, then, mainly, we began to understand what we tested in tests.
Now anyone can go in and find any "thread" that leads to the script. For example, you assume that you need to test the payment. Payment, obviously, leads through the payment button: click - all the tests that go through the payment button appear. This is good! You go into any of them and view the script.Moreover, you understand what has been tested before. We generate a static file, you can specify the path to it and indicate which tests were two weeks ago. If the manager says that there is a bug in production and asks if we tested this or that functionality a couple of weeks ago, you take the Allure report, say, for example, that you didn’t test it.Another profit is the review after testing automation. Before that, we had a review before testing automation, now you can do your tests exactly as you see them. If you wanted to do a test - done, took some branch, launched Allure, dropped the link to the plug-in to a manual tester and asked to see the tests. This is exactly the process that will allow you to strengthen the Agile strategy: team lead makes code review, and manual testers do your tests (scripts).Another advantage of this approach is the frequently used elements. If we override this block, in which there are 87 tests, then all of them will fall. You begin to understand how flack your tests are. And if the block “price from” is overturned, then it’s okay, one test will fall, a person will correct it. If you change the block with 87 tests, then the coverage will sag considerably, because 87 tests will not pass and will not check any result. This block needs increased attention. Then you need to tell the developer that this block must be with an ID, because if it leaves, everything will fall apart.
How can you develop further?
For example, you can follow the path of developing support for other tools, for example, for Selenide. I would even like to support not a specific Selenide, but a driver implementation that will allow you to collect locators, regardless of the tool you use. This proxy will dump information and then display it.Another idea is to display the current test result. For example, it’s convenient to immediately throw such a picture to a manual tester: You don’t have to think which tests broke, because you can go to the site, click on the test and pass it by hand without checking other tests. This is easy, you can pick up this information from Allure and draw it right here.You can also add the Total Score, because everyone loves graphics, because I want to deal with duplicate tests that are very similar to each other, whose central part is the same, and the beginning and tail have changed a bit.
 I would also like to immediately see the number of duplicate selectors. If it is high, then on this page you need to do refactoring and run tests, otherwise they will fall in too large a bundle. The same goes for the number of elements we interacted with. This is some common symptom. However, as soon as you interact with the page, the figure will skip due to new elements and the total number of test cases, so you need to add some kind of analytics, it will not be superfluous.You can also add the distribution of tests by layers, because you want to see not just that we have these tests, but all the types of tests that are on this page, possibly even manual tests.Thus, if there are Java tests and tests on Puppeteer that another team writes, we can look at a specific page and immediately say where our tests intersect. That is, we will speak the same language with them, and we will not need to collect this information bit by bit. If we have a tool that shows everything in the web interface, then the task of comparing tests in Java and Puppeteer no longer seems unsolvable.Finally, let's talk about the general strategy. We have already talked about what types of coverage are, named two, came up with a third type of coating, which we used as a result. So we just took and looked at this problem from a different angle.
On the one hand, there is coverage that has been kicked since 1963, on the other hand, there are manual testers who are used to living in a more real world than code. It remains only to combine these two approaches.
Those interested can always join our community. Here are two repositories of our guys that deal with the coverage problem: