Let's see how Angular Schematic works from the inside using the VS Code debugger.
Debugging and step-by-step code execution is an important part of our developer work. We quickly find out if our code is working, it is easier to get rid of errors. Running the debugger and running tests for each specific case in it should be the main part of the work when checking our code.
Debugging also provides an opportunity to see how the code works, especially someone else’s code. Which is very useful when working with schematics. As Angular developers, we use schematicsas part of the Angular CLI, creating our projects, services, components, etc. and don’t think about how it all works.
However, understanding the essence of the work schematicshelps not only to experience a sense of appreciation towards those who created all this, but also makes it possible to create your own schemes. And in this article we will learn how to schematicsdebug, i.e. configure Visual Studio Code to debug node.js applications and join the debugged process
Running Angular Schematic is running a program on node.js called schematics. Well, to get started, we need to create a project.
Tools and Training
First, create a schematic project with help schematic-cli, you need to make sure that such a package exists in our environment. We put it globally
npm install -g @angular-devkit/schematics
npm install -g @angular-devkit/schematics-cli
This tool allows you to create new schematic projects. To get acquainted, run a command in the terminal schematics.
schematics
schematics [CollectionName:]SchematicName [options, ...]

By default, if the collection name is not specified, use the internal collection provided
by the Schematics CLI.

Options:
    --debug             Debug mode. This is true by default if the collection is a relative
                        path (in that case, turn off with --debug=false).

    --allowPrivate      Allow private schematics to be run from the command line. Default to
                        false.

    --dry-run           Do not output anything, but instead just show what actions would be
                        performed. Default to true if debug is also true.

    --force             Force overwriting files that would otherwise be an error.

    --list-schematics   List all schematics from the collection, by name. A collection name
                        should be suffixed by a colon. Example: '@schematics/schematics:'.

    --verbose           Show more information.

    --help              Show this message.
If you apply the option, --list-schematicswe see a list of schemes from the internal collection, it is provided by default.
schematics --list-schematics
blank
schematic
If you choose schematic- it will create a sample collection with three schemes - it is recommended to look at them to figure it out.
(To create a project, remove --dry-run)
schematics schematic --name=schematics-debugged --dry-run
schematics . , , schematics ( ). , .
schematics
npm run build
npm run test
, schematics node.js . , schematic , name .
<program> [arguments...]
VS Code launch.json . . — node.js - Launch Program. node.js , .. schematics.js @angular-devkit/schematics-cli, bin.
@angular-devkit/schematics-cli , . program js . ${workspaceFolder}, , .
npm install -D @angular-devkit/schematics-cli
:
type: node.
request: launch.
name: ,
program: , .. ${workspaceFolder}/node_modules/@angular-devkit/schematics-cli/bin/schematics.js
args: args. , (package.json collection.json), , path, workspace.
outFiles: .
It turns out:
{
    "version": "0.2.0",
    "configurations": [
        {
            "type": "node",
            "request": "launch",
            "name": "Launch Program",
            "program": "${workspaceFolder}/node_modules/@angular-devkit/schematics-cli/bin/schematics.js",
            "args": [
                ".:my-full-schematic",
                "--name=hello"
            ],
            "outFiles": []
        }
    ]
}
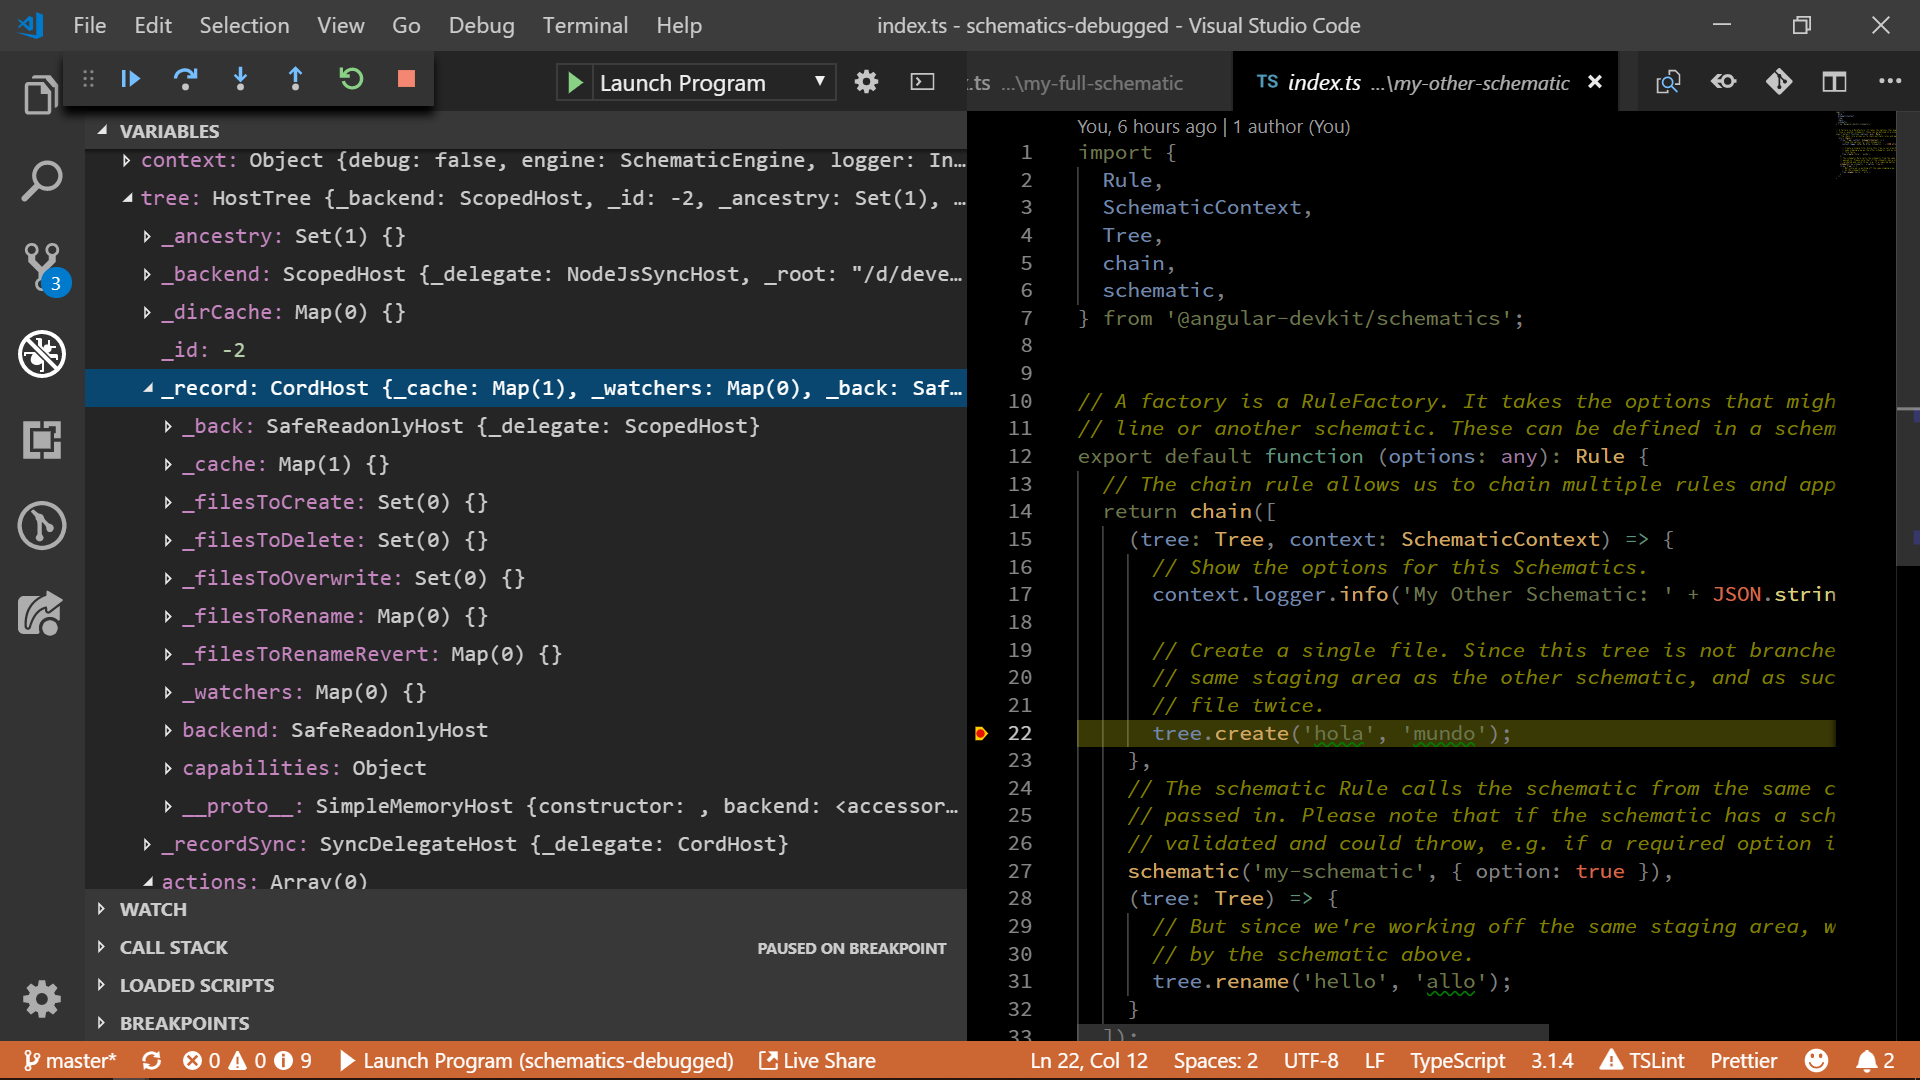
Open the method factory. Usually he's in index.ts. Add a breakpoint.
Press F5, debugging should start and stop at the installed breakpoint.
Now you can look into all the secrets Schematicsor look inside the Tree and meditate on the entire inner kitchen.
If you liked the article, there are also Angularlicious Podcast podcasts.
Related materials:
Node.js debugging
Visual Studio Code Debugging