Hello, Habr! I present to you heed translation of an article from APC magazine.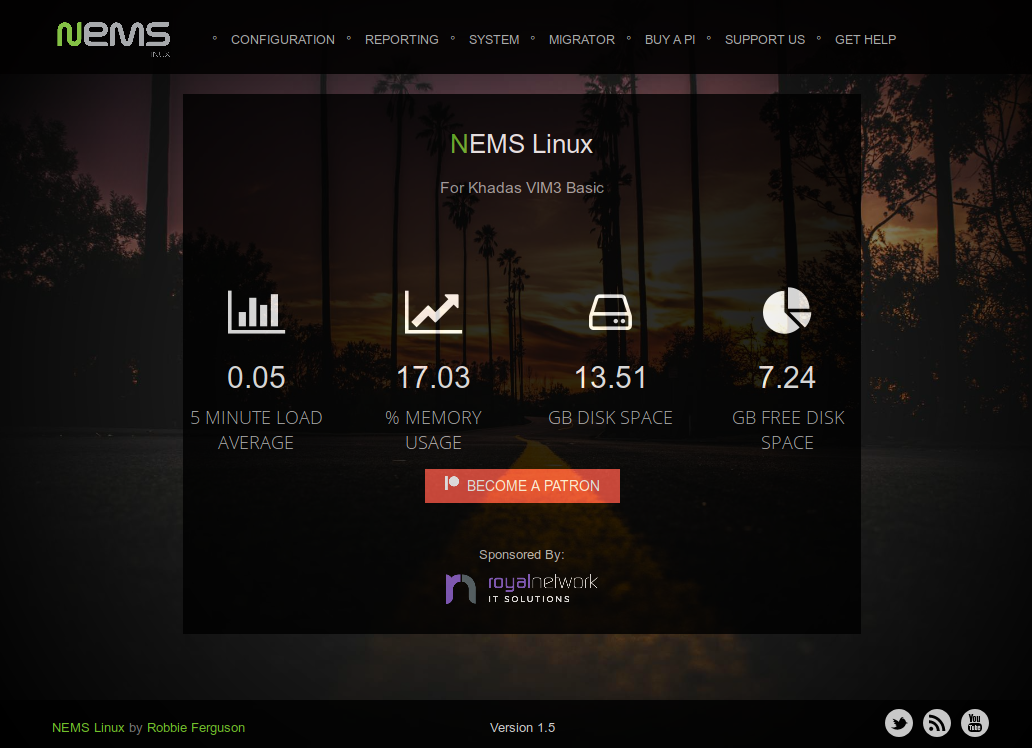 Network security is essential to ensure the integrity of your data and hardware. Undoubtedly, a firewall on the router and software protection tools are necessary, however, to know more about what is happening on the network, you need to have a tool to monitor and control it.It may seem that a network monitoring tool that sends signals to a computer about an attempted hack is just an element of the plot of a science fiction film, but such a tool does occur in reality. In essence, this means that you can quickly find out when devices located within your network were disconnected from the Internet (for example, applications for smart home or the Internet of things) and detect an unauthorized connection to your router or network hardware. All you need is a Raspberry Pi single board computer and Nagios.Nagios, like the Raspberry Pi single-board computer, is available in several versions. For ease of understanding, two options for installing the program will be considered here: creating a disk image and manual installation on the current OS.NEMS (Nagios Enterprise Monitoring Server) is the Nagios enterprise monitoring server, it is installed on the Raspberry Pi and is available at: bit.ly lxf253nems. It will require a memory card with a capacity of at least 16 GB, but it is best to choose 32 GB. It is recommended to use the Raspberry Pi 3B + for operation, although any version other than the Raspberry Pi1 Model A and the Raspberry Pi Compute Module is suitable. Note that the NEMS package can only be downloaded via BitTorrent. However, other Nagios disk images are freely available. After downloading the package, use the tool to create a disk image and write IMG files to the SD card.Once NEMS is ready to run on a single board computer, connect the Raspberry Pi to the router via an Ethernet cable. Although the server can work via Wi-Fi, Ethernet is still a more reliable means for monitoring the network. Insert the SD card, launch the Raspberry Pi and wait for the NEMS setup to complete. The process will automatically resize the file system, so the initial download will take longer than usual. Using the Secure Shell Protocol (SSH), connect to NEMS using nemsadmin as your username and password.Then enter the command:
sudo nems-init
After that, the installation of NEMS will begin. At this stage, you will need to perform regional settings, select the encoding method, create an account and add an e-mail address to which notifications will come. To do this, open the nems.local link in the browser on your desktop (or use the IP address of the Raspberry Pi) to start the configuration.Manual installationAlternatively, you can install Nagios manually on any Raspberry Pi operating system, such as Raspbian. For best results, start with a clean OS installation, then start an SSH session. To do this, first upgrade the databases:sudo apt update && sudo apt upgrade
Reboot device:sudo reboot
Then install Nagios:sudo apt install nagios3
Wait for the dialog box to create an administrator account, create and write down the password, because you will need it later. This process does not take much time. After that, you will access Nagios from another device through the IP address 192.168.1.10/nagios3 . Use the nagiosadmin username and password created earlier when required.Network Monitoring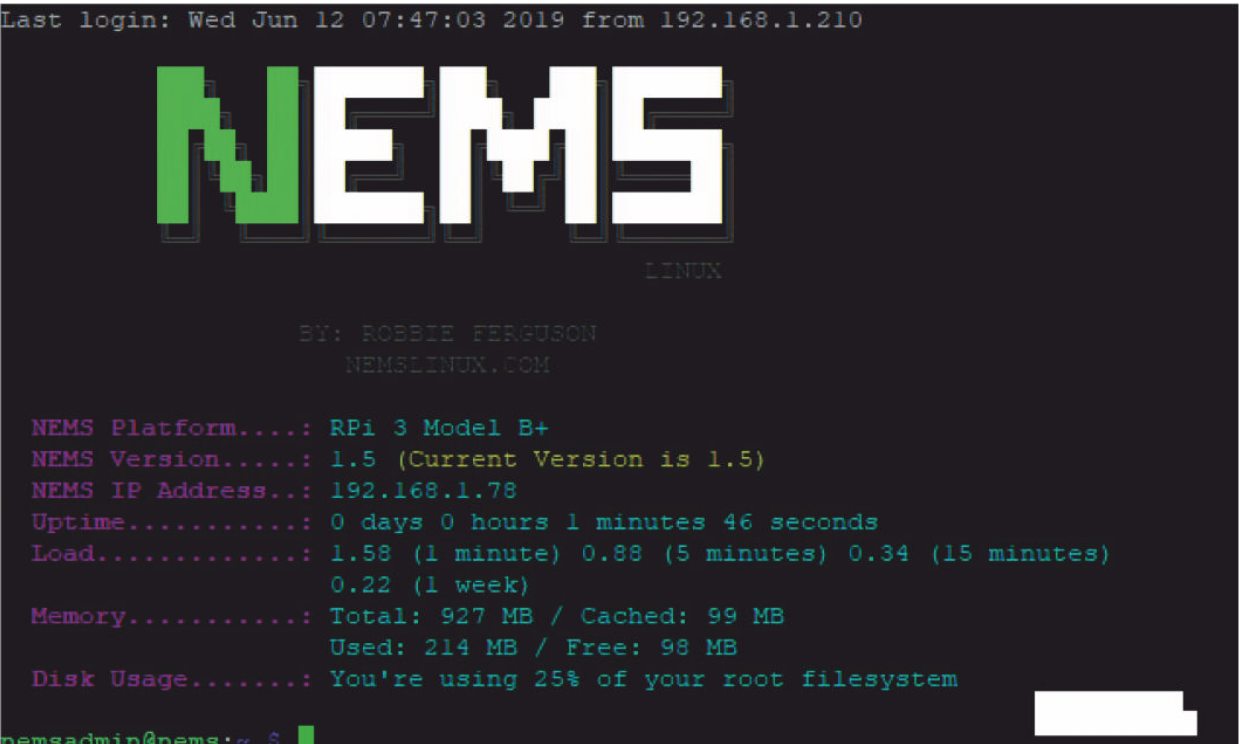 After installing Nagios on the Raspberry Pi, you will get a continuous monitoring system ready to run. It remains only to customize it to your needs. If the program was installed manually, the host is configured through the terminal. To do this, create a configuration file. For example, let's call it monitor.cfg :
sudo nano /etc/nagios3/ conf.d/monitor.cfg
Add the details of the device you want to track to it. Let's say you have a Minecraft server on a Raspberry Pi. Enter the following commands:define host {
use generic-host
host_name minecraft
alias minecraft
address 192.168.1.22
}
The generic-host command here is a template. It can be found in the generic-host_nagios2.cfg folder . Templates are used to save time when creating an installation for a monitoring session on the device. To do this, you only need to create multiple entries based on the given definition and change the host_name (name of the computing node), alias (additional name), and address (IP address) of the device you want to monitor.Press Ctrl-X to save the changes and exit, then restart Nagios:sudo service nagios3 reload
If there are problems during the configuration process, you need to check the server for errors using the command:sudo /usr/sbin/nagios3 -v / etc/nagios3/nagios.cfg
She will check the correctness of the configuration files. After that, do not forget to restart Nagios.Typically, network monitoring is done through a browser. A tab can be left open indefinitely. Remote monitoring can also be started on the Raspberry Pi desktop via VNC (Remote Computer Management System).In addition to the terminal, Nagios is configured through a web browser. You only need to open the setup menu and the NEMS configurator, and then add the node description with the same credentials that were required for manual installation, and the necessary notifications.Use the Reports menu section to monitor Nagios. The external part of the program can be presented in two versions: the modernized Adagios user interface and the Nagios Core interface created several years ago. Both are fully operational.Nagios features are great, so it’s worth the time to familiarize yourself with the program’s functionality, add devices, check network activity logs, enable visualization, etc. If you use NEMS, you can easily configure the host through the browser interface way.That's it - your Raspberry Pi with Nagios installed is ready for network monitoring. It will work in the background and will notify you of any problem with the connection of equipment and suspicious activity within your network.