When Facebook “lies”, people think it is because of hackers or DDoS attacks, but it is not. All “falls” over the past few years have been caused by internal changes or breakdowns. In order to teach new employees not to break Facebook with examples, all major incidents are given names, for example, “Call the Cops” or “CAPSLOCK”. The first one was named because when one day the social network fell, users called the Los Angeles police and asked to fix it, and the sheriff in despair on Twitter asked not to bother them about this. During the second incident on the cache machines, the network interface went down and did not rise, and all the machines restarted by hand.Elina Lobanovahas been working on Facebook for the last 4 years on the Web Foundation team. Team members are called production engineers and monitor the reliability and performance of the entire backend, put out Facebook when it is on, write monitoring and automation to make life easier for themselves and others. In an article based on Elina's report on HighLoad ++ 2019 , we’ll show how production engineers monitor the Facebook backend, what tools they use, which causes major crashes and how to deal with them.My name is Elina, almost 5 years ago I was called on Facebook as an ordinary developer, where for the first time I came across really highly loaded systems - this is not taught at institutes. The company does not hire a team, but an office, so I arrived in London, chose a team that monitors the work of facebook.com and was among production engineers.
Production Engineers
To begin, I’ll tell you what we are doing and why we are called Production Engineers, and not SRE like Google, for example.2009. SRE
The standard model that is still used in many companies is "developers - testers - operation". Often they are divided: they sit on different floors, sometimes even in different countries, and do not communicate with each other.In 2009, Facebook already had SRE. At Google, SRE started earlier, they know how to achieve DevOps, and have written it in their book “ Site Reliability Engineering ”. On Facebook in 2009, there was nothing like this. We were called SRE, but we did the same work as Ops in the rest of the world: manual labor, no automation, deployment of all services with your hands, monitoring somehow, oncall for everything, a set of shell scripts.
2010. SRO and AppOps
This all did not scale, because the number of users at that time was growing 3 times per year, and the number of services grew accordingly. In 2010, the strong-willed decision Ops was divided into two groups.The first group is SRO , where “O” is “operations”, engaged in the development, automation and monitoring of the site.The second group is AppOps , they were integrated into teams, each for large services. AppOps is already close to the idea of DevOps.Separation for a while saved everyone.2012. Production Engineers
In 2012, AppOps simply renamed production engineers . In addition to the name, nothing has changed, but it has become more comfortable. As you call a yacht, it will sail, and we did not want to sail like Ops.SROs still existed, Facebook was growing, and monitoring all services at once was hard. A person who was oncall was not even allowed to go to the toilet: he asked someone to replace him, because he was constantly burning.2014. Closing SRO
At one point, the authorities transferred everyone to oncall. “Everyone” means that developers too: write your code, here you are and answer for this code!Production engineers have already been integrated into the most important teams for help, and the rest are out of luck. We started with large teams and in a couple of years transferred everyone on Facebook to oncall. Among the developers there was great excitement: someone quit, someone wrote bad posts. But everything calmed down, and in 2014 the SRO was closed because they were no longer needed. So we live to this day.The word “SRE” in the company is notorious, but we look like SRE on Google. There are differences.- We are always built into teams. We do not have SRE search in general, as in Google, it is for each search service separately.
- We are not in the products , only in the infrastructure the product manages itself.
- We are oncall together with the developers.
- We have a little more experience in systems and networks, so we focus on monitoring and extinguish services when they burn brightly. We fix errors in advance that could lead to crashes and influence the architecture of new services from the very beginning, so that they later work smoothly in production.
Monitoring
It's the most important. How do we do this? Like everyone: without black magic, in their own, home. But the devil, as usual, will tell you about them in detail.ATOP
Let's start from the bottom. Everyone knows TOP in Linux, and we use ATOP, where “A” is “advanced” - a system performance monitor. The main benefit of ATOP is that it stores history: you can configure it to save snapshots to disk. Our ATOP runs on all machines every 5 seconds.Here is an example server running the PHP backend for facebook.com. We wrote our virtual machine to execute PHP code, it is called HHVM (HipHop Virtual Machine). According to exported metrics, we found that several machines did not process almost a single request in one minute. Let's see why, open ATOP 30 seconds before it hangs. It can be seen that with the processor problems, we load it too much. There is also trouble with memory, only 1.5 GB are left in the cache, and after 5 seconds only 800 MB.
 After another 5 seconds, the CPU is freed, nothing is executed. ATOP says look at the bottom line, we write to disk, but what? Turns out we are writing swap.
 Who is doing this? Processes that were taken from memory 0.5 GB and put in swap. In their place came two suspicious Python processes, which can then be viewed as a command line.
ATOP is beautiful, we use it constantly.
If you do not have it, I highly recommend using it. Do not be afraid for the drive, ATOP eats only 200-300 MB per day every 5 seconds.Malloc HTTP
To the Bahamas and the big incidents, we give names. There is one fun bug related to ATOP called Malloc HTTP. We debuted it with ATOP and strace.We use Thrift everywhere as an RPC. In the early versions of its parser there was an amazing bug that worked like this: a message arrived in which the first 4 bytes is the size of the data, then the data itself, and the first bytes are added to the next message.But once one of the programs rather than to go to the Thrift service, I went to HTTP, and received a response «the HTTP Bad the Request»: HTTP/1.1 400.After it took HTTP and allocated using malloc HTTP the number of bytes.Thrift message
HTTP/1.1 400
"HTTP" == 0x48545450
It's okay, we have overcommit, let's allocate more memory! We allocated with malloc, and until we write and read there, they will not give us real memory.But it was not there! If we want to fork, the fork will return an error - there is not enough memory.malloc("HTTP")
pid = fork(); // errno = ENOMEM
But why, is there a memory? Understanding the manuals, we found that everything is very simple: the current overcommit configuration is such that it is a magic heuristic, and the kernel itself decides when a lot and when not:malloc("HTTP")
pid = fork(); // errno = ENOMEM
// 0: heuristic overcommit
vm.overcommit_memory = 0
For a working process, this is normal, you can select malloc up to TB, but for a new process - no. And part of the monitoring at us was tied to the fact that the main process forked small scripts for data collection. As a result, our monitoring part broke down, because we could no longer fork.FB303
FB303 is our basic monitoring system. It was named after the 1982 standard bass synthesizer. The principle is simple, therefore, it still works: each service implements the Thrift getCounters interface.
Service FacebookService {
    map<string, i64> getCounters()
}
In fact, he does not implement it, because the libraries are already written, everything is done in the code incrementor set.incrementCounter(string& key);
setCounter(string& key, int64_t value);
As a result, each service exports counters on the port that it registers with Service Discovery. Below is an example of a machine that generates a news feed and exports about 5.5 thousand pairs (string, number): memory, production, anything. Each machine runs a binary process that goes through all the services around, collects these counters and puts them in storage.This is what the storage GUI looks like .
 Very similar to Prometheus and Grafana, but it is not. The first FB303 entry on GitHub was in 2009, and Prometheus in 2012. This is an explanation of all the “do-it-yourselfers” of Facebook: we did them when there was nothing normal in Open Source.For example, there is a search for the names of counters.
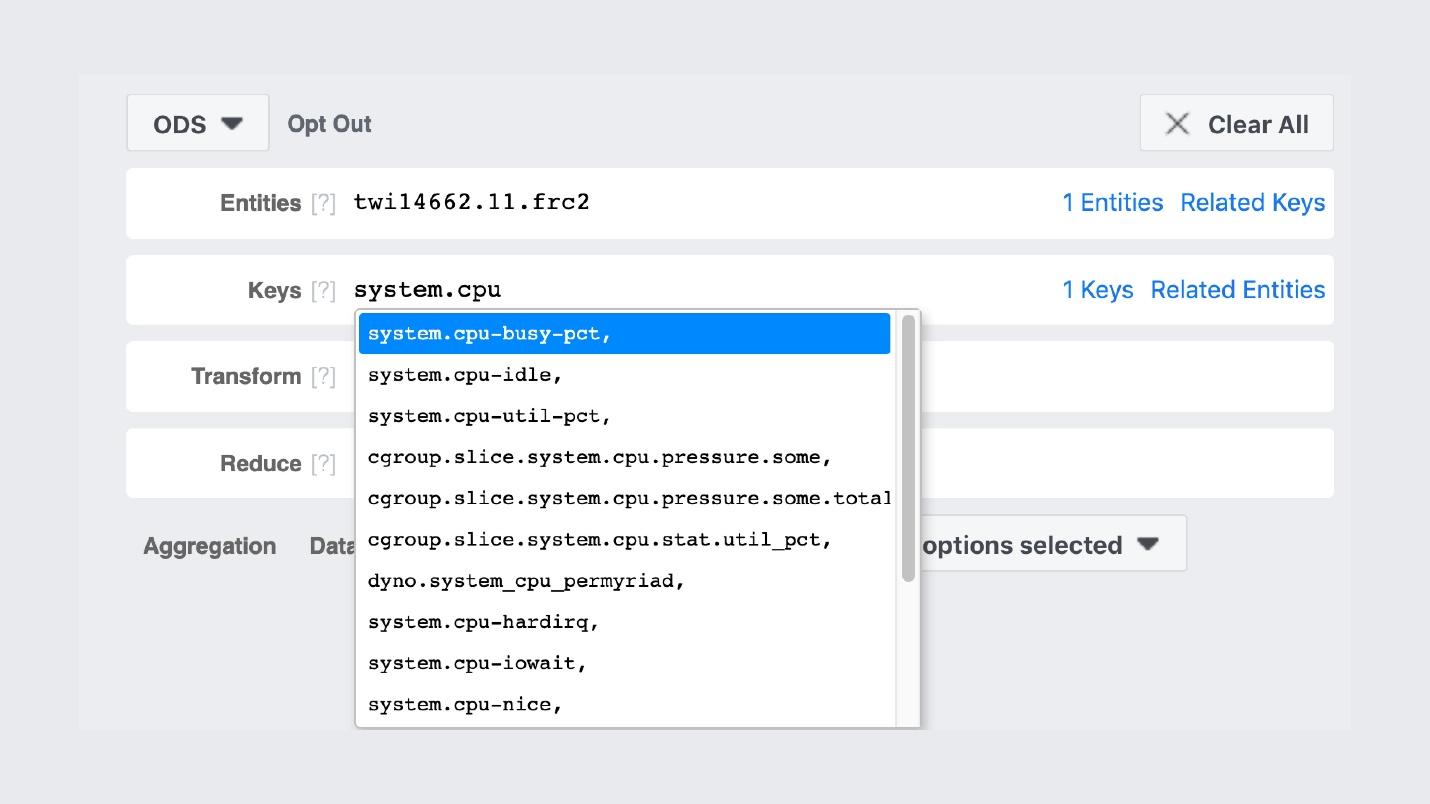 The graphs themselves look something like this.
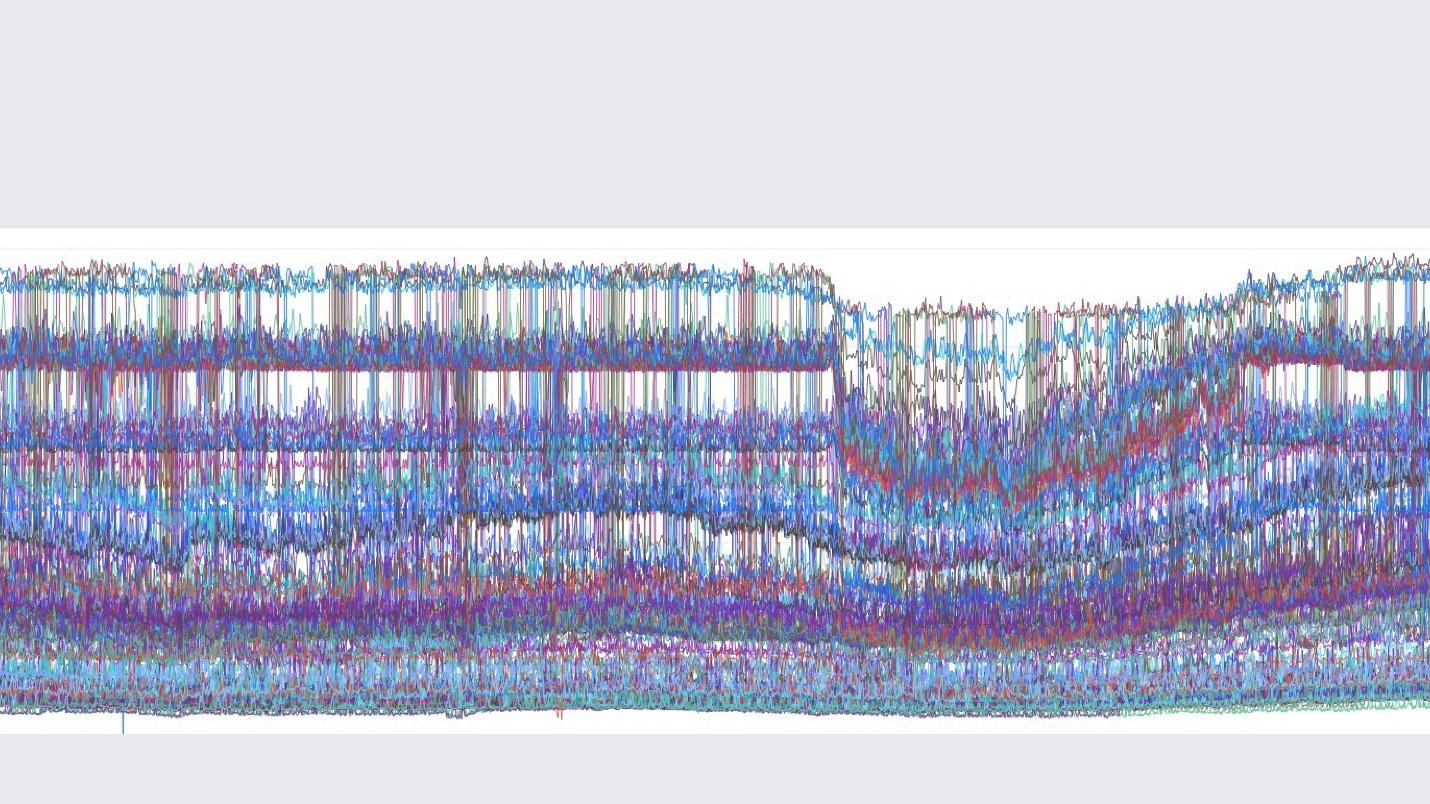 A picture from the inner group in which we post beautiful graphics.An important difference between our monitoring stack and Prometheus and Grafana is that we store data forever . Our monitoring will re-sample the data, and after 2 weeks we will have one point for every 5 minutes, and after a year for every hour. Therefore, they can be stored so much. Automatically this is not configured anywhere.But if we talk about the features of monitoring Facebook, then I would describe it with one English word “ observability” .
Observability
There is a "black box", there is a "white box", and we have a glass transparent "box". This means that when we write code, we write everything that is possible in the logs, and not selectively. Sampling is well tuned everywhere, so the backend for storage, counters and everything else lives fine.At the same time, we can build our dashboards already on existing counters. In the case of studying these dashboards, this is not the end point with 10 graphs, but the initial one, from which we go to our UI and find everything there that is possible.Scuba
This is the climax of the idea of observability. This is our ELK stack. The principle is the same: we write in JSON without a specific scheme, then we request in the form of a table , time series of data, or 10 more visualization options.Scuba logs in the order of hundreds of gigabytes per second. Everything is requested very quickly, because it is not Elasticsearch, and everything is in memory on powerful machines. Yes, money is spent on it, but how wonderful it is!For example, below Scuba UI, one of the most popular tables is opened in it, in which all clients of all Thrift services write logs.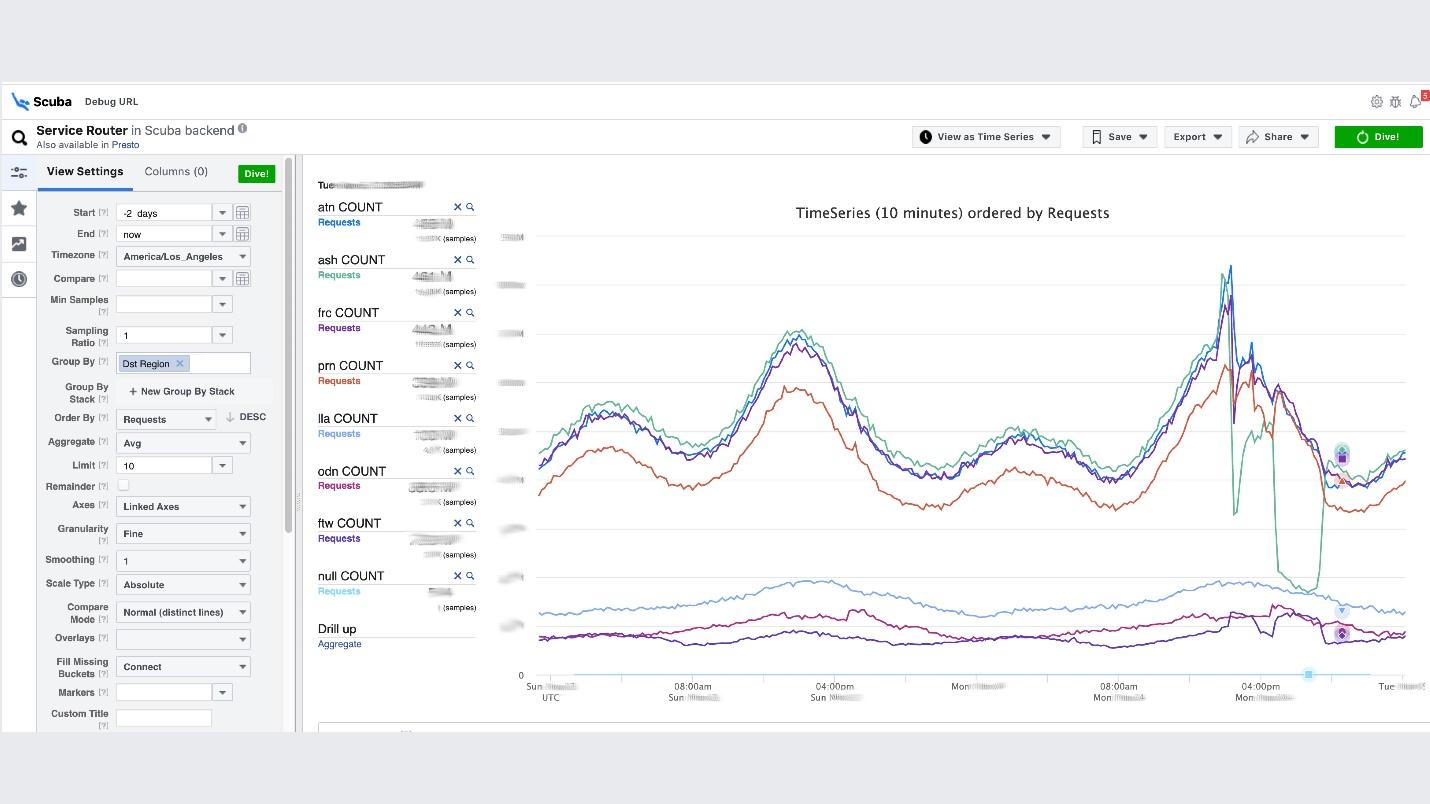 The graph shows that in the end, something went wrong in the service. To find out the delay, go to the list of counters, select the delay, aggregation, click "Dive".
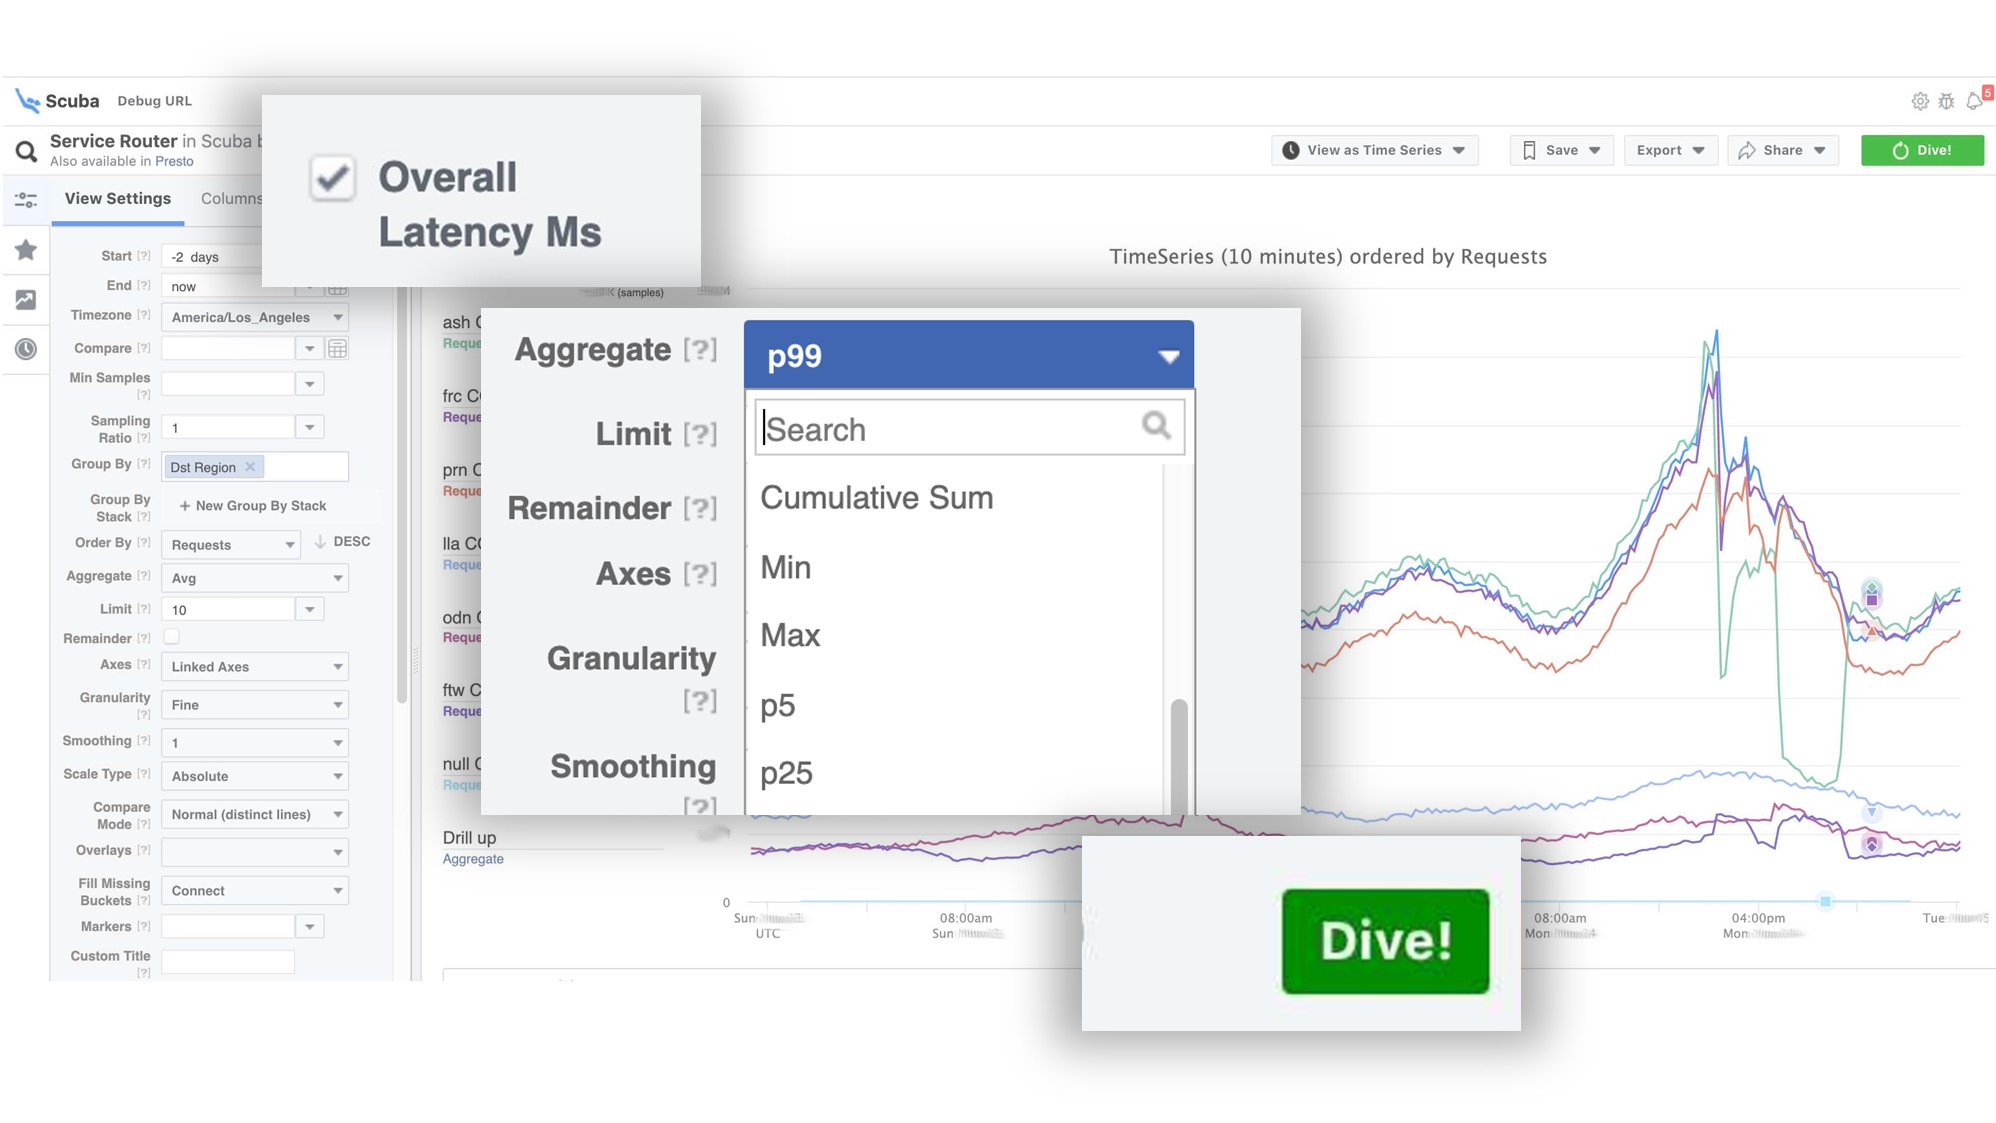 The answer comes in 2 seconds.
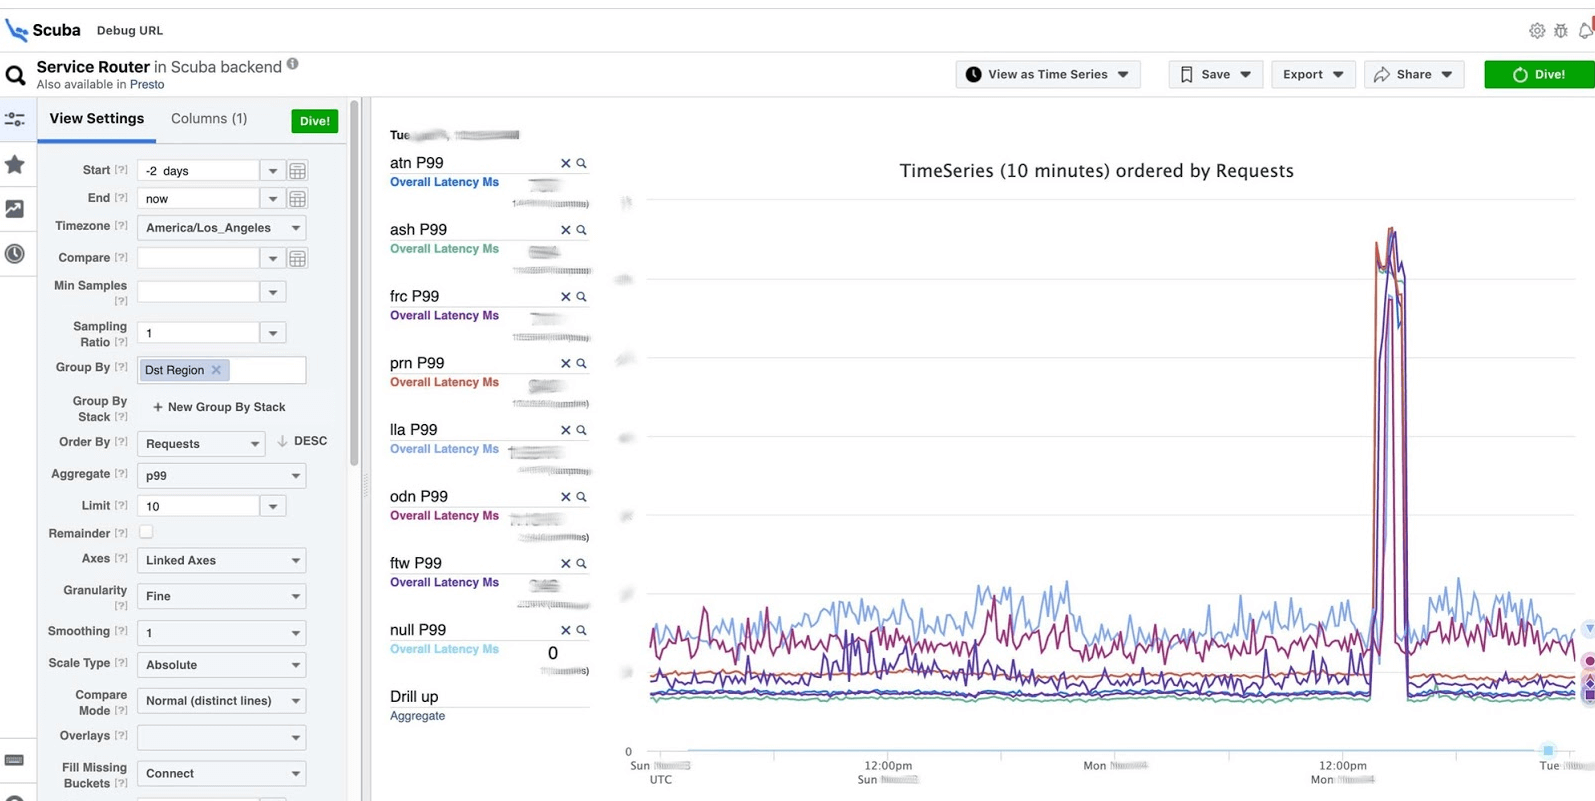 It can be seen that at that moment something happened and the delay increased significantly. To learn more, you can group by different parameters.There are hundreds of such tables.
- A table that shows the versions of binary files, packages, how much memory is eaten on all millions of machines. On each host, an PS is made once an hour and sent to Scuba.
- All dmesg, all memory dumps, are sent to other tables. We run Perf once every 10 minutes on each machine, so we know which stack traces we have on the kernel and what the global CPU can load.
PHP debug
Scuba also provides a backend for our core PHP debugging tool. Thousands of engineers write PHP code, and somehow you need to save the global repository from bad things.How does it work? PHP also writes a stack trace to each log. Scuba (our Elasticsearch) simply cannot accommodate stack trace from all logs from all machines. Before putting the log into Scuba, we convert the stack trace to a hash, sample by hashes and save only them. The stack traces themselves are sent to Memcached. Then, in the internal tool, you can pull a specific stack trace from Memcached quickly enough. Visualization with hash grouping from logs and stack traces.We debug the code using the pattern matching method : open Scuba, see how the error graph looks like.
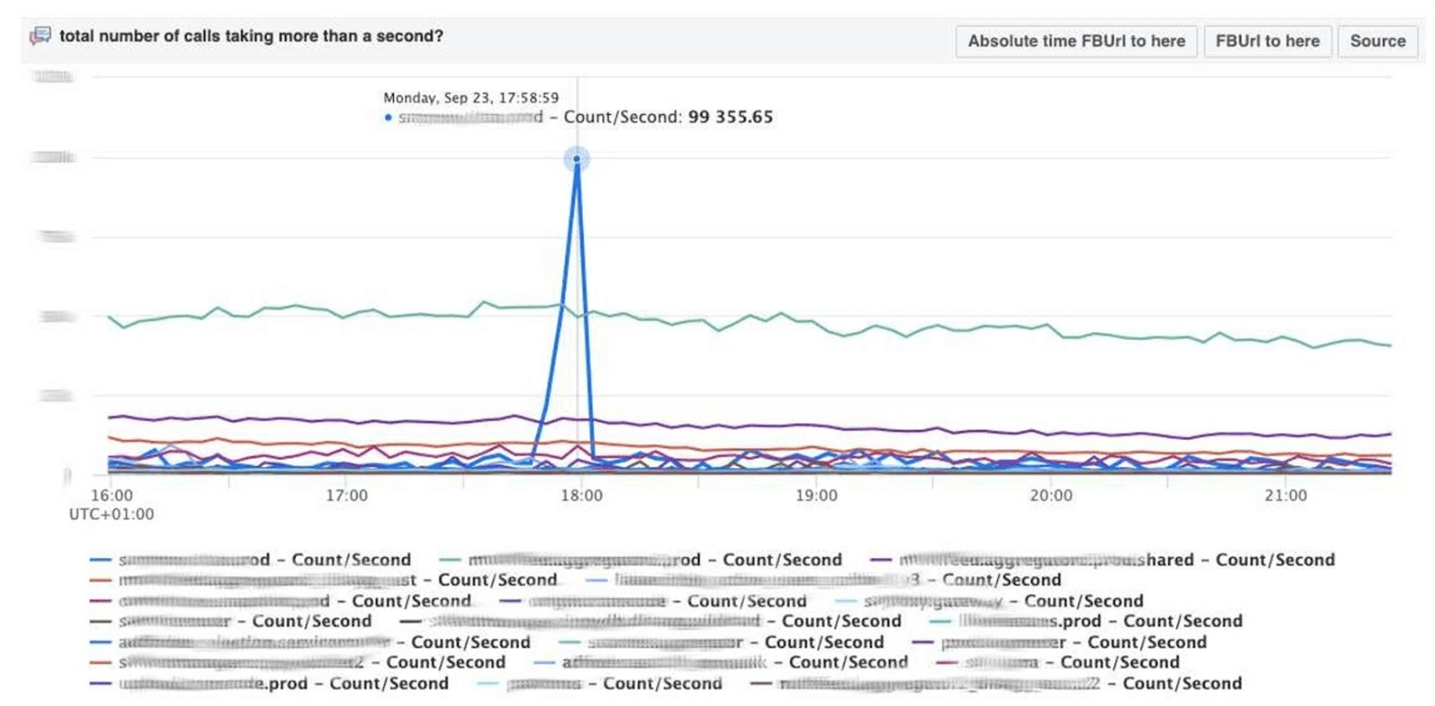 We go to LogView, there errors are already grouped by stack traces.
 A stack trace is loaded from Memcached, and already on it you can find diff (commit in the PHP repository), which was posted at about the same time, and roll it back. Anyone can roll back and commit with us, no permissions are needed for this.
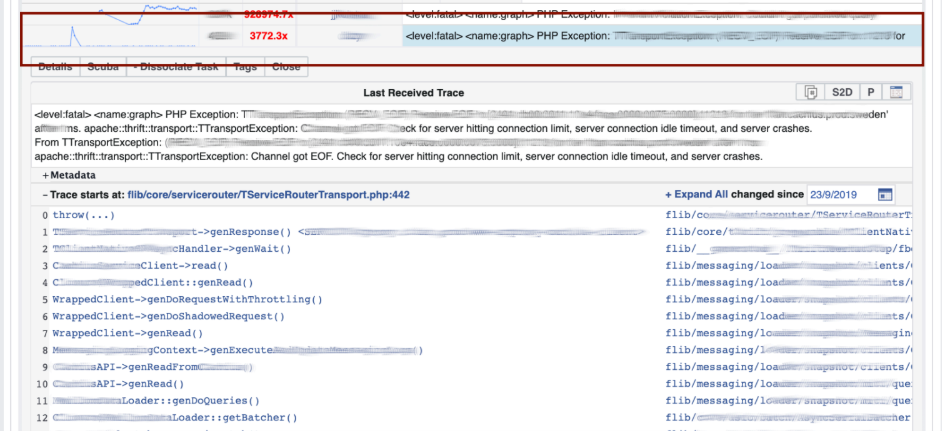
Dashboards
I’ll end the monitoring topic with dashboards. We have few of them - only two per three indicators. The dashboard itself is rather unusual. I would like to talk more about him. Below is a standard dashboard with a set of graphs.Unfortunately, it is not so simple with him. The fact is that the purple line on one graph is the same service that the blue line on the other graph corresponds to, and another graph can be in one day and another in a month.We use our dashboard based on Cubism - the Open Source JS library. It was written on Square and released under the Apache license. They have built-in support for Graphite and Cube. But it is easy to expand, which we have done.The dashboard below shows one day at one pixel per minute. Each line is a region: data centers that are nearby. They display the number of logs that the Facebook backend writes in bytes per second. Below are annotations for teams in America to see what we have already fixed from what happened during the day. It’s easy to look for correlation in this picture.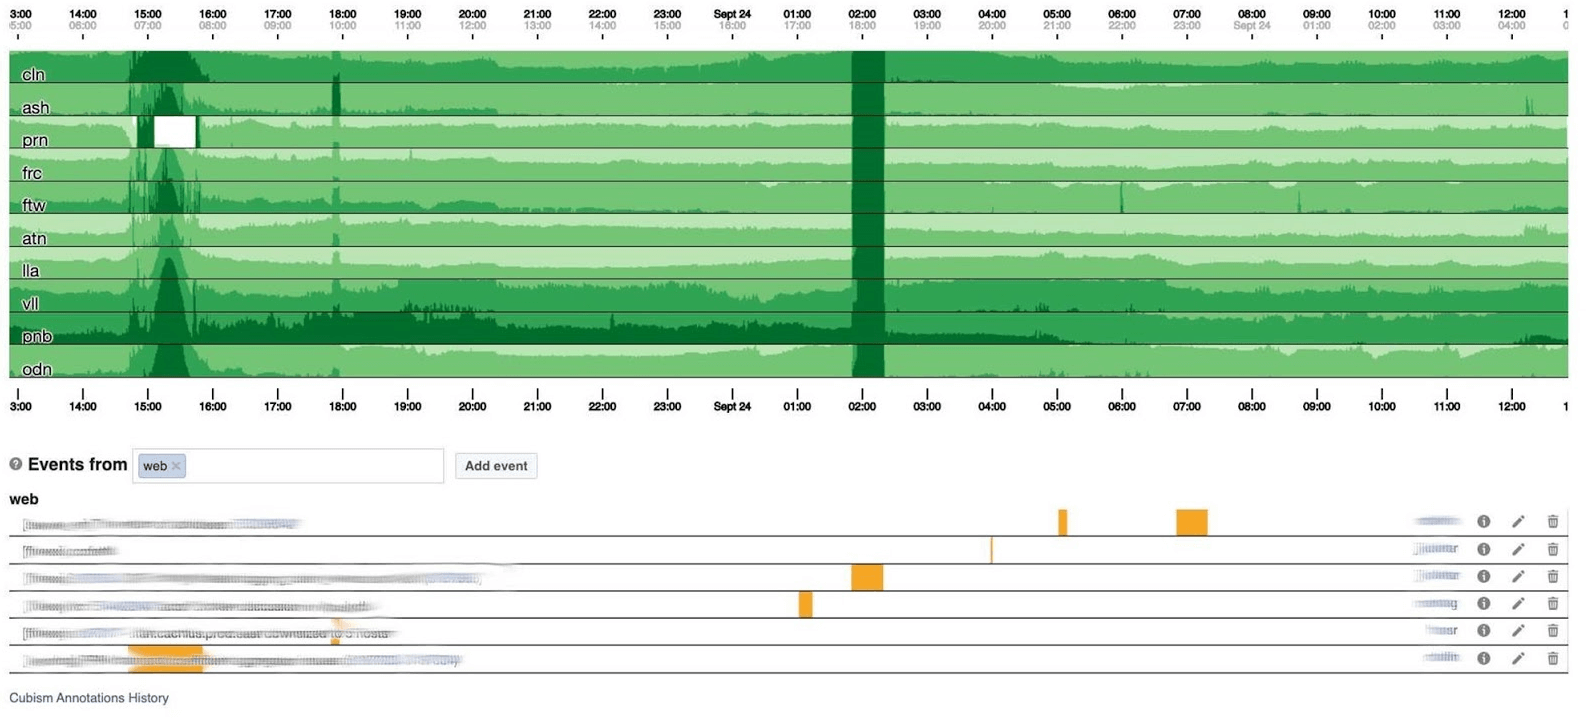 Below is the number of errors 500. What on the left did not matter to users, and obviously they did not like the dark green stripe in the center.
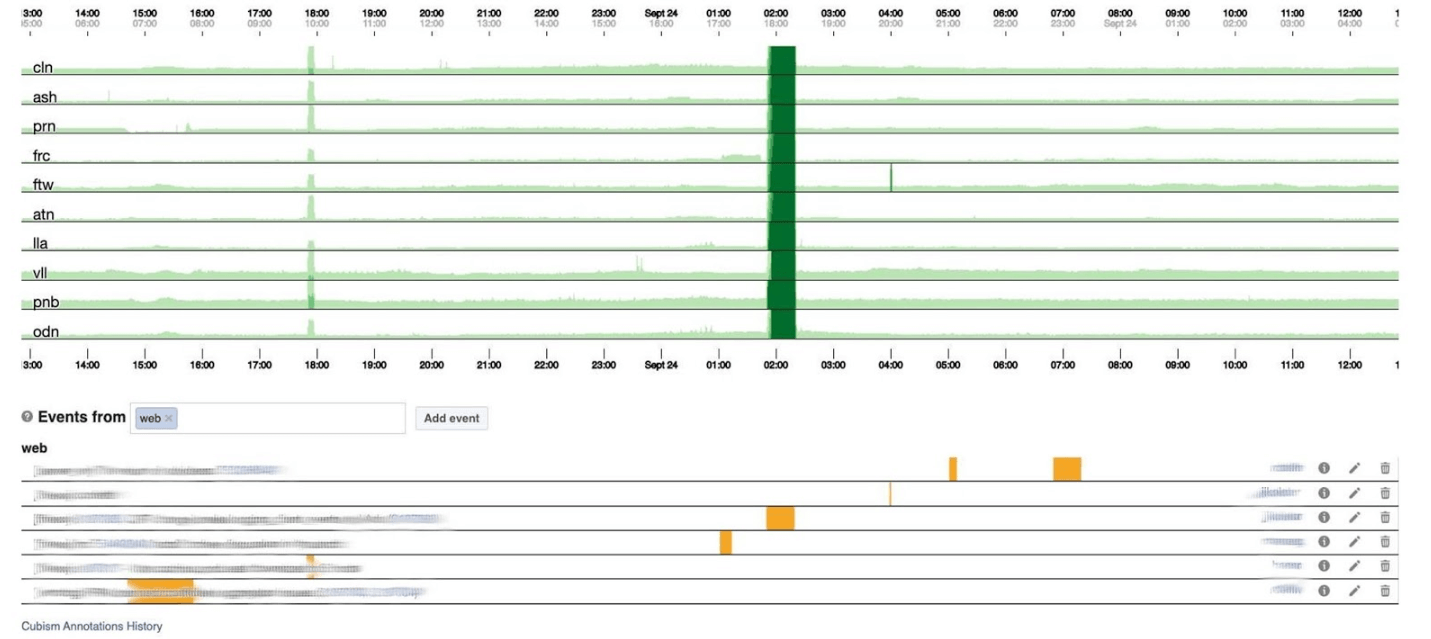 Next is the 99th percentile latency. At the same time, as in the chart above, it can be seen that latency dipped. To return an error, it is not necessary to spend a lot of time.
How it works
On a 120-pixel-high graph, everything is visible. But many of these can’t be placed on one dashboard, so we’ll squeeze to 30. Unfortunately, then we get some kind of boa constrictor. Let's go back and see what Cubism does with it. He breaks the chart into 4 parts: the higher, the darker, and then collapses.
 Now we have the same schedule as before, but everything is clearly visible: the darker the green, the worse. Now it’s much clearer what is happening.On the left you can see the wave as it rose, and in the center, where it is dark green, everything is very bad.
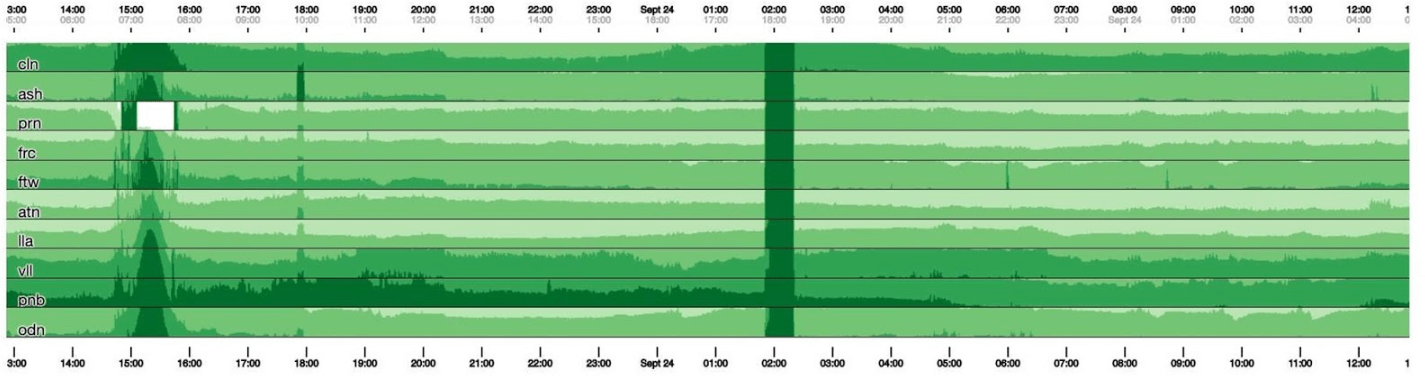 Cubism is only the beginning. It is needed for visualization, in order to understand whether everything is bad now or not. For each table, there are dashboards already with detailed graphs.
 Monitoring by itself helps to understand the state of the system and respond if it breaks. On Facebook, every oncall employee must be able to repair everything. If it burns brightly, then everything turns on, but especially production engineers with the experience of a system administrator, because they know how to solve the problem quickly.
When Facebook lay
Sometimes incidents happen, and Facebook lies. Usually people think that Facebook is lying because of DDoS or hackers attacked, but in 5 years it has never happened. The reason has always been our engineers. They are not on purpose: the systems are very complex and can break down where you do not wait.We give names to all major incidents so that it is convenient to mention and tell newcomers about them so as not to repeat mistakes in the future. The champion by the funniest name is the Call the Cops incident . People called the Los Angeles police and asked to fix Facebook because it was lying. The Los Angeles Sheriff was so sick of it that he tweeted, “Please don't call us!” We are not responsible for this! ” My favorite incident in which I participated was called CAPSLOCK.. It is interesting in that it shows that anything can happen. And this is what happened. It obychnyyIP address:
 fd3b:5679:92eb:9ce4::1.Facebook uses Chef to customize the OS. Service Inventory stores the host configuration in its database, and Chef receives a configuration file from the service. Once the service changed its version, began to read IP addresses from the database immediately in MySQL format and put them in a file. The new address is now written in capital: FD3B:5679:92EB:9CE4::1.Shef looks at the new file and sees that the IP address has “changed” because it compares, not in binary form, but with a string. The IP address is “new”, which means that you need to lower the interface and raise the interface. On all millions of cars in 15 minutes, the interface went down and up.It would seem that it’s okay - capacity decreased while the network was lying on some machines. But a bug suddenly opened in the network driver of our custom network cards: at startup, they required 0.5 GB of sequential physical memory. On cache machines, those 0.5 GB disappeared while we lowered and raised the interface. Therefore, on cache machines, the network interface went down and did not rise, and nothing works without caches. We sat and restarted these machines with our hands. It was fun.Incident Manager Portal
When Facebook “burns”, it is required to organize the work of the “fire brigade”, and most importantly, to understand where it burns, because in a huge company it can “smell burnt” in one place, but the problem will be in another. The UI tool called Incident Manager Portal helps us with this . It was written by production engineers, and it is open to all. As soon as something happens, we start an incident there: name, beginning, description.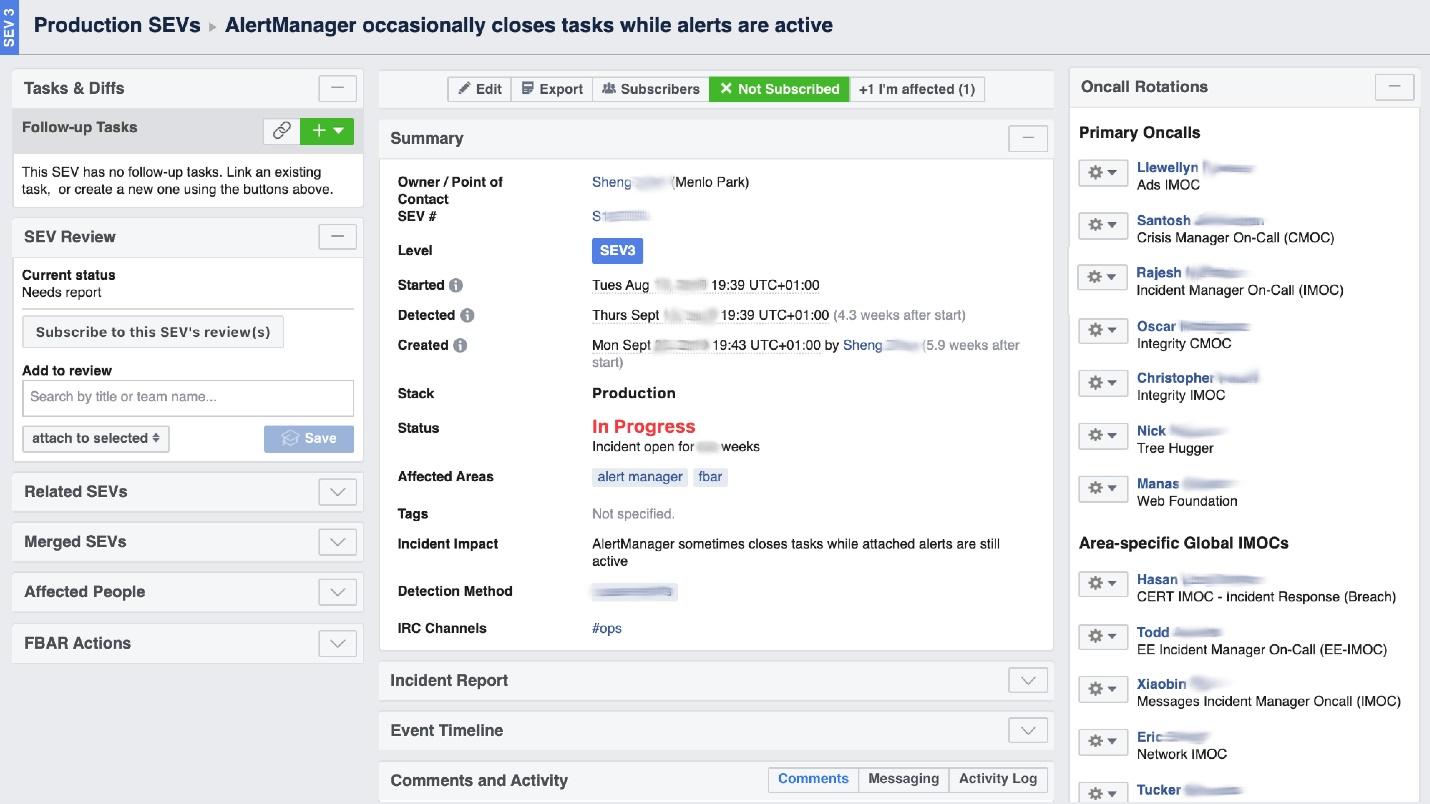 We have a specially trained person - Incident Manager On-Call (IMOC). This is not a permanent position; managers regularly change. In case of large fires, IMOC organizes and coordinates people for repair, but does not have to repair it themselves. As soon as an incident with a high level of danger is created, IMOC receives SMS and begins to help organize everything. In a large system, such people cannot be dispensed with.
Prevention
Facebook is not so common. Most of the time we do not put out fires and do not restart the cache machines, but we fix bugs in advance, and, if possible, for everyone at once.Once we found and fixed the "queue problem." The number of requests increases by 50%, and errors by 100%, because no one throttling implements in advance, especially in small services.We figured out an example of several services and roughly defined a behavior model.- Under normal load, the request arrives, is processed and returned to the client.
- With a high load, requests are waiting in a queue because all threads for processing requests are busy. The delay is increasing, but so far everything is fine.
- The line is growing, the load is increasing. At some point, everything that the server executes on the client ends with a response timeout, and the client falls out with an error. At this point, the result of the server can simply be thrown away.
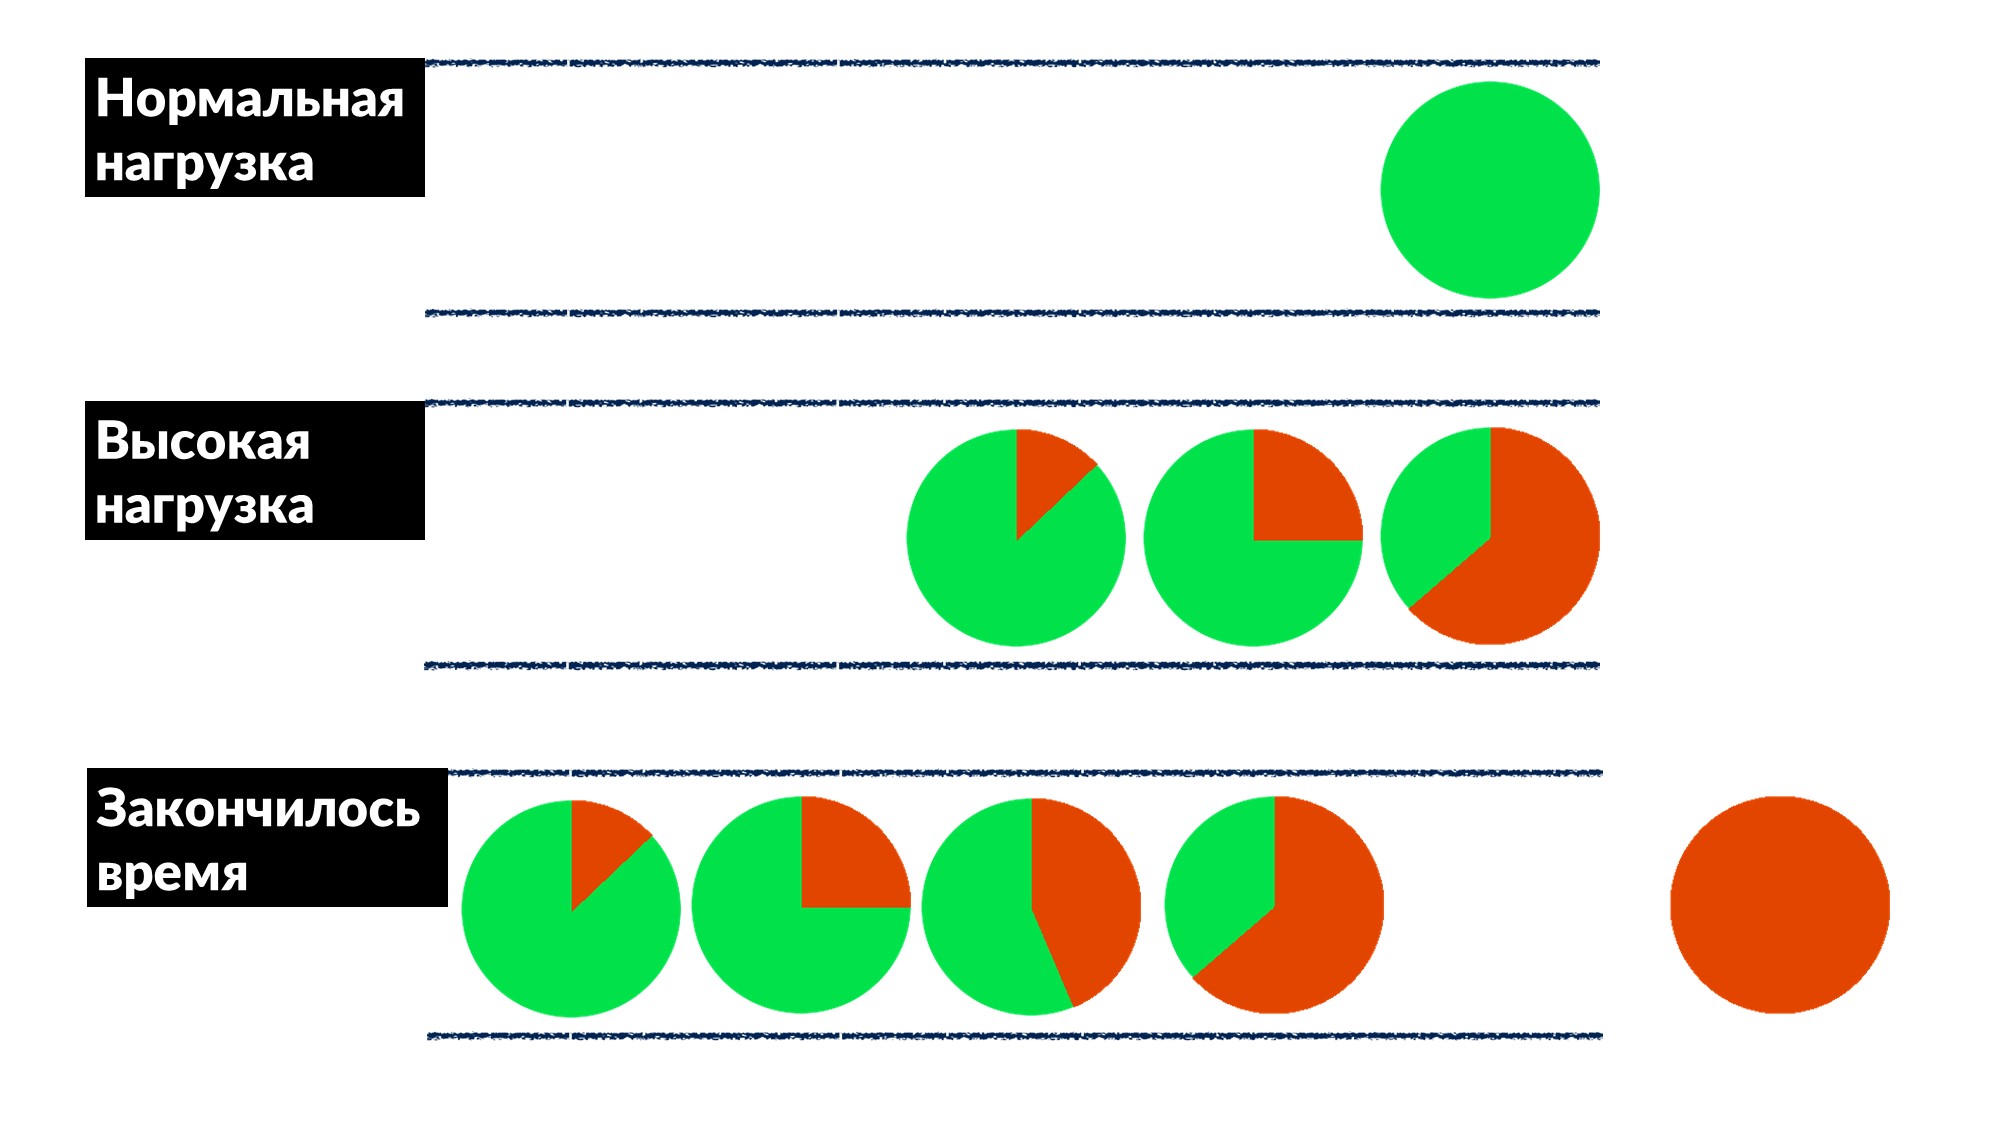 Client timeout is highlighted in red.And the client repeats again! It turns out that all the requests that we execute are thrown into the trash and no one needs it anymore.How to solve this problem for everyone at once? Introduce a limit on the waiting time in the queue. If the request is in the queue more than expected, we throw it out and do not process it on the server, we do not waste CPU on it. We get an honest game: we throw away everything that we can’t process, and everything that we could - processed.The restriction made it possible, while increasing the load by 50% above the maximum, to still process 66% of requests and receive only 33% of errors. The developers of the framework for Dispatch implemented this on the server side, and we, the production engineers, gently settled the 100 ms timeout in the queue for everyone. So all the services immediately got cheap basic throttling.
Tools
The ideology of SRE says that if you have a large fleet of cars, a bunch of services, and nothing to do with your hands, then you need to automate. Therefore, half the time we write code and build tools.- Integrated Cubism into the system.
- FBAR is a “workhorse” that comes and repairs, so no one worries about one broken car. This is the main task of the FBAR, but now it has even more tasks.
- Coredumper , which we wrote with two colleagues . It monitors coredumps on all machines and drops them in one place along with stack traces with all the host information: where it lies, how to find what size. But most importantly, stack traces go for free, without starting GDB using BPF programs.
Polls
The last thing we do is talk with people, interview them. It seems to us that this is very important.One useful poll is about reliability. We ask about already running services in the key quotes from our questionnaire:"The primary responsibility of system software must be to continue running. Providing service should be seen as a beneficial side-effect of continued operation »
This means that the main duty of the system is to continue to work, and the fact that it provides some kind of service is an additional bonus.Surveys are only for medium services, large ones themselves understand. We give a questionnaire in which we ask basic things about architecture, SLO, testing, for example.- “What happens if your system gets 10% of the load?” When people think: “But really, what?” - insights appear, and many even rule their systems. Previously, they did not think about it, but after the question there is a reason.
- “Who is the first to usually notice problems with your service - you or your users?” Developers begin to recall when this happened and: "... Maybe you need to add alerts."
- "What is your biggest oncall pain?" This is unusual for developers, especially for new ones. They immediately say: “We have many alerts! Let us clean them and remove those that are not the case. "
- “How frequent are your releases?” First they remember that they are releasing it with their hands, and then they have their own custom deployment.
There is no coding in the questionnaire; it is standardized and changes every six months. This is a two-page document that we help fill out in 2-3 weeks. And then we arrange a two-hour rally and find solutions to many pains. This simple tool works well with us and can help you.6-7 Saint HighLoad++, . (, , ).
telegram- . !