 I am a beginner front-end developer. Now I am studying and training in a Minsk IT company. Learning the basics of web-ui takes place using the Webix JS library as an example. I want to share my modest experience and save it as a small tutorial on this interesting UI library.
FIFTH TASK
In a previous article, Working with data , based on CRUD functions, I wrote about standard tasks for managing application data. At this point, I will try to make the application more user friendly and realize the ability to filter, sort and group data. In the article I will consider the following tasks:In the documentation you can find the List , Treetable , Table widgets used in the article .Sources are on the link .The finished application can be found here .Filtering and sorting table data
Let's start with the tables - I most often used them to work with a lot of data. Tables in the Webix library have a number of built-in filters that are set directly in the header of the Table and TreeTable widgets. In the Table widget, I use two options: a simple text filter ( textFilter ) and a filter with a set of options in the drop-down list ( selectFilter ). The table allows you to add one filter for each column. I will do this for two: title and year. I will set the Header in them instead of a string with an array - to fit the header and filter. The second element of the array is an object with a content property and a filter name.The code for the Table widget is in the table.js file and rendered in the “Dashboard” tab.
When characters are entered into the "textFilter"data, they will be filtered by matching by substring. If you select the option "selectFilter"- by the selected value.columns:[
{ id:"rank", header:"", width:50, css:"rank"},
{ id:"title", header:["Film title", { content:"textFilter"}], fillspace:true },
{ id:"year", header:["Released", {content:"selectFilter" }], width:100 },
{ id:"votes", header:"Votes", width:100 },
{ id:"rating", header:"Rating", width:100 },
{ header:"", template:"<span class='webix_icon wxi-close'></span>", width:35}
]
Filtering result by substring “star”: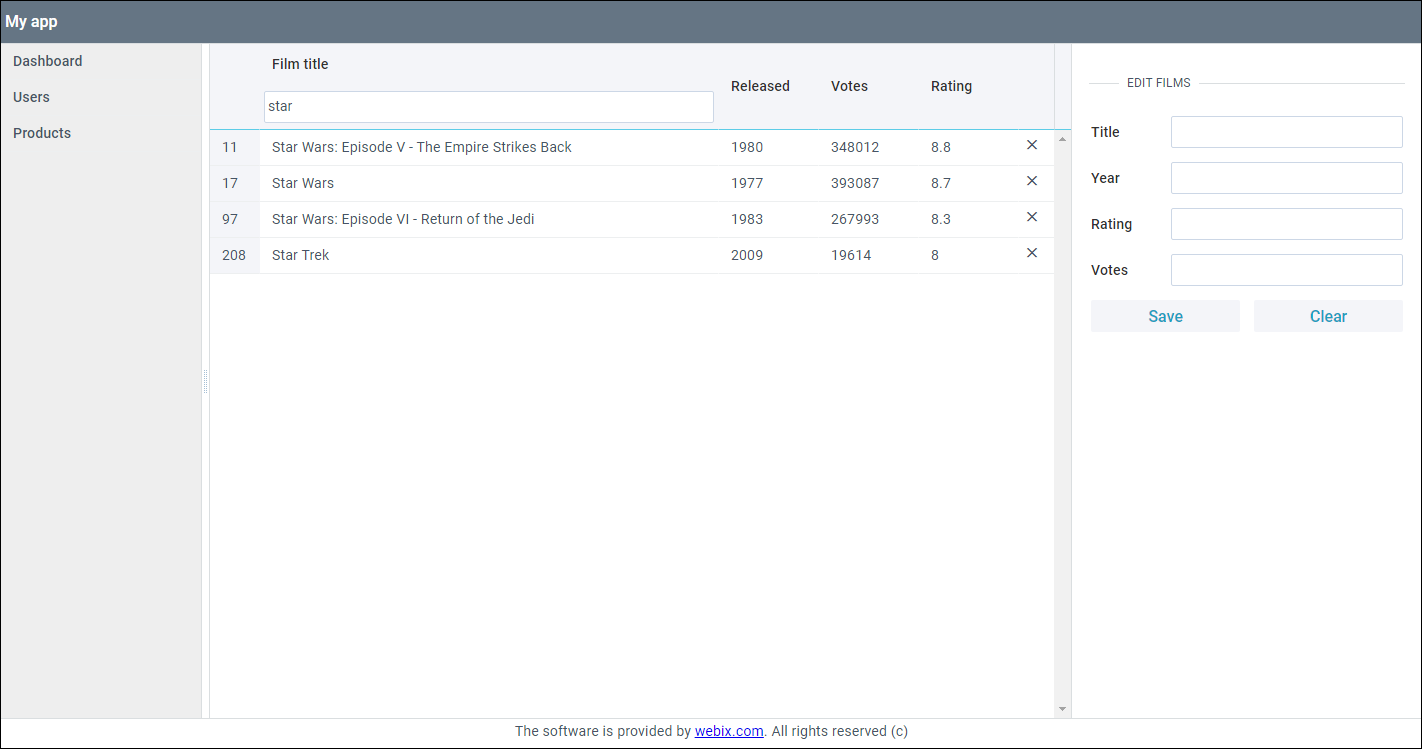 Result of filtering elements by selected value “1991”:
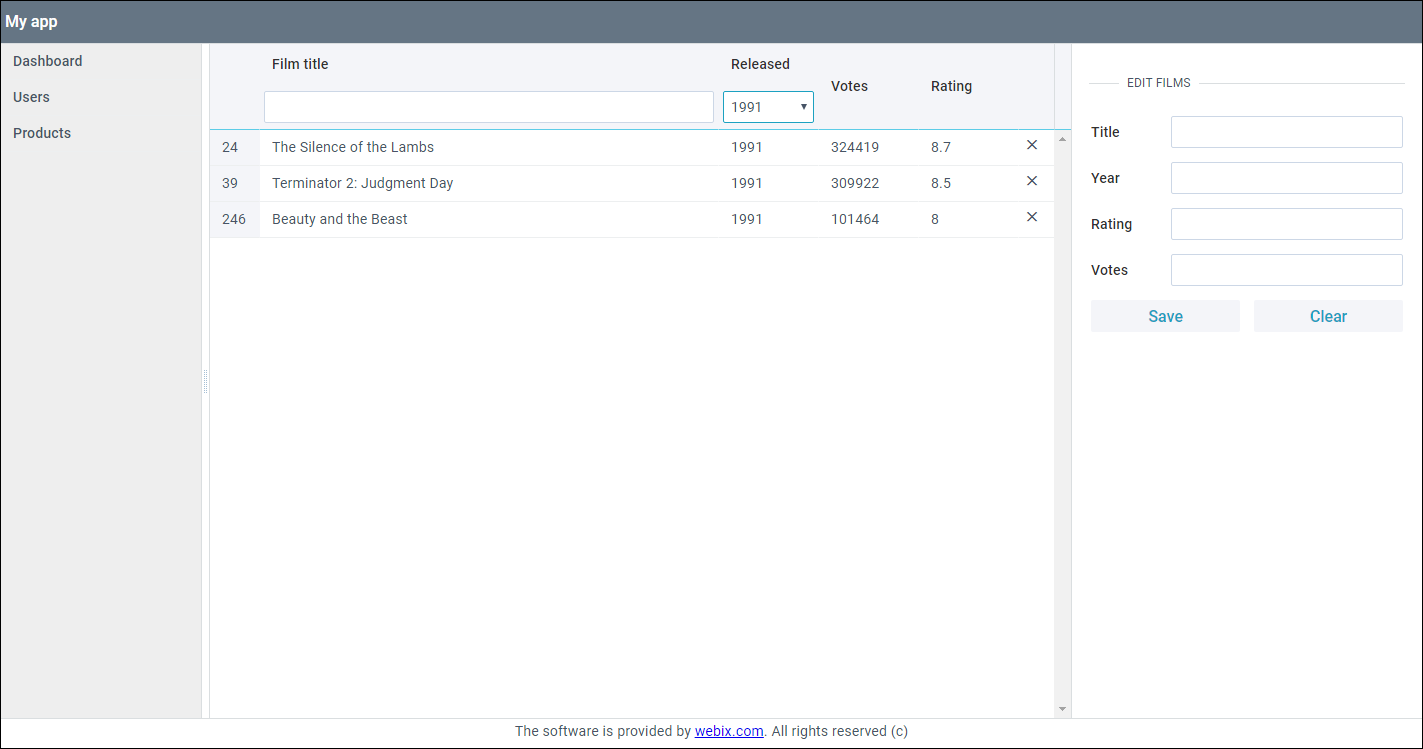 Sorting. As with filters, sorting is just as easy to make available to the user. To do this, it is enough to supplement the column configuration with the sort property . There are several ready-made sort types: by numerical values, by date, and by string. For the year, votes and rating columns, I will set the sort: “int” setting to sort by numeric values. For the title column, the value will be “string”.
 columns:[
{ id:"rank", header:"", width:50, css:"rank"},
{ id:"title", header:["Film title", { content:"textFilter"}], fillspace:true,
sort:"string"},
{ id:"year", header:["Released", {content:"selectFilter" }], width:100, sort:"int"},
{ id:"votes", header:"Votes", width:100, sort:"int"},
{ id:"rating", header:"Rating", width:100, sort:"int"},
{ header:"", template:"<span class='webix_icon wxi-close'></span>", width:35}
]
By clicking on the header column, the data will be sorted according to their type. Rating sort result: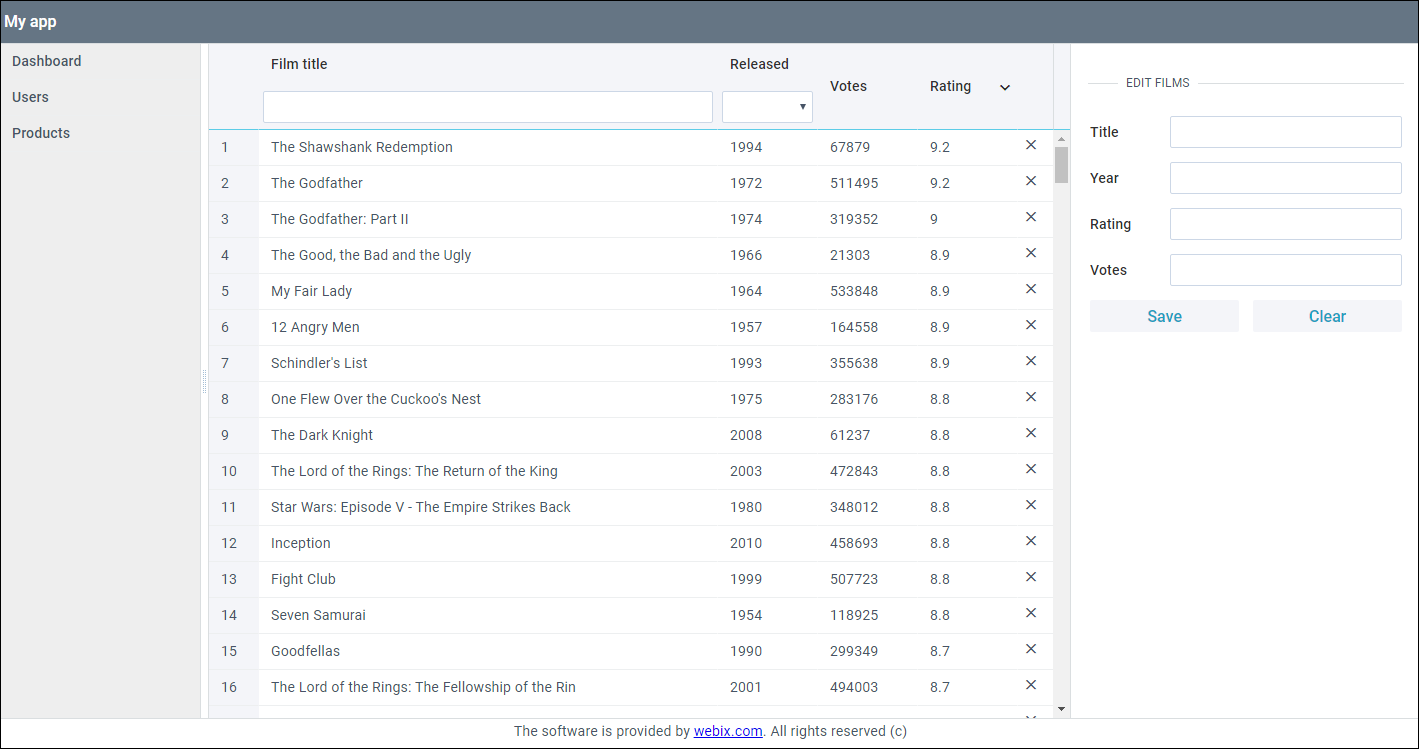
API sorting and filtering
Ready-made solutions for filtering and sorting items have only tables. But in general, all widgets support these features through the appropriate API methods - filter and sort. I will demonstrate filtering and sorting using the API with the List widget .The code for the List widget is in the users_module.js file and rendered in the “Users” tab.
Filtration. In the Users tab , after the “Add new person” button, I will install the Text widget , which I use as a filter for the names from the list.cols:[
{
view:"button", id:"btn_add_person",
value:"Add new person", width:150, css:"webix_primary",
click:addPerson
},
{
view:"text", id:"list_input"
},
]
Now I will open the script.js file and add the logic responsible for filtering the elements.$$("list_input").attachEvent("onTimedKeyPress",function(){
var value = this.getValue().toLowerCase();
$$("user_list").filter(function(obj){
return obj.name.toLowerCase().indexOf(value) !== -1;
})
});
Elements are filtered according to this principle:- using the attachEvent method , I add a handler to the onTimedKeyPress event ;
- the onTimedKeyPress event is triggered by entering characters in the text field, but with a short delay, so as not to activate the filter with every keystroke;
- then I get the entered text and use the filter method to start filtering - search for matches in the List widget.
Filtering result via API: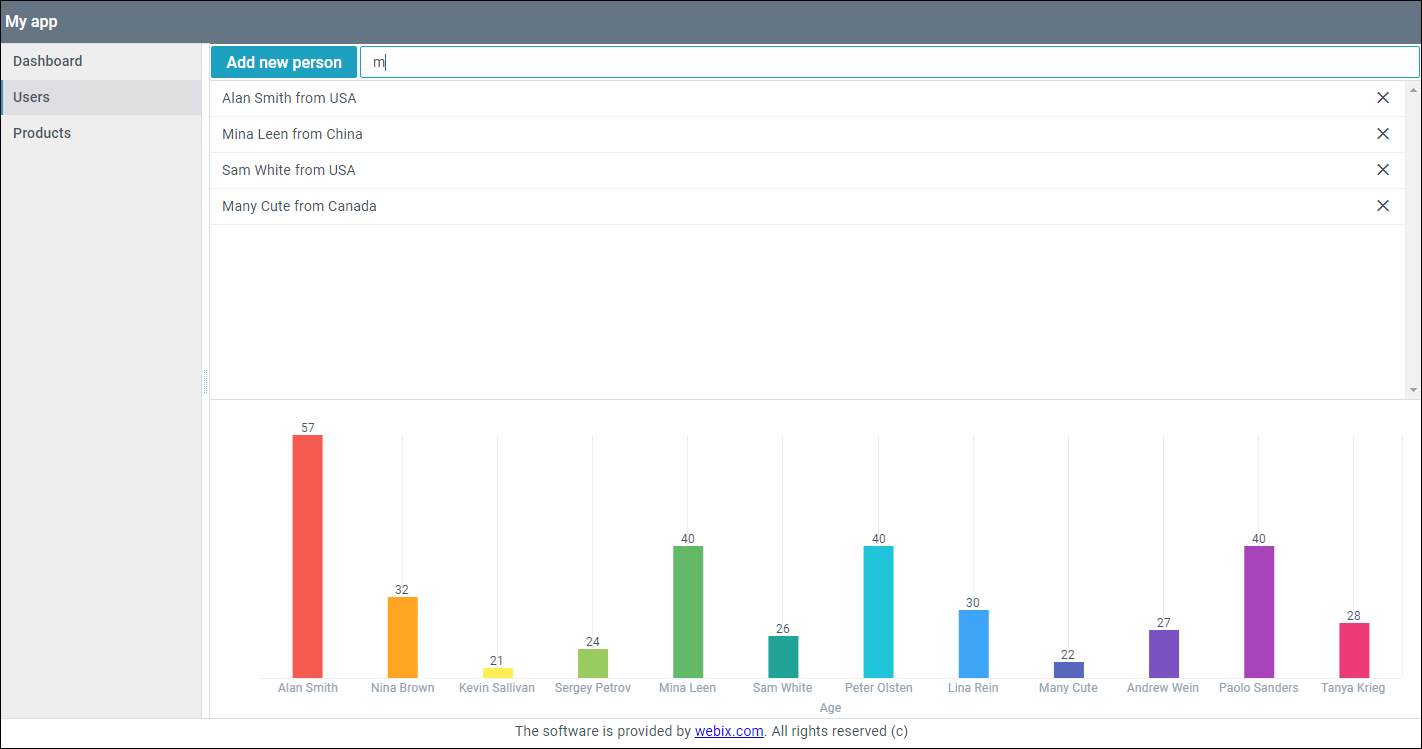 Sort. List widget elements will be sorted by clicking the
 “Sort asc”and buttons “Sort desc”.To create buttons in the Users tab , after the text box I will add two Button widgets with a click event handler .cols:[
{
view:"button", id:"btn_add_person",
value:"Add new person", width:150, css:"webix_primary",
click:addPerson
},
{
view:"text", id:"list_input"
},
{ view:"button", id:"btn_asc", width:150, value:"Sort asc", css:"webix_primary",
click:()=>{
$$("user_list").sort("#name#","asc")
}},
{ view:"button", id:"btn_desc", width:150, value:"Sort desc", css:"webix_primary",
click:()=>{
$$("user_list").sort("#name#","desc")
}},
]
Inside the click handler, the sort method accepts for the parameter: the name of the field by which we are sorting the data, and the direction of sorting “asc”(ascending) - ascending, and “desc”(descending) - descending. By default, data is considered rows and sorted accordingly.Result (names in the sheet are sorted alphabetically):
Tree table data grouping
Consider a situation where data must be grouped according to arbitrary parameters.I will study the grouping using the TreeTable widget as an example.The TreeTable widget code is located in the products_module.js file and rendered in the “Poducts” tab.
In this article: Modules, Charts, Tree Tables, and Working with Data. CRUD , I used hierarchical data in a tree table. To solve this problem, I changed them to get a linear array. I got rid of the hierarchy and transferred the field from it to each record “category”.[
{"id": "1.1", "title": "Standard Ticket", "price": 21, "category":"Cinema", "rank":1.1},
{"id": "2.1", "title": "Cola", "price": 10, "category":"Cafe", "rank":2.1},
{"id": "3.1", "title": "Flowers", "price": 10, "category":"Other", "rank":3.1}
]
There are two ways to group data in a table:The parameters for these methods are the same and I need to group the data once as soon as they arrive, so I use the first option.In the configuration of the TreeTable widget, I add the scheme property . This property determines by which scheme the data will be processed in different situations. Among the handlers in sheme is the $ group method , which I need to group the data.const products = {
editable:true,
view:"treetable",
scrollX:false,
columns:[
{ id:"rank", header:"", width:50 },
{ id:"title", header:"Title", fillspace:true, template:"{common.treetable()} #title#"},
{ id:"price", header:"Price", width:200, editor:"text" }
],
select:"row",
url:"data/products.js",
scheme:{
$group:{
by:"category",
map:{
title:["category"]
}
},
$sort:{ by:"value", dir:"asc" }
}
}
Inside the $ group handler, two parameters are used:- required parameter by , by which data is grouped. Here is one of the fields (“category”);
- map object - here we describe the data fields for the created groups. Grouping breaks the source data according to the specified parameters and creates “parent records” for them. Through map we can add new fields to these records. In order for the data in the table to be displayed correctly, I will add the “title” field. I will pass in it the value of the parameter by which the grouping occurs.
Additionally, I set up the $ sort function to sort the grouped data in alphabetical order.Grouping Result:
Component Sync
The task uses Chart and List widgets, the code of which is in the users_module.js file and rendered in the “Users” tab
Chart and List widgets use the same data - a JSON array. These components can be linked in such a way that all data changes in one of them (the source) are transmitted to another. To do this, use the sync method.The sync method allows you to copy data from one component and transfer it to another. At the same time, changes in the main component, such as adding, deleting, etc., are immediately reflected in another.To begin with, in the Chart widget - chart - I will delete the data link.{
view:"chart",
id:"chart",
type:"bar",
value:"#age#",
label:"#age#",
xAxis:{
template:"#name#",
title:"Age"
}
}
Now, in the script.js file, using the sync method, I synchronize the Chart widget with the List widget .$$("chart").sync($$("user_list"));
In the addPerson function , the addition is left only for the List widget.let addPerson = () => {
let obj = {
name:"Some name",
age:Math.floor(Math.random() * 80) + 10,
country:"Some country"
}
$$("user_list").add(obj);
};
Now, when adding and removing entries from the list, changes will occur in the chart. Sorting and filtering in the List widget will now affect data in the Chart.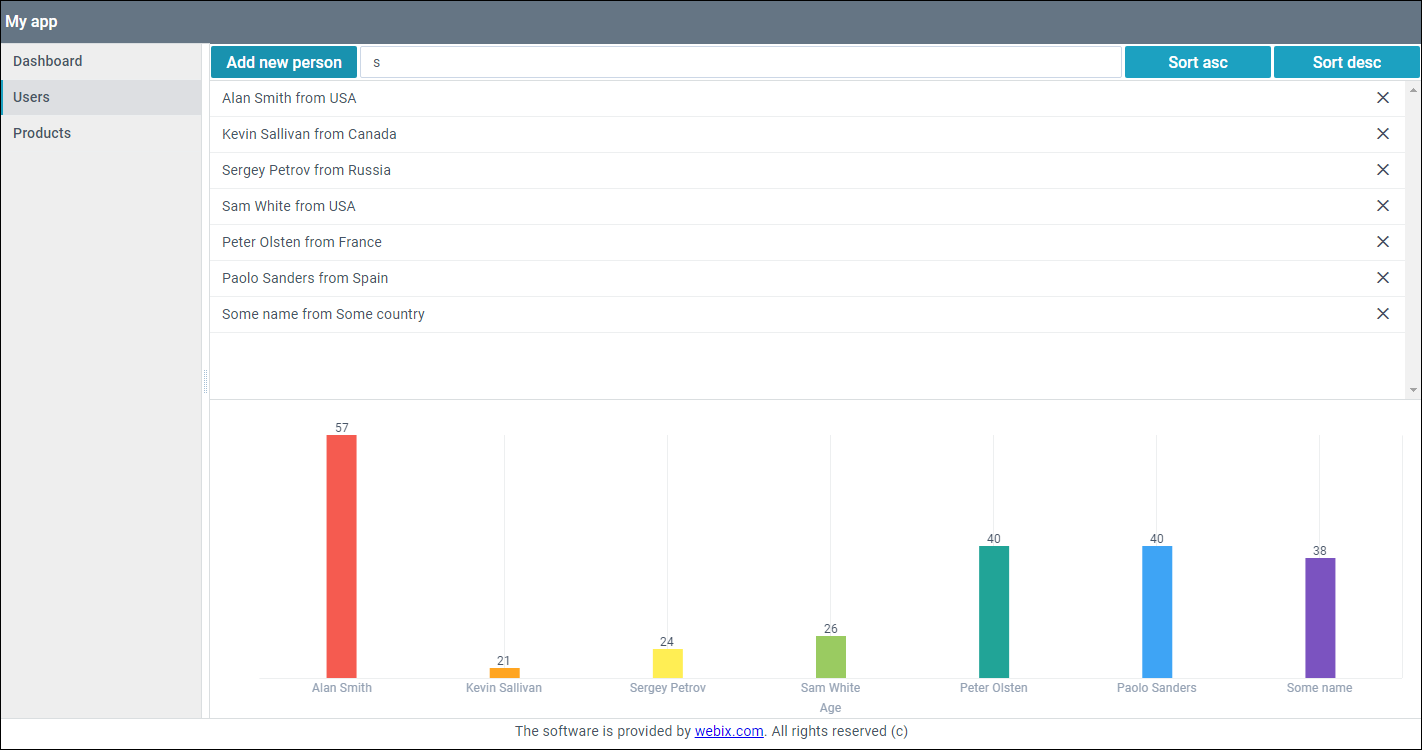
Generalization
Using practical examples, I showed how you can improve the user experience. In addition to standard sorting and filtering using the API, the built-in ability to do this in the Table and TreeTable widgets with one setting was mastered. A method for grouping data in a table was demonstrated, and the synchronization example expanded the ability to improve the operation of widgets that use the same data source.The finished application can be found here .