Investigation and conversion by sorting pseudo-random sequencesAlgorithms in C # and qbasic have been created and an Excel compatible table proving the ability to investigate pseudorandom sequences for randomness and capable of determining non-random or low-power sequences.Graphical shell: Excel table compatible for research over 50 thousand. elements of 2 types:1. Study of a sequence of numbers;2. The study of the sequence of digits 0 and 1. Number sequence research: the table defines binary signs, for example less / more and even / odd.The graphical shell of an Excel compatible table uses the formulas: The
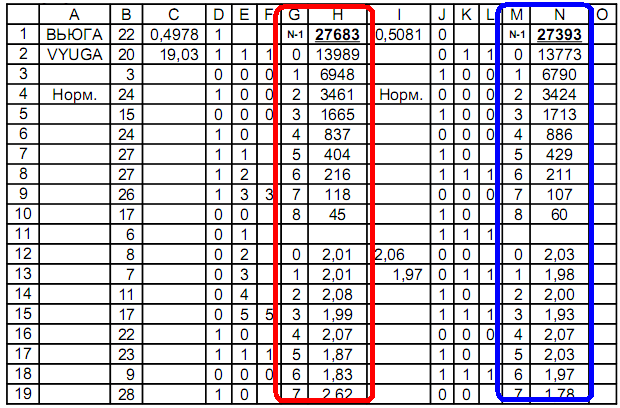 number of matches in a row is calculated by the formula N = log (1-C) / log (1-P),where N is the step, P is the probability, C is the reliability of the probability.Distribution step number:at C = P = 0.5; N = 1 = log0.5 / log0.5 = log (1-1 / 2) / log (1-1 / 2) = 1at C = 0.25; P = 0.5; N = 2 = log0.75 / log0.5 = log (1-1 / 4) / log (1-1 / 2) = 2, etc.Column A is the name of the sequence;Column B - sequence;Column D - 1st distribution: less / more;Columns E, F - definition of identical ones in a row;Columns G, H - counting the number of signs identical in a row;Column J - 2nd distribution: even / odd;Columns K, L - definition of signs identical in a row;Columns M, N - counting the number of signs identical in a row.Formulas used in the table:
Cell
| Formula
| Explanation
|
C1
| = AVERAGE (D1: D55000)
| The average value of sequence numbers
|
C2
| = AVERAGE (B1: B55000)
| Distribution Average 1
|
D1
| = IF (B1 <C $ 2; 0; 1)
| If the number is less than average, then 0, otherwise 1
|
D2
| = IF (B2 <C $ 2; 0; 1)
| If the number is less than avg, then 0, otherwise 1, etc.
|
E2
| = IF (D2 = D1; E1 + 1; 0)
| If the signs of distribution are the same, then the counter of the same in a row is +1, otherwise the counter is reset to zero
|
F2
| = IF (E3 = 0; E2; "")
| If the counter is reset, the highest counter is recorded.
|
G2-g19
| 0 ... 7
| Numbers in order to compare
|
H1
| = SUM (H2: H10)
| Sum of comparisons
|
H2
| =(F$1:F$55000;G2)
| 1
|
H3
| =(F$1:F$55000;G3)
| 2 ..
|
H12
| =H2/H3
|
|
I12
| =(H12:H19)
|
|
I13
| =(N12:N19)
| ..
|
I1
| =(J1:J55000)
| 2
|
J1
| =(B1/2=(B1/2);0;1)
| , 0, 1
|
J2
| =(B2/2=(B2/2);0;1)
| , 0, 1 ..
|
K2
| =(J2=J1;K1+1;0)
| , +1,
|
L2
| =(K3=0;K2;" ")
| ,
|
M2-M19
| 0…7
|
|
N1
| =(N2:N10)
|
|
N2
| =(L$1:L$55000;M2)
| 1
|
N3
| =(L$1:L$55000;M3)
| 2 ..
|
N12
| =H2/H3
|
|
Other monitoring functions can be programmed in the table.In the table it is possible to create graphs of the values of any cells.The continuation of the table explores random permutations of the sequence.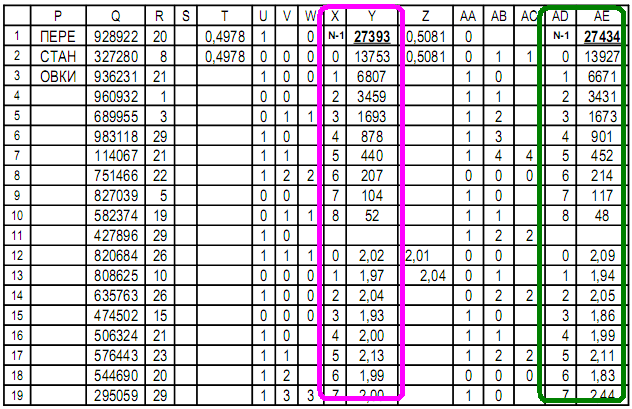 Column Q - random for permutations: integers up to 10 ^ 6,to minimize the repetition of random ones;Column R - initially a copy of column B and then modified;Columns T ... AE are the same as columns C ... N.
Cell
| Formula
| Explanation
|
Q1
| = CASE BETWEEN (0; 1,000,000)
| Random to rearrange
|
Q2
| = CASE BETWEEN (0; 1,000,000)
| Random for permutation, etc.
|
The permutation is done by sorting 2 columns Q and R:column Q is leading and column R is slave.Result: permutation of column R and a new sequence.The PRNG studies based on the integrated PRNG show the normality of the algorithm.Before the permutation of 500 cells: After the permutation of 500 cells: The
 check shows a good distribution, comparing the signs: small / large and even / odd.The table examines the trigonometric PRNG, using the decimal digits of the trigonometric functions, without using the standard PRNG.
OPEN "rndsin.txt" FOR OUTPUT AS #1
c = 0: a = SIN(TIMER) * 100 + 200
PRINT #1, "a= ", a
FOR k = 1 TO 10 ^ 3 + a * 10 ^ 3: NEXT
FOR i = 1 TO 100
FOR j = 1 TO a
x = SIN(TIMER) * 1000 + 2000
b = COS(x): c = c + b
LOCATE 1, 1: PRINT j
NEXT
d = (ABS(c)) - INT(ABS(c))
PRINT #1, d
FOR k = 1 TO 10000 + a * b * c * 10 ^ 2: NEXT
NEXT
Before the permutation of 500 cells: unsatisfactory. Apparently, the distribution is poor, revealing the frequency and scatter of values, comparing the signs: small / large and even / odd.After rearrangement of 500 cells: normal
 Purpose: to exclude the built-in PRNG.Rearrangement method: the original sequence is sorted, the same sequence that is inverted or inverted in any way is accepted as random for the rearrangement.For example, in Excel, 2 copies of the columns of a sequence were created at a distance, and a leading row of 1 ... 55000 in a row is built on one column on the left and 2 columns are sorted from maximum to minimum, inverting the original data.Next, 2 columns of the sequence are mapped side by side and sorted, where the leading column is the reverse column and the slave column is the initial column.Before the permutation of 500 cells: unsatisfactory
 After the permutation of 500 cells: normal
 Result: the sequence became normal without the built-in PRNG.Conclusions: true randomness is unnatural for people and it is possible to synthesize low-power or false sequences that are accepted by people and computers as random sequences.Any sequences can really be synthesized in programming languages and in Excel compatible tables.The problem of overcoming randomness is solved by recognizing randomness as normal or false in an Excel spreadsheet with graphs.Q.E.D.Continued with approval:Permutation programs in qbasic and C # languages.Investigation of digits pi.Falsification of randomness.2020 development of foreign like-minded people.