In anticipation of the start of a new stream on the course "Developer Golang" prepared a translation of interesting material.
Our authoritative DNS server is used by tens of thousands of websites. We respond to millions of queries daily. Nowadays, DNS attacks are becoming more and more common, DNS is an important part of our system, and we need to make sure that we can work well under high load.dnsflood is a small tool that can generate a huge number of udp requests.# timeout 20s ./dnsflood example.com 127.0.0.1 -p 2053
System monitoring showed that the memory usage of our service grew so fast that we had to stop it, otherwise we would run into OOM errors. It was like a memory leak problem; There are various reasons for "similar" and "real" memory leaks in go:- hanging goroutines
- misuse of defer and finalizer
- substrings and sub-cuts
- global variables
This post provides a detailed explanation of various leaks.Before making any conclusions, let's first conduct a profiling.Godebug
Various debugging tools can be enabled using an environment variable GODEBUG, passing a comma-separated list of pairs name=value.Trace planner
The scheduler trace can provide information about goroutine behavior at runtime. To enable the scheduler trace, run the program with GODEBUG=schedtrace=100, the value determines the output period in ms.$ GODEBUG=schedtrace=100 ./redins -c config.json
SCHED 2952ms: ... runqueue=3 [26 11 7 18 13 30 6 3 24 25 11 0]
SCHED 3053ms: ... runqueue=3 [0 0 0 0 0 0 0 0 4 0 21 0]
SCHED 3154ms: ... runqueue=0 [0 6 2 4 0 30 0 5 0 11 2 5]
SCHED 3255ms: ... runqueue=1 [0 0 0 0 0 0 0 0 0 0 0 0]
SCHED 3355ms: ... runqueue=0 [1 0 0 0 0 0 0 0 0 0 0 0]
SCHED 3456ms: ... runqueue=0 [0 0 0 0 0 0 0 0 0 0 0 0]
SCHED 3557ms: ... runqueue=0 [13 0 3 0 3 33 2 0 10 8 10 14]
SCHED 3657ms: ...runqueue=3 [14 1 0 5 19 54 9 1 0 1 29 0]
SCHED 3758ms: ... runqueue=0 [67 1 5 0 0 1 0 0 87 4 0 0]
SCHED 3859ms: ... runqueue=6 [0 0 3 6 0 0 0 0 3 2 2 19]
SCHED 3960ms: ... runqueue=0 [0 0 1 0 1 0 0 1 0 1 0 0]
SCHED 4060ms: ... runqueue=5 [4 0 5 0 1 0 0 0 0 0 0 0]
SCHED 4161ms: ... runqueue=0 [0 0 0 0 0 0 0 1 0 0 0 0]
SCHED 4262ms: ... runqueue=4 [0 128 21 172 1 19 8 2 43 5 139 37]
SCHED 4362ms: ... runqueue=0 [0 0 0 0 0 0 0 0 0 0 0 0]
SCHED 4463ms: ... runqueue=6 [0 28 23 39 4 11 4 11 25 0 25 0]
SCHED 4564ms: ... runqueue=354 [51 45 33 32 15 20 8 7 5 42 6 0]
runqueue is the length of the global queue of goroutines to run. The numbers in parentheses are the length of the process queue.The ideal situation is when all processes are busy executing goroutines, and the moderate length of the execution queue is evenly distributed between all processes:SCHED 2449ms: gomaxprocs=12 idleprocs=0 threads=40 spinningthreads=1 idlethreads=1 runqueue=20 [20 20 20 20 20 20 20 20 20 20 20]
Looking at the output of schedtrace , we can see periods of time when almost all processes are idle. This means that we are not using the processor at full capacity.Garbage collector trace
To enable garbage collection (GC) tracing, run the program with an environment variable GODEBUG=gctrace=1:GODEBUG=gctrace=1 ./redins -c config1.json
.
.
.
gc 30 @3.727s 1%: 0.066+21+0.093 ms clock, 0.79+128/59/0+1.1 ms cpu, 67->71->45 MB, 76 MB goal, 12 P
gc 31 @3.784s 2%: 0.030+27+0.053 ms clock, 0.36+177/81/7.8+0.63 ms cpu, 79->84->55 MB, 90 MB goal, 12 P
gc 32 @3.858s 3%: 0.026+34+0.024 ms clock, 0.32+234/104/0+0.29 ms cpu, 96->100->65 MB, 110 MB goal, 12 P
gc 33 @3.954s 3%: 0.026+44+0.13 ms clock, 0.32+191/131/57+1.6 ms cpu, 117->123->79 MB, 131 MB goal, 12 P
gc 34 @4.077s 4%: 0.010+53+0.024 ms clock, 0.12+241/159/69+0.29 ms cpu, 142->147->91 MB, 158 MB goal, 12 P
gc 35 @4.228s 5%: 0.017+61+0.12 ms clock, 0.20+296/179/94+1.5 ms cpu, 166->174->105 MB, 182 MB goal, 12 P
gc 36 @4.391s 6%: 0.017+73+0.086 ms clock, 0.21+492/216/4.0+1.0 ms cpu, 191->198->122 MB, 210 MB goal, 12 P
gc 37 @4.590s 7%: 0.049+85+0.095 ms clock, 0.59+618/253/0+1.1 ms cpu, 222->230->140 MB, 244 MB goal, 12 P
.
.
.
As we see here, the amount of memory used increases, and the amount of time gc takes to complete his work also increases. This means that we consume more memory than it can handle.You GODEBUGcan learn more about and some other golang environment variables here .Enabling Profiler
go tool pprof- A tool for analyzing and profiling data. There are two ways to configure pprof: either directly call functions runtime/pprofin your code, for example pprof.StartCPUProfile(), or install an net/http/pprofhttp listner and get data from there, which we did. It has a pprofvery small resource consumption, so it can be used safely in development, but the profile endpoint should not be publicly available, since sensitive data can be disclosed.All we need to do for the second option is to import the “net / http / pprof” package :import (
_ "net/http/pprof"
)
then add an http listner:go func() {
log.Println(http.ListenAndServe("localhost:6060", nil))
}()
Pprof has several default profiles:- allocs : fetch all past memory allocations
- block : stack trace that led to blocking of synchronization primitives
- goroutine : stack trace of all current goroutines
- heap : fetch memory allocations of live objects.
- mutex : stack trace of conflicting mutex holders
- profile : processor profile.
- threadcreate : a stack trace that led to the creation of new threads in the OS
- trace : trace the execution of the current program.
Note: the trace endpoint, unlike all other endpoints, is a trace profile , not pprof , you can view it using go tool trace instead go tool pprof.
Now that everything is ready, we can look at the available tools.Processor profiler
$ go tool pprof http:
The processor profiler by default runs for 30 seconds (we can change this by setting the parameter seconds) and collects samples every 100 milliseconds, after which it goes into interactive mode. The most common commands are available top, list, web.Use top nto view the hottest entries in text format, there are also two options for sorting output, -cumfor cumulative order and -flat.(pprof) top 10 -cum
Showing nodes accounting for 1.50s, 6.19% of 24.23s total
Dropped 347 nodes (cum <= 0.12s)
Showing top 10 nodes out of 186
flat flat% sum% cum cum%
0.03s 0.12% 0.12% 16.7s 69.13% (*Server).serveUDPPacket
0.05s 0.21% 0.33% 15.6s 64.51% (*Server).serveDNS
0 0% 0.33% 14.3s 59.10% (*ServeMux).ServeDNS
0 0% 0.33% 14.2s 58.73% HandlerFunc.ServeDNS
0.01s 0.04% 0.37% 14.2s 58.73% main.handleRequest
0.07s 0.29% 0.66% 13.5s 56.00% (*DnsRequestHandler).HandleRequest
0.99s 4.09% 4.75% 7.56s 31.20% runtime.gentraceback
0.02s 0.08% 4.83% 7.02s 28.97% runtime.systemstack
0.31s 1.28% 6.11% 6.62s 27.32% runtime.mallocgc
0.02s 0.08% 6.19% 6.35s 26.21% (*DnsRequestHandler).FindANAME
(pprof)
use listto explore function.(pprof) list handleRequest
Total: 24.23s
ROUTINE ======================== main.handleRequest in /home/arash/go/src/arvancloud/redins/redins.go
10ms 14.23s (flat, cum) 58.73% of Total
. . 35: l *handler.RateLimiter
. . 36: configFile string
. . 37:)
. . 38:
. . 39:func handleRequest(w dns.ResponseWriter, r *dns.Msg) {
10ms 610ms 40: context := handler.NewRequestContext(w, r)
. 50ms 41: logger.Default.Debugf("handle request: [%d] %s %s", r.Id, context.RawName(), context.Type())
. . 42:
. . 43: if l.CanHandle(context.IP()) {
. 13.57s 44: h.HandleRequest(context)
. . 45: } else {
. . 46: context.Response(dns.RcodeRefused)
. . 47: }
. . 48:}
. . 49:
(pprof)
The team webgenerates an SVG-graph of critical areas and opens it in the browser.(pprof)web handleReques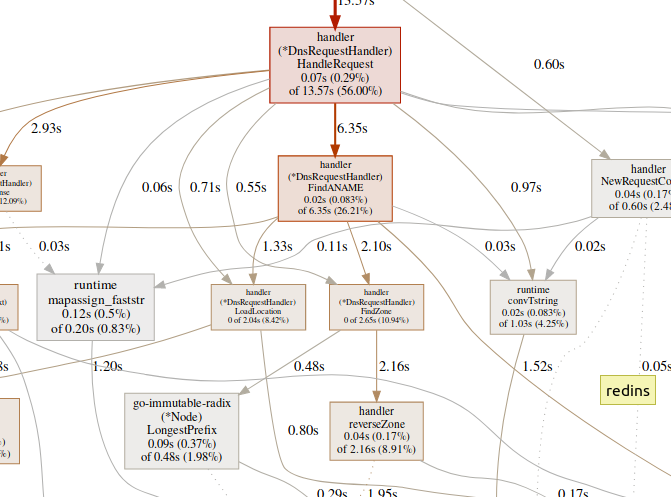 A large amount of time spent in GC functions, such as
 runtime.mallocgc, often results in significant memory allocation, which can add load to the garbage collector and increase latency.A large amount of time spent on synchronization mechanisms, such as runtime.chansendor runtime.lock, may be a sign of conflict.A large amount of time spent on syscall.Read/Writemeans excessive use of I / O operations.Memory profiler
$ go tool pprof http:
By default, it shows the lifetime of the allocated memory. We can see the number of selected objects using -alloc_objectsother useful options: -iuse_objectsand -inuse_spacefor checking live memory.Usually, if you want to reduce memory consumption, you need to look at -inuse_space, but if you want to reduce latency, look at -alloc_objectsafter enough run / load time.Identification of a bottleneck
It is important to first determine the type of bottleneck (processor, I / O, memory) that we are dealing with. In addition to profilers, there is another type of tool.go tool tracecan show what goroutines do in detail. To collect a trace example, we need to send an http request to the trace endpoint:$ curl http:
The generated file can be viewed using the trace tool:$ go tool trace trace.out
2019/12/25 15:30:50 Parsing trace...
2019/12/25 15:30:59 Splitting trace...
2019/12/25 15:31:10 Opening browser. Trace viewer is listening on http:
Go tool trace is a web application that uses the Chrome DevTools protocol and is compatible only with Chrome browsers. The main page looks something like this:View trace (0s-409.575266ms)View trace (411.075559ms-747.252311ms)View trace (747.252311ms-1.234968945s)View trace (1.234968945s-1.774245108s)View trace (1.774245484s-2.111339514s)View trace (2.111339514s-2.674030898s)View trace (2.674031362s-3.044145798s)View trace (3.044145798s-3.458795252s)View trace (3.43953778s-4.075080634s)View trace (4.075081098s-4.439271287s)View35 4.439 -4.814869651s)View trace (4.814869651s-5.253597835s)Goroutine analysisNetwork blocking profile ()The Synchronization blocking profile ()SYSCALL blocking profile ()Scheduler latency The profile ()the User-defined tasksthe User-defined regions For RentAircraftthe Minimum the mutator utilizationTrace divides the trace so that your browser can handle it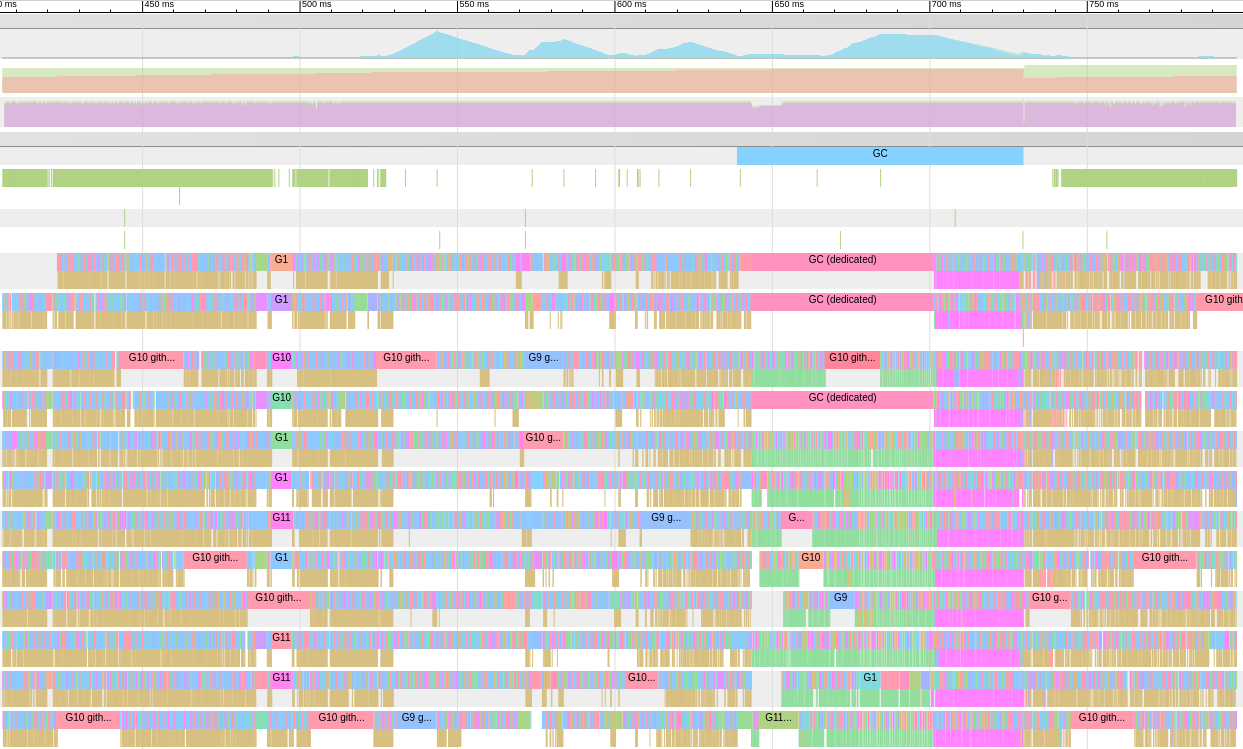 There are a huge variety of data, which makes them almost unreadable if we don’t know what we are looking for. Let's leave it for now.The following link on the main page is “goroutine analysis” , which shows the different types of working goroutines in the program during the trace period:
Goroutines:
github.com/miekg/dns.(*Server).serveUDPPacket N=441703
runtime.gcBgMarkWorker N=12
github.com/karlseguin/ccache.(*Cache).worker N=2
main.Start.func1 N=1
runtime.bgsweep N=1
arvancloud/redins/handler.NewHandler.func2 N=1
runtime/trace.Start.func1 N=1
net/http.(*conn).serve N=1
runtime.timerproc N=3
net/http.(*connReader).backgroundRead N=1
N=40
Click on the first element with N = 441703 , this is what we get: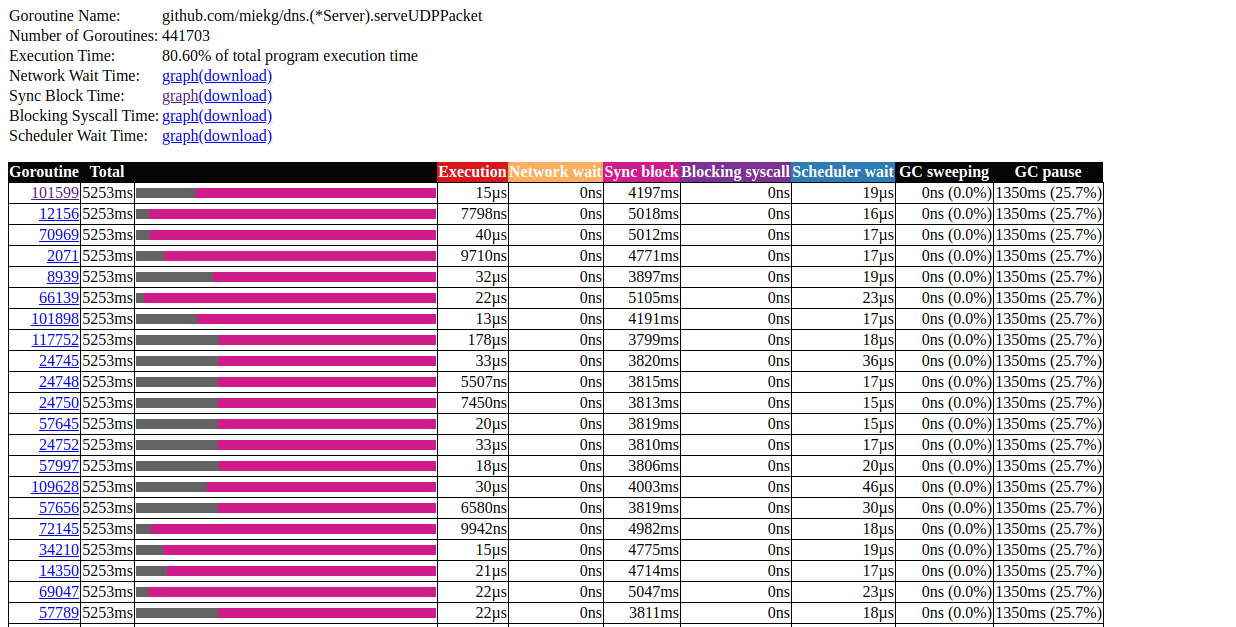 goroutin analysisThis is very interesting. Most operations take almost no time to complete, and most of the time is spent in the Sync block. Let's take a closer look at one of them:
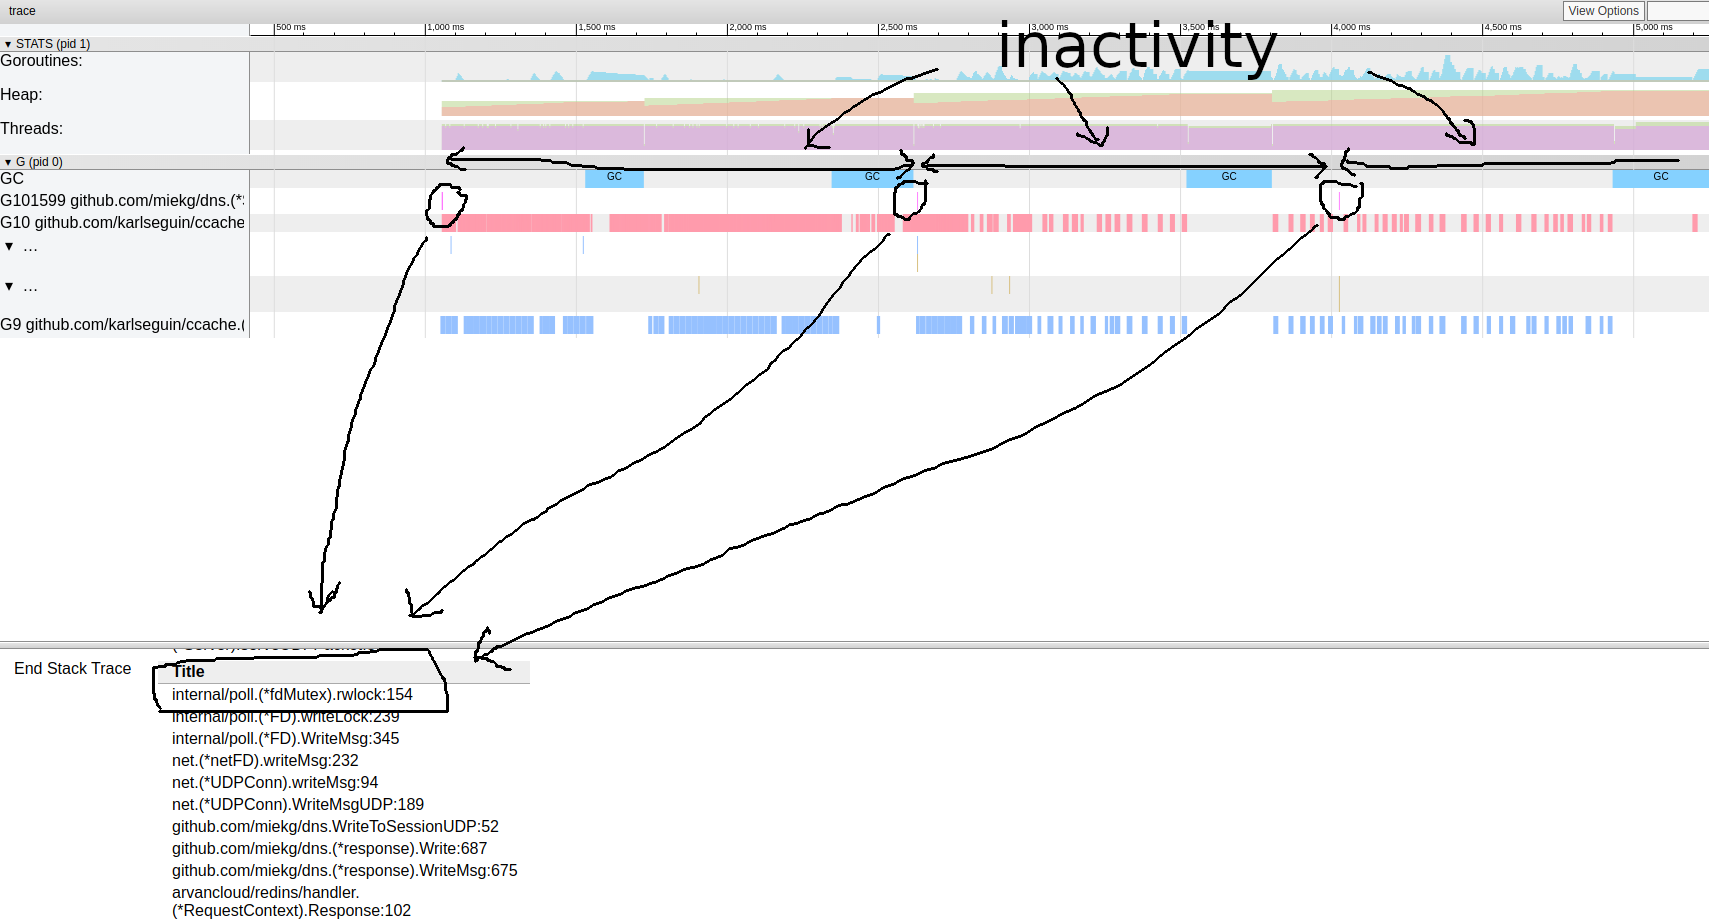 goroutine trace patternIt seems that our program is almost always inactive. From here we can go directly to the lock tool; lock profiling is disabled by default, we need to enable it in our code first:
runtime.SetBlockProfileRate(1)
Now we can get a selection of locks:$ go tool pprof http:
(pprof) top
Showing nodes accounting for 16.03wks, 99.75% of 16.07wks total
Dropped 87 nodes (cum <= 0.08wks)
Showing top 10 nodes out of 27
flat flat% sum% cum cum%
10.78wks 67.08% 67.08% 10.78wks 67.08% internal/poll.(*fdMutex).rwlock
5.25wks 32.67% 99.75% 5.25wks 32.67% sync.(*Mutex).Lock
0 0% 99.75% 5.25wks 32.67% arvancloud/redins/handler.(*DnsRequestHandler).Filter
0 0% 99.75% 5.25wks 32.68% arvancloud/redins/handler.(*DnsRequestHandler).FindANAME
0 0% 99.75% 16.04wks 99.81% arvancloud/redins/handler.(*DnsRequestHandler).HandleRequest
0 0% 99.75% 10.78wks 67.08% arvancloud/redins/handler.(*DnsRequestHandler).Response
0 0% 99.75% 10.78wks 67.08% arvancloud/redins/handler.(*RequestContext).Response
0 0% 99.75% 5.25wks 32.67% arvancloud/redins/handler.ChooseIp
0 0% 99.75% 16.04wks 99.81% github.com/miekg/dns.(*ServeMux).ServeDNS
0 0% 99.75% 16.04wks 99.81% github.com/miekg/dns.(*Server).serveDNS
(pprof)
Here we have two different locks ( poll.fdMutex and sync.Mutex ), responsible for almost 100% of the locks. This confirms our assumption about a lock conflict, now we only need to find where this happens:(pprof) svg lock
This command creates a vector graph of all nodes that take into account conflicts, with an emphasis on blocking functions: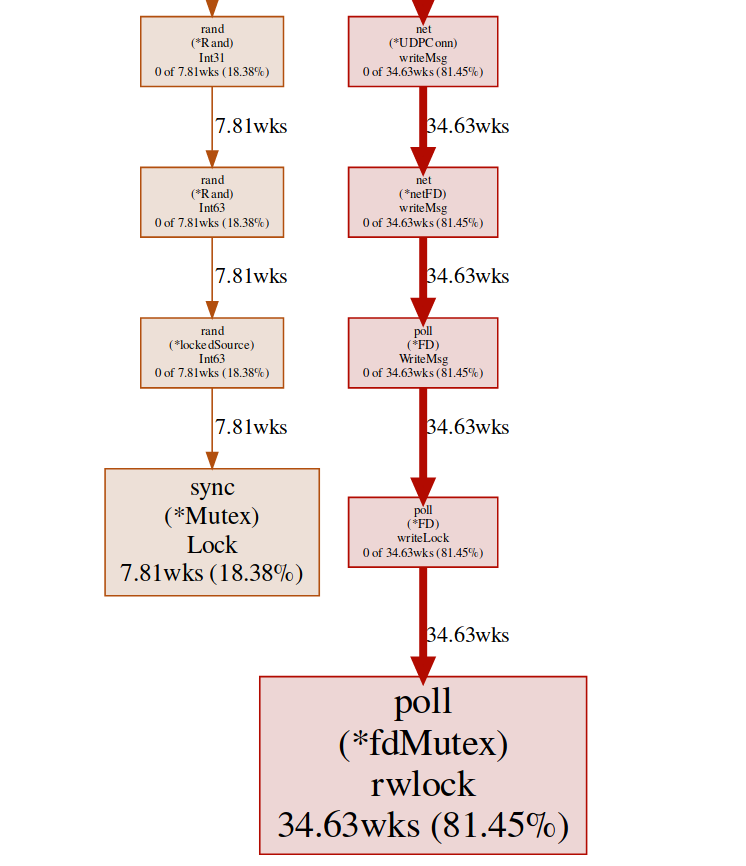 svg-graph of the blocking endpointwe can get the same result from the goroutine endpoint:
$ go tool pprof http:
and then:(pprof) top
Showing nodes accounting for 294412, 100% of 294424 total
Dropped 84 nodes (cum <= 1472)
Showing top 10 nodes out of 32
flat flat% sum% cum cum%
294404 100% 100% 294404 100% runtime.gopark
8 0.0027% 100% 294405 100% github.com/miekg/dns.(*Server).serveUDPPacket
0 0% 100% 58257 19.79% arvancloud/redins/handler.(*DnsRequestHandler).Filter
0 0% 100% 58259 19.79% arvancloud/redins/handler.(*DnsRequestHandler).FindANAME
0 0% 100% 293852 99.81% arvancloud/redins/handler.(*DnsRequestHandler).HandleRequest
0 0% 100% 235406 79.95% arvancloud/redins/handler.(*DnsRequestHandler).Response
0 0% 100% 235406 79.95% arvancloud/redins/handler.(*RequestContext).Response
0 0% 100% 58140 19.75% arvancloud/redins/handler.ChooseIp
0 0% 100% 293852 99.81% github.com/miekg/dns.(*ServeMux).ServeDNS
0 0% 100% 293900 99.82% github.com/miekg/dns.(*Server).serveDNS
(pprof)
almost all of our programs are located in runtime.gopark, it is a go scheduler that sleeps goroutines; a very common reason for this is a lock conflict(pprof) svg gopark
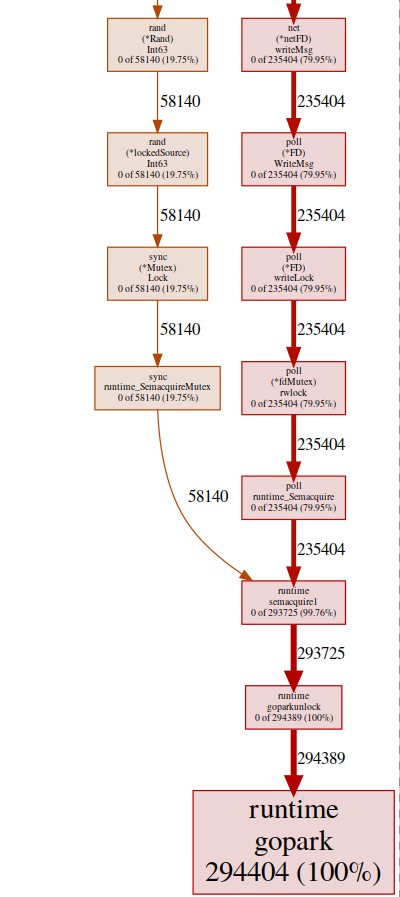 svg-graph of the endpoint goroutinHere we see two sources of conflict:
UDPConn.WriteMsg ()
It seems that all answers end up writing to the same FD (hence the lock), this makes sense, since they all have the same source address.We conducted a small experiment with various solutions, and in the end we decided to use several listeners to balance the load. Thus, we allow the OS to balance incoming requests between different connections and reduce conflicts.Rand ()
It looks like there is a lock in regular math / rand functions (more on this here ). This can be easily fixed with the help of Rand.New()a random number generator that creates a non-blocking wrapper.rg := rand.New(rand.NewSource(int64(time.Now().Nanosecond())))
It's a little better, but creating a new source is expensive every time. Is it possible to do even better? In our case, we really do not need a random number. We just need a uniform distribution to balance the load, and it turns out that it Time.Nanoseconds()may suit us.Now that we have removed all the unnecessary locks, let's look at the results: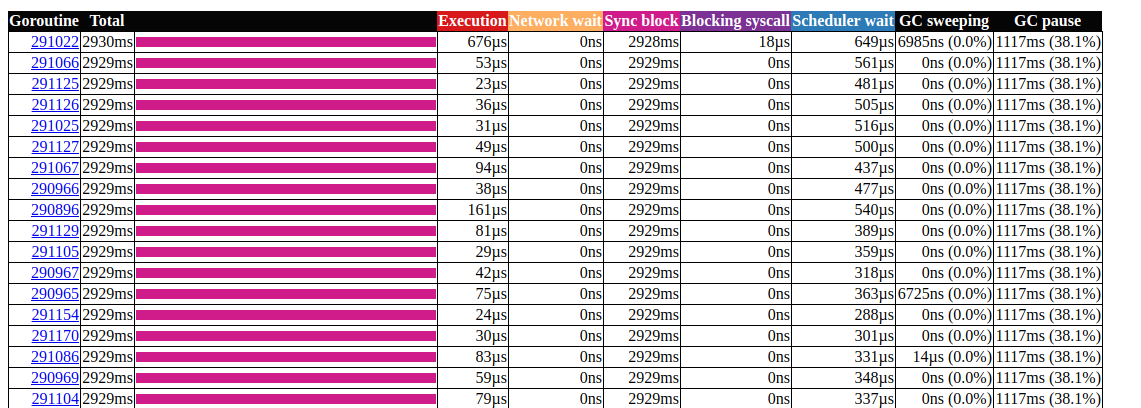 goroutin analysisLooks better, but still, most of the time it takes to lock the synchronization. Let's take a look at the synchronization lock profile from the main page of the trace user interface:
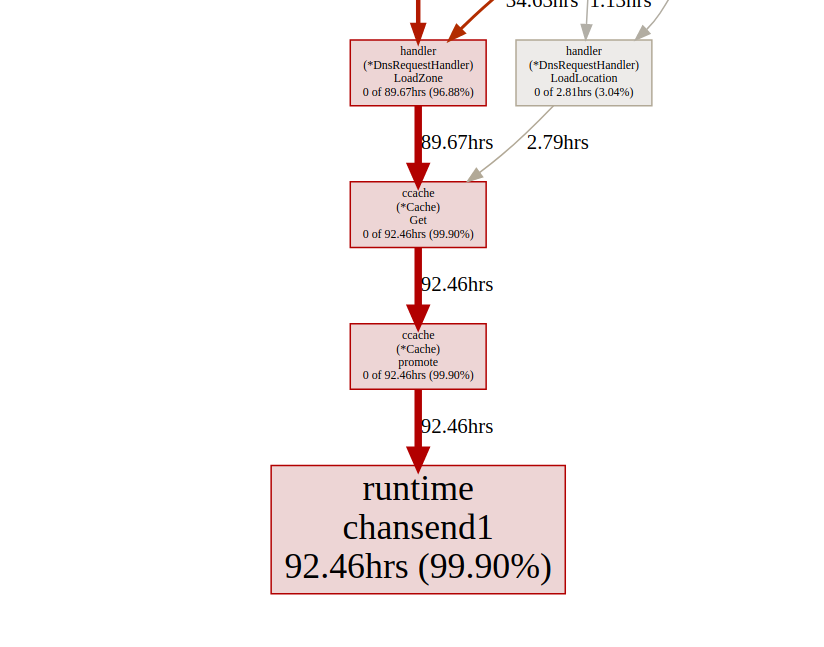 synchronization lock timelineLet's take a look at the boost function
 ccachefrom the lock endpoint pprof:(pprof) list promote
ROUTINE ======================== github.com/karlseguin/ccache.(*Cache).promote in ...
0 9.66days (flat, cum) 99.70% of Total
. . 155: h.Write([]byte(key))
. . 156: return c.buckets[h.Sum32()&c.bucketMask]
. . 157:}
. . 158:
. . 159:func (c *Cache) promote(item *Item) {
. 9.66days 160: c.promotables <- item
. . 161:}
. . 162:
. . 163:func (c *Cache) worker() {
. . 164: defer close(c.donec)
. . 165:
All calls ccache.Get()end in one channel c.promotables. Caching is an important part of our service, we should consider other options; In Dgraph has an excellent article about the cache state! Go , they also have excellent caching module called ristretto . Unfortunately, ristretto does not yet support Ttl-based release, we could get around this problem by using a very large one MaxCostand keeping the timeout value in our cache structure (we want to keep outdated data in the cache). Let's see the result when using ristretto: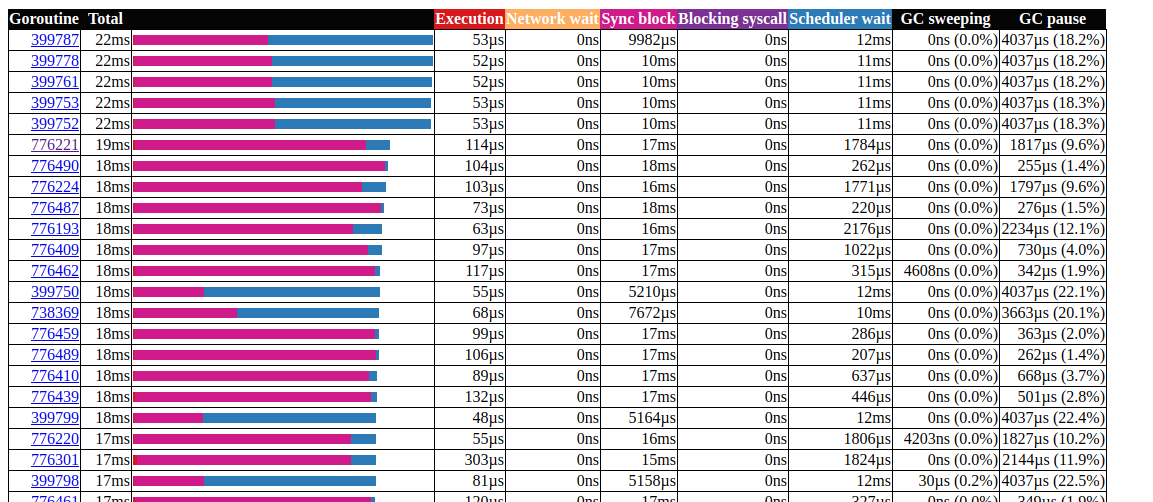 goroutin analysisGreat!We were able to reduce the maximum runtime of gorutin from 5000 ms to 22 ms. However, most of the execution time is divided between “synchronization lock” and “waiting for the scheduler”. Let's see if we can do something about it: the
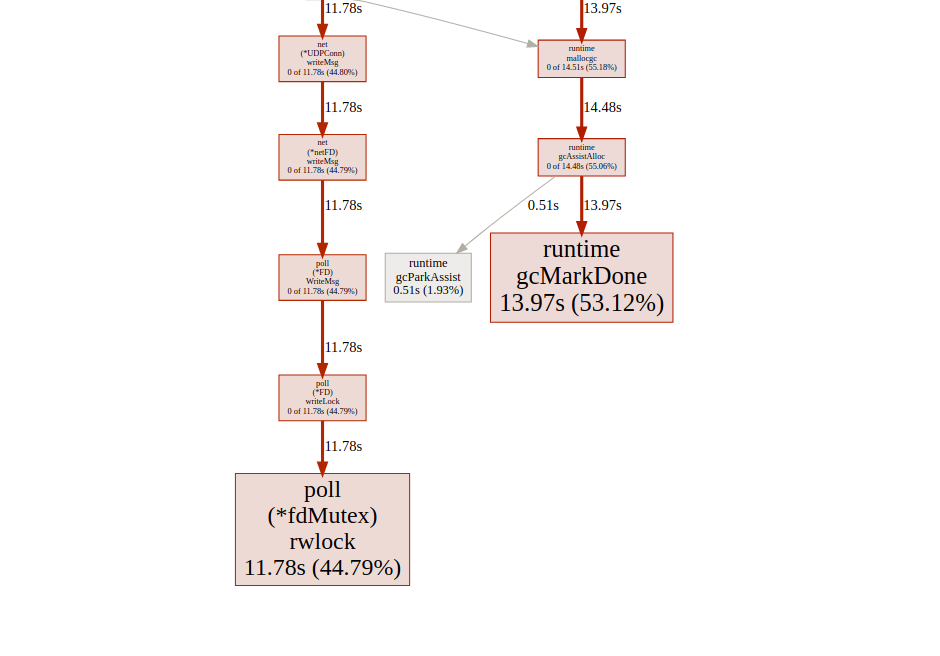 synchronization lock timelineWe can do little with it
 fdMutex.rwlock, now let's focus on another: gcMarkDone, which is responsible for 53% of the block time. This feature is part of the garbage collection process. Their presence in the critical section is often a sign that we are overloading gc.allocation optimization
At this point, it may be useful to see how garbage collection works; Go uses a mark-and-sweep picker. It keeps track of everything that is selected, and as soon as it reaches twice the size (or any other value that GOGC is set to) the size of the previous size, GC cleanup starts. The assessment takes place in three stages:- Marker Setting (STW)
- Marking (parallel)
- Labeling End (STW)
The Stop The World (STW) phases stop the entire process, although they are usually very short, continuous cycles can increase the duration. This is because at present (go v1.13) goroutines are supplanted only at the points of the function call, therefore, for a continuous cycle, an arbitrarily long pause time is possible, since the GC expects all goroutines to stop.During marking, gc uses about 25% GOMAXPROCS, but additional auxiliary functions can be forcibly added to mark assist , this happens when the fast-moving goroutine outpaces the background marker to reduce the delay caused by gc, we need to minimize heap usage.Two things to note:- the number of allocations is more important than the size (for example, 1000 memory allocations from a 20-byte structure create much more load on the heap than a single allocation of 20,000 bytes);
- unlike languages like C / C ++, not all memory allocations end up on the heap. The go compiler decides whether the variable will move to the heap or whether it can be placed inside the stack frame. Unlike variables allocated on the heap, variables allocated on the stack do not load gc.
For more information on the Go memory model and GC architecture, see this presentation .To optimize memory allocation, we use the go toolkit:- processor profiler to find hot distributions;
- memory profiler for tracking allocations;
- tracer for patterns; Gc
- escape analysis to find out why allocation occurs.
Let's start with the processor profiler:$ go tool pprof http:
(pprof) top 20 -cum
Showing nodes accounting for 7.27s, 29.10% of 24.98s total
Dropped 315 nodes (cum <= 0.12s)
Showing top 20 nodes out of 201
flat flat% sum% cum cum%
0 0% 0% 16.42s 65.73% github.com/miekg/dns.(*Server).serveUDPPacket
0.02s 0.08% 0.08% 16.02s 64.13% github.com/miekg/dns.(*Server).serveDNS
0.02s 0.08% 0.16% 13.69s 54.80% github.com/miekg/dns.(*ServeMux).ServeDNS
0.01s 0.04% 0.2% 13.48s 53.96% github.com/miekg/dns.HandlerFunc.ServeDNS
0.02s 0.08% 0.28% 13.47s 53.92% main.handleRequest
0.24s 0.96% 1.24% 12.50s 50.04% arvancloud/redins/handler.(*DnsRequestHandler).HandleRequest
0.81s 3.24% 4.48% 6.91s 27.66% runtime.gentraceback
3.82s 15.29% 19.78% 5.48s 21.94% syscall.Syscall
0.02s 0.08% 19.86% 5.44s 21.78% arvancloud/redins/handler.(*DnsRequestHandler).Response
0.06s 0.24% 20.10% 5.25s 21.02% arvancloud/redins/handler.(*RequestContext).Response
0.03s 0.12% 20.22% 4.97s 19.90% arvancloud/redins/handler.(*DnsRequestHandler).FindANAME
0.56s 2.24% 22.46% 4.92s 19.70% runtime.mallocgc
0.07s 0.28% 22.74% 4.90s 19.62% github.com/miekg/dns.(*response).WriteMsg
0.04s 0.16% 22.90% 4.40s 17.61% github.com/miekg/dns.(*response).Write
0.01s 0.04% 22.94% 4.36s 17.45% github.com/miekg/dns.WriteToSessionUDP
1.43s 5.72% 28.66% 4.30s 17.21% runtime.pcvalue
0.01s 0.04% 28.70% 4.15s 16.61% runtime.newstack
0.06s 0.24% 28.94% 4.09s 16.37% runtime.copystack
0.01s 0.04% 28.98% 4.05s 16.21% net.(*UDPConn).WriteMsgUDP
0.03s 0.12% 29.10% 4.04s 16.17% net.(*UDPConn).writeMsg
We are particularly interested in related functions, mallocgcthis is where help with tags(pprof) svg mallocgc
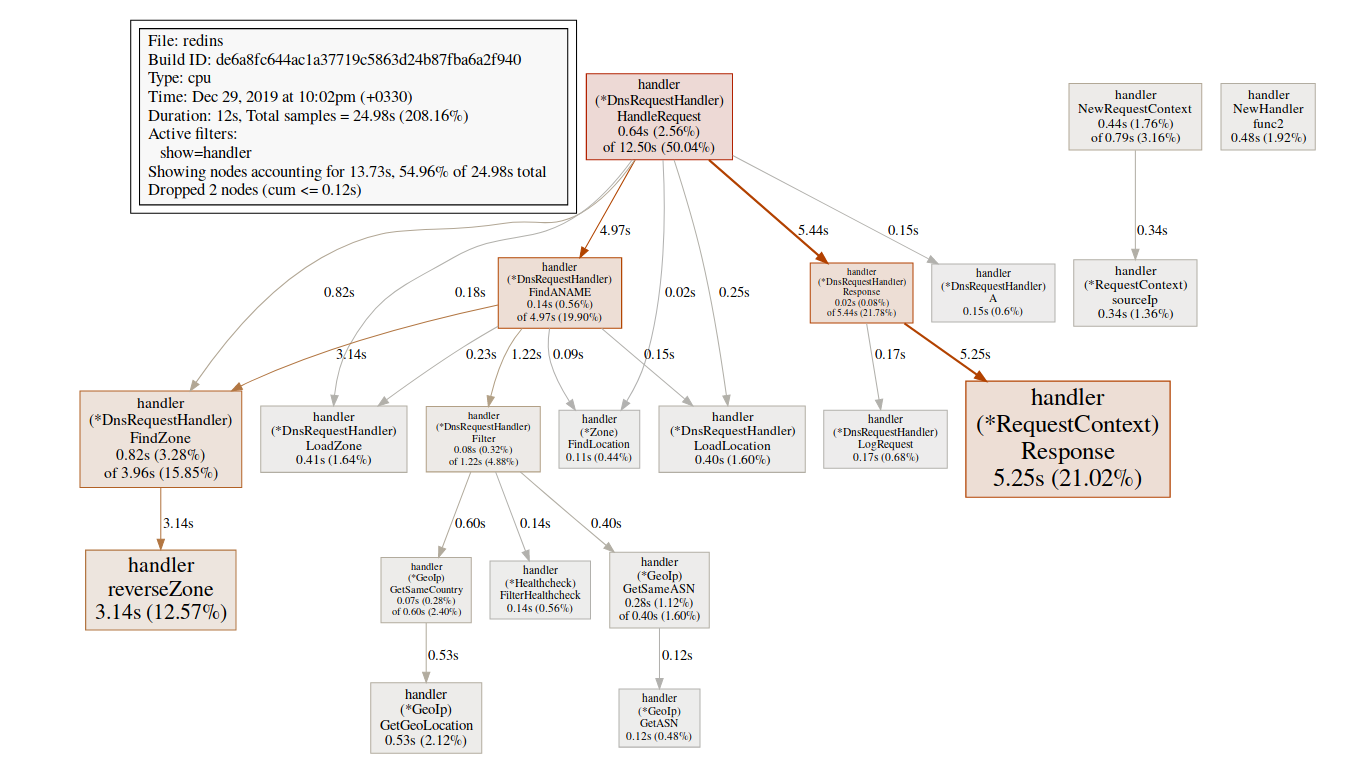 We can track the distribution using the endpoint
 alloc, the option alloc_objectmeans the total number of allocations, there are other options for using memory and allocation space.$ go tool pprof -alloc_objects http:
(pprof) top -cum
Active filters:
show=handler
Showing nodes accounting for 58464353, 59.78% of 97803168 total
Dropped 1 node (cum <= 489015)
Showing top 10 nodes out of 19
flat flat% sum% cum cum%
15401215 15.75% 15.75% 70279955 71.86% arvancloud/redins/handler.(*DnsRequestHandler).HandleRequest
2392100 2.45% 18.19% 27198697 27.81% arvancloud/redins/handler.(*DnsRequestHandler).FindANAME
711174 0.73% 18.92% 14936976 15.27% arvancloud/redins/handler.(*DnsRequestHandler).Filter
0 0% 18.92% 14161410 14.48% arvancloud/redins/handler.(*DnsRequestHandler).Response
14161410 14.48% 33.40% 14161410 14.48% arvancloud/redins/handler.(*RequestContext).Response
7284487 7.45% 40.85% 11118401 11.37% arvancloud/redins/handler.NewRequestContext
10439697 10.67% 51.52% 10439697 10.67% arvancloud/redins/handler.reverseZone
0 0% 51.52% 10371430 10.60% arvancloud/redins/handler.(*DnsRequestHandler).FindZone
2680723 2.74% 54.26% 8022046 8.20% arvancloud/redins/handler.(*GeoIp).GetSameCountry
5393547 5.51% 59.78% 5393547 5.51% arvancloud/redins/handler.(*DnsRequestHandler).LoadLocation
From now on, we can use list for each function and see if we can reduce memory allocation. Let's check:printf-like functions(pprof) list handleRequest
Total: 97803168
ROUTINE ======================== main.handleRequest in /home/arash/go/src/arvancloud/redins/redins.go
2555943 83954299 (flat, cum) 85.84% of Total
. . 35: l *handler.RateLimiter
. . 36: configFile string
. . 37:)
. . 38:
. . 39:func handleRequest(w dns.ResponseWriter, r *dns.Msg) {
. 11118401 40: context := handler.NewRequestContext(w, r)
2555943 2555943 41: logger.Default.Debugf("handle request: [%d] %s %s", r.Id, context.RawName(), context.Type())
. . 42:
. . 43: if l.CanHandle(context.IP()) {
. 70279955 44: h.HandleRequest(context)
. . 45: } else {
. . 46: context.Response(dns.RcodeRefused)
. . 47: }
. . 48:}
. . 49:
Line 41 is especially interesting, even when debugging is turned off, memory is still allocated there, we can use escape analysis to examine it in more detail.Go Escape Analysis Tool is actually a compiler flag$ go build -gcflags '-m'
You can add another -m for more information.$ go build -gcflags '-m '
for a more convenient interface, use view-annotated-file .$ go build -gcflags '-m'
.
.
.
../redins.go:39:20: leaking param: w
./redins.go:39:42: leaking param: r
./redins.go:41:55: r.MsgHdr.Id escapes to heap
./redins.go:41:75: context.RawName() escapes to heap
./redins.go:41:91: context.Request.Type() escapes to heap
./redins.go:41:23: handleRequest []interface {} literal does not escape
./redins.go:219:17: leaking param: path
.
.
.
Here all the parameters Debugfgo to heap. This is due to the way of determining Debugf:func (l *EventLogger) Debugf(format string, args ...interface{})
All parameters are argsconverted to a type interface{}that is always dumped to the heap. We can either delete the debug logs, or use a library of logs with a zero distribution, for example, zerolog .For more information about escape analysis, see “allocation eficiency in golang” .Work with strings(pprof) list reverseZone
Total: 100817064
ROUTINE ======================== arvancloud/redins/handler.reverseZone in /home/arash/go/src/arvancloud/redins/handler/handler.go
6127746 10379086 (flat, cum) 10.29% of Total
. . 396: logger.Default.Warning("log queue is full")
. . 397: }
. . 398:}
. . 399:
. . 400:func reverseZone(zone string) string {
. 4251340 401: x := strings.Split(zone, ".")
. . 402: var y string
. . 403: for i := len(x) - 1; i >= 0; i-- {
6127746 6127746 404: y += x[i] + "."
. . 405: }
. . 406: return y
. . 407:}
. . 408:
. . 409:func (h *DnsRequestHandler) LoadZones() {
(pprof)
Since a line in Go is immutable, creating a temporary line causes memory allocation. Starting with Go 1.10, you can use it strings.Builderto create a string.(pprof) list reverseZone
Total: 93437002
ROUTINE ======================== arvancloud/redins/handler.reverseZone in /home/arash/go/src/arvancloud/redins/handler/handler.go
0 7580611 (flat, cum) 8.11% of Total
. . 396: logger.Default.Warning("log queue is full")
. . 397: }
. . 398:}
. . 399:
. . 400:func reverseZone(zone string) string {
. 3681140 401: x := strings.Split(zone, ".")
. . 402: var sb strings.Builder
. 3899471 403: sb.Grow(len(zone)+1)
. . 404: for i := len(x) - 1; i >= 0; i-- {
. . 405: sb.WriteString(x[i])
. . 406: sb.WriteByte('.')
. . 407: }
. . 408: return sb.String()
Since we do not care about the value of the inverted line, we can eliminate Split()it by simply flipping the entire line.(pprof) list reverseZone
Total: 89094296
ROUTINE ======================== arvancloud/redins/handler.reverseZone in /home/arash/go/src/arvancloud/redins/handler/handler.go
3801168 3801168 (flat, cum) 4.27% of Total
. . 400:func reverseZone(zone string) []byte {
. . 401: runes := []rune("." + zone)
. . 402: for i, j := 0, len(runes)-1; i < j; i, j = i+1, j-1 {
. . 403: runes[i], runes[j] = runes[j], runes[i]
. . 404: }
3801168 3801168 405: return []byte(string(runes))
. . 406:}
. . 407:
. . 408:func (h *DnsRequestHandler) LoadZones() {
. . 409: h.LastZoneUpdate = time.Now()
. . 410: zones, err := h.Redis.SMembers("redins:zones")
Read more about working with strings here .sync.Pool
(pprof) list GetASN
Total: 69005282
ROUTINE ======================== arvancloud/redins/handler.(*GeoIp).GetASN in /home/arash/go/src/arvancloud/redins/handler/geoip.go
1146897 1146897 (flat, cum) 1.66% of Total
. . 231:func (g *GeoIp) GetASN(ip net.IP) (uint, error) {
1146897 1146897 232: var record struct {
. . 233: AutonomousSystemNumber uint `maxminddb:"autonomous_system_number"`
. . 234: }
. . 235: err := g.ASNDB.Lookup(ip, &record)
. . 236: if err != nil {
. . 237: logger.Default.Errorf("lookup failed : %s", err)
(pprof) list GetGeoLocation
Total: 69005282
ROUTINE ======================== arvancloud/redins/handler.(*GeoIp).GetGeoLocation in /home/arash/go/src/arvancloud/redins/handler/geoip.go
1376298 3604572 (flat, cum) 5.22% of Total
. . 207:
. . 208:func (g *GeoIp) GetGeoLocation(ip net.IP) (latitude float64, longitude float64, country string, err error) {
. . 209: if !g.Enable || g.CountryDB == nil {
. . 210: return
. . 211: }
1376298 1376298 212: var record struct {
. . 213: Location struct {
. . 214: Latitude float64 `maxminddb:"latitude"`
. . 215: LongitudeOffset uintptr `maxminddb:"longitude"`
. . 216: } `maxminddb:"location"`
. . 217: Country struct {
. . 218: ISOCode string `maxminddb:"iso_code"`
. . 219: } `maxminddb:"country"`
. . 220: }
. . 221:
. . 222: if err := g.CountryDB.Lookup(ip, &record); err != nil {
. . 223: logger.Default.Errorf("lookup failed : %s", err)
. . 224: return 0, 0, "", err
. . 225: }
. 2228274 226: _ = g.CountryDB.Decode(record.Location.LongitudeOffset, &longitude)
. . 227:
. . 228: return record.Location.Latitude, longitude, record.Country.ISOCode, nil
. . 229:}
. . 230:
. . 231:func (g *GeoIp) GetASN(ip net.IP) (uint, error) {
We use maxmiddb functions to get geolocation data. These functions are taken interface{}as parameters, which, as we saw earlier, can cause heap shoots.we can use sync.Poolfor caching selected but unused elements for subsequent reuse.type MMDBGeoLocation struct {
Coordinations struct {
Latitude float64 `maxminddb:"latitude"`
Longitude float64
LongitudeOffset uintptr `maxminddb:"longitude"`
} `maxminddb:"location"`
Country struct {
ISOCode string `maxminddb:"iso_code"`
} `maxminddb:"country"`
}
type MMDBASN struct {
AutonomousSystemNumber uint `maxminddb:"autonomous_system_number"`
}
func (g *GeoIp) GetGeoLocation(ip net.IP) (*MMDBGeoLocation, error) {
if !g.Enable || g.CountryDB == nil {
return nil, EMMDBNotAvailable
}
var record *MMDBGeoLocation = g.LocationPool.Get().(*MMDBGeoLocation)
logger.Default.Debugf("ip : %s", ip)
if err := g.CountryDB.Lookup(ip, &record); err != nil {
logger.Default.Errorf("lookup failed : %s", err)
return nil, err
}
_ = g.CountryDB.Decode(record.Coordinations.LongitudeOffset, &record.Coordinations.Longitude)
logger.Default.Debug("lat = ", record.Coordinations.Latitude, " lang = ", record.Coordinations.Longitude, " country = ", record.Country.ISOCode)
return record, nil
}
func (g *GeoIp) GetASN(ip net.IP) (uint, error) {
var record *MMDBASN = g.AsnPool.Get().(*MMDBASN)
err := g.ASNDB.Lookup(ip, record)
if err != nil {
logger.Default.Errorf("lookup failed : %s", err)
return 0, err
}
logger.Default.Debug("asn = ", record.AutonomousSystemNumber)
return record.AutonomousSystemNumber, nil
}
More about sync.Pool here .There are many other possible optimizations, but at the moment, it seems that we have already done enough. For more information on memory optimization techniques, you can read Allocation efficiency in high-performance Go services .results
To visualize the results of memory optimization, we use a diagram in go tool tracecalled “Minimum Mutator Utilization”, here Mutator means not gc.Before optimization: Here we have a window of about 500 milliseconds without efficient use (gc consumes all resources), and we will never get 80% effective use in the long run. We want the window of zero effective use to be as small as possible, and as quickly as possible to achieve 100% use, something like this:after optimization:
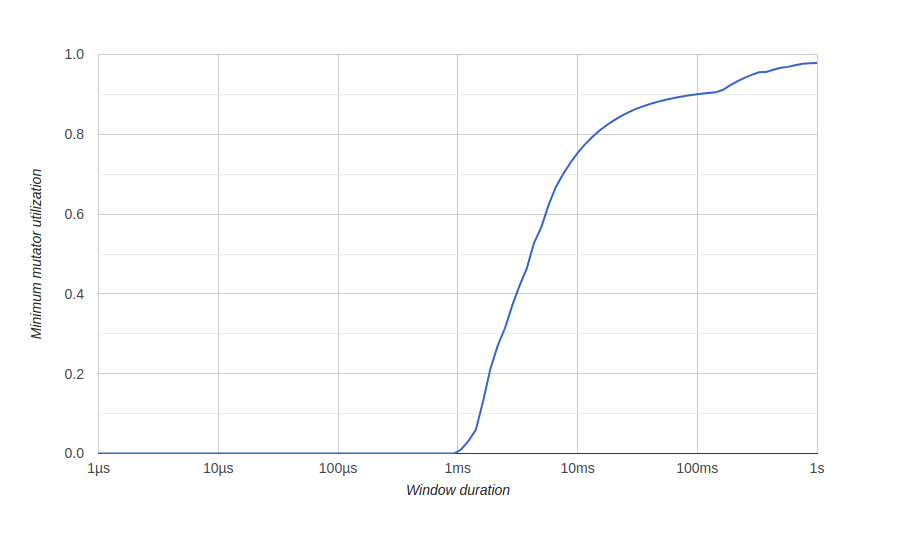
Conclusion
Using go tools, we were able to optimize our service to handle a large number of requests and better use of system resources.You can see our source code on GitHub . Here is a non-optimized version and here is an optimized one.It will also be useful
That's all. See you on the course !