Schema animation in SCADA
When creating HMI, quite often the task is to construct a mapping of a complex circuit of related elements. This can be branched pipeline schemes, electricity, etc.You can, of course, limit yourself to displaying key elements (gate valves, circuit breakers), but the larger the circuit, the more difficult it is to compose a complete picture and ensure the correct action of the operator. This article describes the coloring of elements of such schemes, describes the solution method for Simatic WinCC v7 and its implementation in Simargl SCADA. If you don’t have to work with WinCC, then you can look right at the end of the article - there is a curious video.For a more visual representation of why all this is necessary, we take a small simple scheme.Now imagine what will happen if there is an operation. How long does it take to track a product’s path through a pipeline system? We arm ourselves with a stopwatch.According to my observations, it takes 10 - 15 seconds.And now recall that (suddenly) operations can be several at the same time. This “slightly” complicates the task. Ready to test yourself again?Translating into a decent language the words of my colleague: “That's an opportunity! While you track the second route, you will forget about the first one very much. What a wonderful and convenient scheme! ”But the scheme is really simple - it doesn’t even have readings of instruments and various signatures (a special hello to fans to draw “three-dimensional” pipes). In practice, things can be worse. I have met with significantly larger schemes (more than 400 valves).What can an operator do on such a mimic? In the best case, slowly open the gate valves along the route and hope that he was not mistaken. But what if switching needs to be done quickly and the cost of the error is high?The way out of this situation is obvious - it is necessary to color the lines along the route, and it is advisable to do this before the control action. Oddly enough, I did not see a ready-made solution out of the box, even with expensive SCADA packages. An attempt to manually tint for each line threatens to delay the setup almost to infinity.
Solution for WinCC v7
I solved such a problem based on WinCC v7. Unfortunately, under the terms of the contract, I have no right to lay out a ready-made solution, but I can describe a possible solution. Suddenly someone will be helpful.I’ll note right away that this will be about the WinCC version 7 product family, since there is the opportunity to use VBA. It is necessary to warn, everything described below is more likely a hack, is used from hopelessness and is not suitable in all cases.I will continue the discussion in terms of pipes and valves, although, of course, everything will be the same for power supply schemes.Mentally divide the scheme into sections so that on each side there is only one input / output. Those. if an outlet is cut into the pipe, three sections will have to be made: before the branch, then the branch itself.To create a diagram, you will have to use two types of standard graphic objects:Connector (for drawing lines) and Circle (for creating control points of the diagram). Connector is necessary because it allows you to determine which objects in the circuit is connected, in contrast to the usual line. The standard Circle should be redone in CustomObject - this will avoid confusion when sorting elements of the mnemonic scheme and give convenient names to the properties.Part of the control points will correspond to the joints of pipelines, and part - to the gate valves. For the latter, we select any unused property and assign a VBS-action, where we create a constant and assign it a string value with the name of the valve: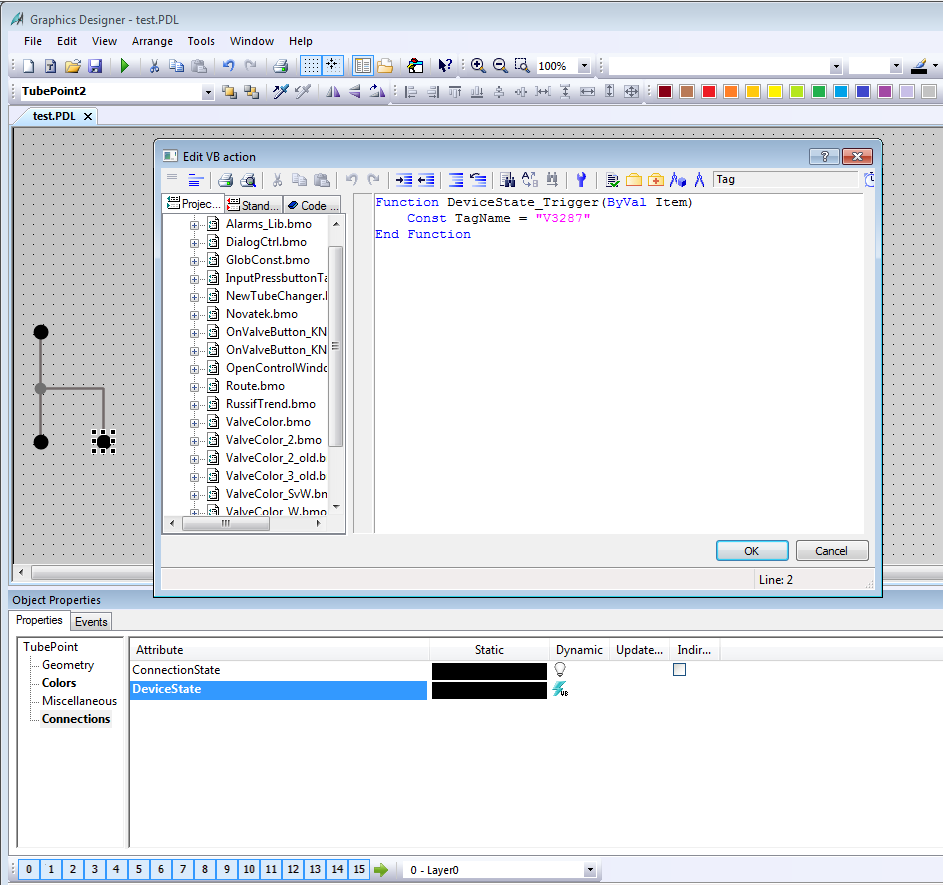 Next, we write a script on VBA that will go through all the screen elements and for each Connector create a list of indirectly connected latches, allowing you to ultimately create VBS text for the BorderColor property. This can be achieved due to the fact that Connector has two properties - TopConnectedObjectName and BottomConnectedObjectName, available in VBA.The result of this script will look something like this:
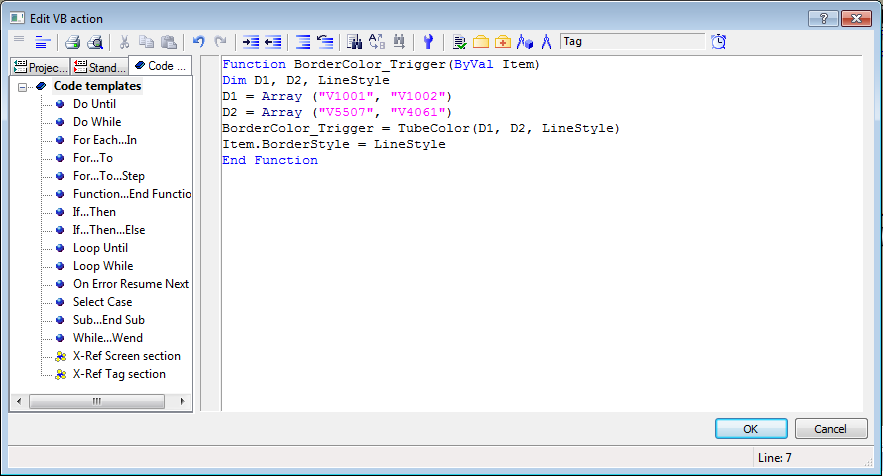 D1 and D2 - arrays with the names of the valves; TubeColor - a function that returns the color and line style depending on the state of the valves.An important point: when writing a VBS script to an element, you must also change the triggers.In the TubeColor function, it will be necessary to set all the coloring rules depending on the technological situation. Of course, TubeColor needs to be rendered in the Global script.Then the struggle will begin for performance, optimization of VBS, etc., since WinCC hardly transfers large mnemonic diagrams. But we must pay tribute to colleagues from Siemens, the speed of VBS has increased significantly, if I'm not mistaken, from version 7.3, which greatly simplified the life of developers of applied projects.
Description of implementation in Simargl SCADA
To draw animated schemes, Simargl SCADA includes two widgets:SPipeScene - a scene for drawing lines and setting coloring rules;SPipe - to specify nodal points and display changes in the state of field equipment.In fact, the process boils down to simply placing the nodal points of the circuit, binding properties to tag values, and placing widgets on top of the scene that display the status of the equipment. It all looks something like this:It is curious that to create the actual circuit, it was not necessary to write code at all.You can get the demo version of Simargl SCADA, the documentation and the project sources from the video from the facebook page . Source: https://habr.com/ru/post/undefined/
All Articles