 We already talked about how we helped one manufacturing company transform the processes of corporate training and personnel development. Employees of the customer, who were drowning in paper documents and Excel spreadsheets, received a convenient iPad-application and a web portal. One of the most important functions of this product is the creation of dynamic reports by which managers judge the work of employees “in the field”. These are huge documents with dozens of fields and average sizes of 3000 * 1600 pixels.In this article, we will talk about how to deploy this beauty based on Microsoft SQL Server Reporting Services, why such a backend can be bad friends with the web portal and what tricks will help to establish their relationship. The entire business part of the solution has already been described in the previous article, so here we focus on technical issues. Let's get started!
Formulation of the problem
We have a portal with which several hundred users work. They are arranged in a stepwise hierarchy, where each user has a supervisor of a rank higher. This differentiation of rights is necessary so that users can create events with any subordinate employees. You can jump over steps, i.e. the user can start activity with an employee of any rank lower than himself.What events are meant here? This can be training, support or certification of an employee of a trading company, which the supervisor conducts at a point of sale. The result of such an event is a questionnaire filled in on an iPad with employee ratings for professional qualities and skills.According to the questionnaires, you can prepare statistics, for example:- How many events with his subordinates of this kind did Vasya Ivanov create in a month? How many of them are completed?
- What is the percentage of satisfactory ratings? What questions do merchandisers answer the worst? Which manager is worse at taking tests?
Such statistics are contained in Reports that can be created via the web interface, in XLS, PDF, DOCX formats, and printed. All these functions are designed for managers at different levels.The content and design of the reports are defined in the templates , allowing you to set the necessary parameters. If in future users will need new types of reports, the system has the ability to create templates, specify modifiable parameters and add a template to the portal. All this - without interfering with the source code and work processes of the product.Specifications and Limitations
The portal runs on a microservice architecture, the front is written in Angular 5. The resource uses JWT authorization, supports Google Chrome, Firefox, Microsoft Edge and IE 11 browsers .All data is stored on MS SQL Server 2014. SQL Server Reporting Services (SSRS) is installed on the server, the customer uses it and is not going to refuse. Hence the most important limitation: access to SSRS is closed from the outside, so you can access the web interface and SOAP only from the local network through NTLM authorization.A few words about SSRSSSRS – , , . docs.microsoft.com, SSRS (API) ( Report Server, - HTTP).
Attention, the question: how to complete the task without manual methods, with minimal resources and maximum benefits for the customer?Since the customer has SSRS on a dedicated server, let SSRS do all the dirty work of generating and exporting reports. Then we don’t have to write our own reporting service, export modules to XLS, PDF, DOCX, HTML and the corresponding API.Thus, the task was to make SSRS friends with the portal and ensure the operation of the functions specified in the task. So let's go through the list of these scenarios - interesting subtleties were found in almost every point.Solution structure
Since we already have SSRS, there are all the tools for managing report templates:- Report Server - responsible for the entire logic of working with reports, their storage, generation, management and much more.
- Report Manager - a service with a web interface for managing reports. Here you can upload templates created in SQL Server Data Tools to the server, configure access rights, data sources and parameters (including those that can be changed when reporting requests). He is able to generate reports on downloaded templates and upload them to various formats, including XLS, PDF, DOCX and HTML.
Total: we create templates in SQL Server Data Tools, with the help of Report Manager we fill them on Report Server, we configure - and it is ready. We can generate reports, change their parameters.The next question: how to request the generation of reports on specific templates through the portal and get the result to the front for output to the UI or download in the desired format?Reporting from SSRS to the portal
As we said above, SSRS has its own API to access reports. But we do not want to give its functions out for security and digital hygiene reasons - we only need to request data from SSRS in the right form and transmit the result to the user. Report management will be handled by specially trained customer staff.Since access to SSRS is only from the local network, the data exchange between the server and the portal is through a proxy service.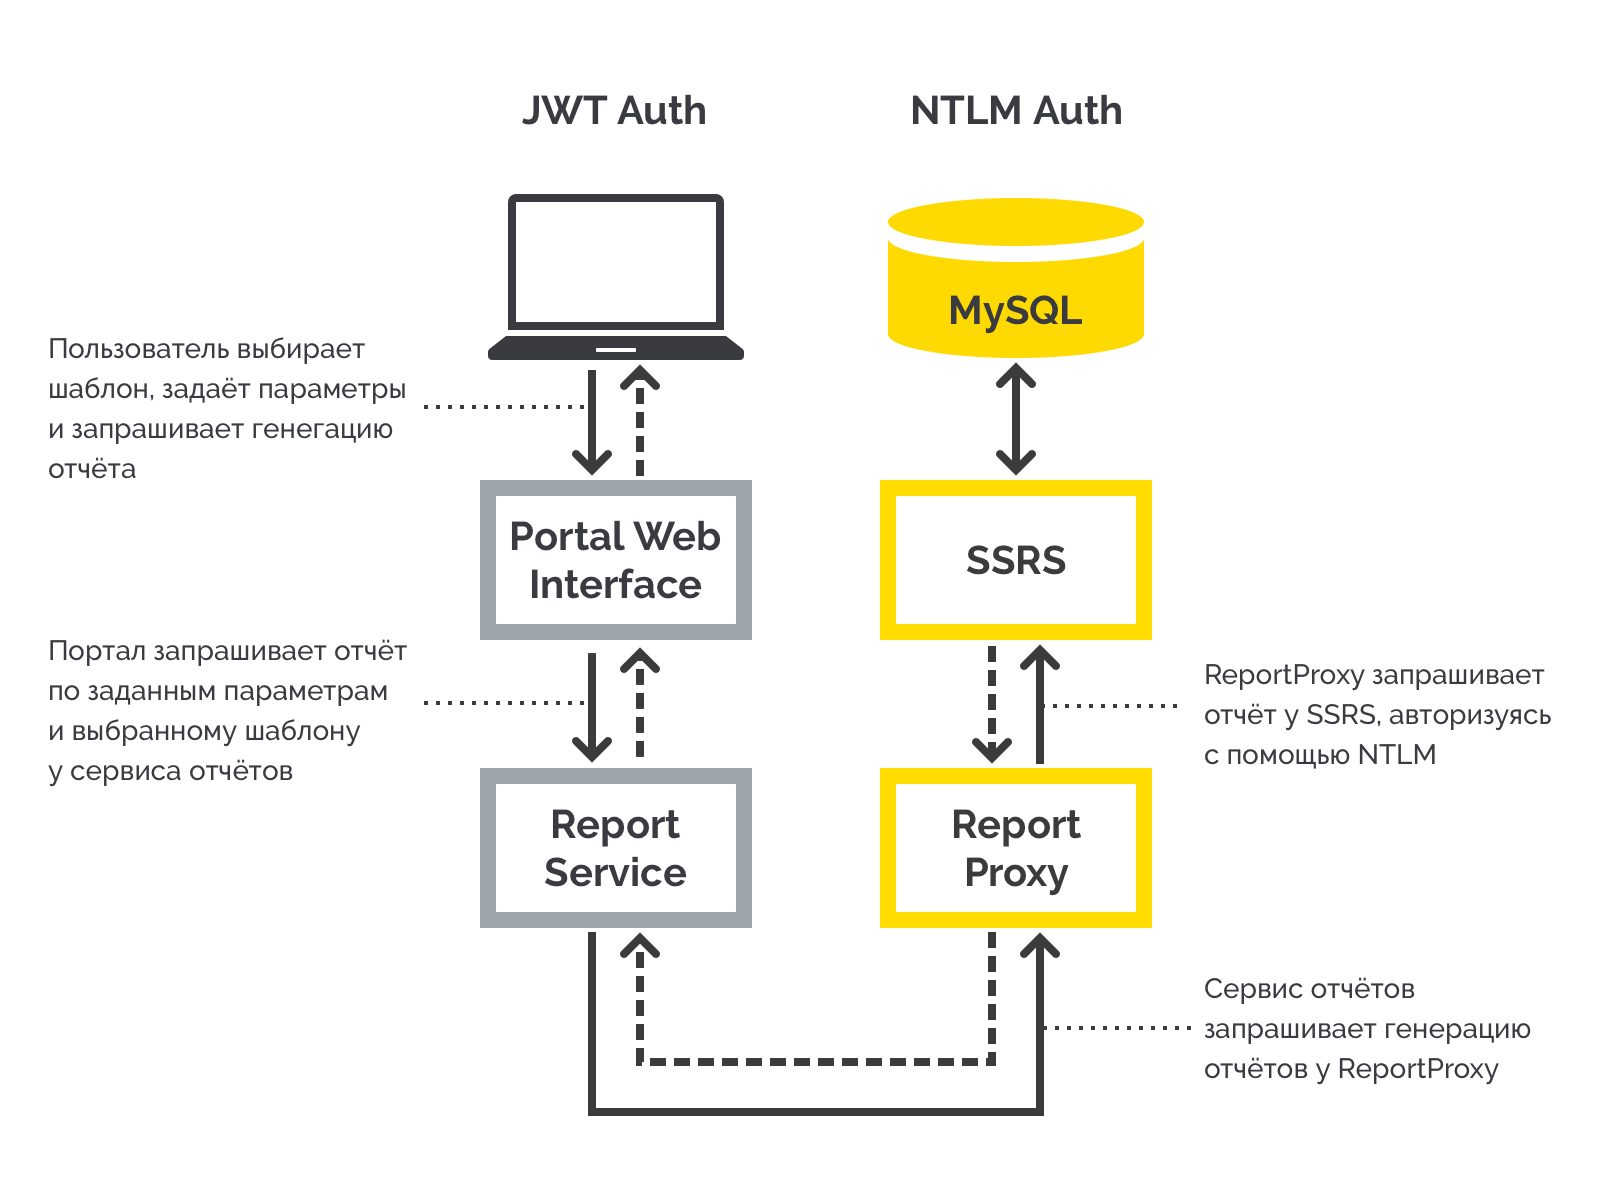 Exchange of data between the portal and the serverLet's see how it works and why ReportProxy is here.So, on the portal side, we have a ReportService, which the portal accesses for reports. The service checks the authorization of the user, the level of his rights, converts data from SSRS into the desired form under the contract.ReportService API contains only 2 methods, which are quite enough for us:
- GetReports - provides the identifiers and names of all templates that the current user can receive;
- GetReportData (format, params) - gives ready-made, exported report data in the specified format, with a given set of parameters.
Now you need these 2 methods to be able to communicate with SSRS and take the necessary data from it in the right form. From the documentation it is known that we can access the report server via HTTP using the SOAP API. It seems that the puzzle is developing ... But in fact, a surprise awaits us here.Since SSRS is closed to the outside world and you can reach it only through NTLM authentication, it is not available directly from the SOAP portal. There are also our own wishes:- Give access only to the required set of functions, and even prohibit the change;
- If you have to switch to another reporting system, the edits in the ReportService should be minimal, and better not be required at all.
This is where ReportProxy helps us, which is located on the same machine as SSRS and is responsible for proxying requests from ReportService to SSRS. Request processing is as follows:- the service receives a request from ReportService, checks JWT authorization;
- in accordance with the API method, the proxy goes through the SOAP protocol in SSRS for the necessary data, logging in through NTLM along the way;
- Data received from SSRS is sent back to ReportService in response to the request.
In fact, ReportProxy is an adapter between SSRS and ReportService.The controller is as follows:[BasicAuthentication]
public class ReportProxyController : ApiController
{
[HttpGet()]
public List<ReportItem> Get(string rootPath)
{
}
public HttpResponseMessage Post([FromBody]ReportRequest request)
{
}
}
BasicAuthentication :
public class BasicAuthenticationAttribute : AuthorizationFilterAttribute
{
    public override void OnAuthorization(HttpActionContext actionContext)
    {
        var authHeader = actionContext.Request.Headers.Authorization;

        if (authHeader != null)
        {
            var authenticationToken = actionContext.Request.Headers.Authorization.Parameter;
            var tokenFromBase64 = Convert.FromBase64String(authenticationToken);
            var decodedAuthenticationToken = Encoding.UTF8.GetString(tokenFromBase64);
            var usernamePasswordArray = decodedAuthenticationToken.Split(':');
            var userName = usernamePasswordArray[0];
            var password = usernamePasswordArray[1];

            var isValid = userName == BasiAuthConf.Login && password == BasiAuthConf.Password;

            if (isValid)
            {
                var principal = new GenericPrincipal(new GenericIdentity(userName), null);
                Thread.CurrentPrincipal = principal;

                return;
            }
        }

        HandleUnathorized(actionContext);
    }

    private static void HandleUnathorized(HttpActionContext actionContext)
    {
        actionContext.Response = actionContext.Request.CreateResponse(
            HttpStatusCode.Unauthorized
        );

        actionContext.Response.Headers.Add(
            "WWW-Authenticate", "Basic Scheme='Data' location = 'http://localhost:"
        );
    }
}
As a result, the process looks like this:- The front sends an http request to ReportService;
- ReportService sends an http request to ReportProxy;
- ReportProxy through the SOAP interface receives data from SSRS and sends the result to ReportService;
- ReportService brings the result in accordance with the contract and gives it to the client.
We got a working system that requests a list of available templates, goes to SSRS for reports, and gives them to the front in any supported formats. Now you need to display the generated reports on the front in accordance with the specified parameters, give the opportunity to upload them to XLS, PDF, DOCX files and print. Let's start with the display.Working with SSRS Reports in the Portal
At first glance, it’s an everyday matter - the report comes in HTML-format, so we can do whatever we want with it! We’ll embed it in the page, tint it with design styles, and the thing is in the hat. In fact, it turned out that there were enough pitfalls.According to the design concept, the section of reports on the portal should consist of two pages:1) a list of templates where we can:- View statistics on activities for the entire portal;
- see all the templates available to us;
- click on the desired template and go to the corresponding report generator.
 2) a report generator that allows us to:
- set template parameters and create a report on them;
- view what happened as a result;
- select the output file format, download it;
- print the report in a convenient and visual form.
 There were no special problems with the first page, so we will not consider it further. And the report generator forced us to turn on the engineer, so that it would be convenient for real people to use all the functions on TK.
Problem number 1. Giant tables
According to the design concept, this page should have a viewing area so that the user can see his report before exporting. If the report does not fit into the window, you can scroll horizontally and vertically. At the same time, a typical report can reach sizes of several screens, which means we need sticking blocks with the names of rows and columns. Without this, users will have to constantly return to the top of the table to remember what a particular cell means. Or in general it will be easier to print a report and constantly keep the necessary leaves in front of your eyes, but then the table on the screen simply loses its meaning.In general, sticking blocks cannot be avoided. And SSRS 2014 does not know how to fix rows and columns in an MHTML document - only in its own web interface.Here we recall that modern browsers support the CSS sticky property , which just provides the function we need. We put position: sticky on the marked block, specify the indent on the left or on the top (left, top properties), and the block will remain in place during horizontal and vertical scrolling.You need to find a parameter that CSS can catch on to. Native cell values that allow SSRS 2014 to capture them in the web interface are lost when exporting to HTML. OK, we will mark them ourselves - we would only understand how.After several hours of reading documentation and discussions with colleagues, it seemed that there were no options. And here, by all laws of the plot, the ToolTip field turned up for us, which allows us to specify tooltips for cells. It turned out that it is thrown into the exported HTML code in the tooltip attribute - exactly on the tag that belongs to the custom cell in SQL Server Data Tools. There was no choice - we did not find another way to mark cells for fixation.So, you need to build marking rules and forward markers in HTML via ToolTip. Then, using JS, we change the tooltip attribute to the CSS class at the specified marker.There are only two ways to fix cells: vertically (fixed-column) and horizontally (fixed-row). It makes sense to put another marker on the corner cells, which remain in place when scrolling in both directions - fixed-both.The next step is to do the UI. When you receive an HTML document, you need to find all the HTML elements with markers in it, recognize the values, set the appropriate CSS class and remove the tooltip attribute so that it does not come out when you hover over it. It should be noted that the resulting markup consists of nested tables (table tags).View codetype FixationType = 'row' | 'column' | 'both';
init(reportHTML: HTMLElement) {
const rowsFixed: NodeList = reportHTML.querySelectorAll('[title^="RowFixed"]');
const columnFixed: NodeList = reportHTML.querySelectorAll('[title^="ColumnFixed"]');
const bothFixed: NodeList = reportHTML.querySelectorAll('[title^="BothFixed"]');
this.prepare(rowsFixed, 'row');
this.prepare(columnFixed, 'column');
this.prepare(bothFixed, 'both');
}
prepare(nodeList: NodeList, fixingType: FixationType) {
for (let i = 0; i < nodeList.length; i++) {
const element: HTMLElement = nodeList[i];
element.classList.add(fixingType + '-fixed');
element.removeAttribute('title');
element.removeAttribute('alt');
element.parentElement.classList.add(fixingType + '-fixed-parent');
element.style.width = element.getBoundingClientRect().width + 'px';
element.style.height = element.getBoundingClientRect().height + 'px';
this.calculateCellCascadeParams(element, fixingType);
}
}
And here is a new problem: with cascading behavior, when several blocks moving in one direction are fixed at once in the table, the cells going one after another will be layered. At the same time, it is not clear how much each next block should retreat - the indents will have to be calculated via JavaScript based on the height of the block in front of it. All this applies to both vertical and horizontal anchors.The correction script solved the problem.
calculateCellCascadeParams(cell: HTMLElement, fixationType: FixationType) {
const currentTD: HTMLTableCellElement = cell.parentElement;
const currentCellIndex = currentTD.cellIndex;
currentTD.style.left = '';
currentTD.style.top = '';
const currentTDStyles = getComputedStyle(currentTD);
if (fixationType === 'row' || fixationType === 'both') {
const parentRow: HTMLTableRowElement = currentTD.parentElement;
let previousRow: HTMLTableRowElement = parentRow;
let topOffset = 0;
while (previousRow = previousRow.previousElementSibling) {
let previousCellIndex = 0;
let cellIndexBulk = 0;
for (let i = 0; i < previousRow.cells.length; i++) {
if (previousRow.cells[i].colSpan > 1) {
cellIndexBulk += previousRow.cells[i].colSpan;
} else {
cellIndexBulk += 1;
}
if ((cellIndexBulk - 1) >= currentCellIndex) {
previousCellIndex = i;
break;
}
}
const previousCell = previousRow.cells[previousCellIndex];
if (previousCell.classList.contains(fixationType + '_fixed_parent')) {
topOffset += previousCell.getBoundingClientRect().height;
}
}
if (topOffset > 0) {
if (currentTDStyles.top) {
topOffset += <any>currentTDStyles.top.replace('px', '') - 0;
}
currentTD.style.top = topOffset + 'px';
}
}
//
if (fixationType === 'column' || fixationType === 'both') {
//
// .
// , .
let previousCell: HTMLTableCellElement = currentTD;
let leftOffset = 0;
while (previousCell = previousCell.previousElementSibling) {
if (previousCell.classList.contains(fixationType + '_fixed_parent')) {
leftOffset += previousCell.getBoundingClientRect().width;
}
}
if (leftOffset > 0) {
if (currentTDStyles.left) {
leftOffset += <any>currentTDStyles.left.replace('px', '') - 0;
}
currentTD.style.left = leftOffset + 'px';
}
}
}
The code checks the tags of marked elements and adds the parameters of the fixed cells to the indent value. In the case of adherent rows, their height is added up, for columns, their width. An example of a report with a sticky top line.As a result, the process looks like this:
- We get the markup from SSRS and paste it in the right place in the DOM;
- Recognize markers;
- Adjust the parameters for cascading behavior.
Since the sticking behavior is fully implemented through CSS, and JS is involved only in the preparation of the incoming document, the solution works quickly enough and without lags.Unfortunately, for IE, sticking blocks had to be disabled because it does not support the position: sticky property. The rest - Safari, Mozilla Firefox and Chrome - do an excellent job.Move on.Problem number 2. Report Export
To pull a report out of the system, you must (1) access the SSRS via ReportService for a Blob object, (2) get a link to the object via the interface using the window.URL.createObjectURL method, (3) put the link in the tag and simulate a click for file upload.This works in Firefox, Safari and in all versions of Chrome except Apple. So that IE, Edge and Chrome for iOS also supported the function, I had to throw my brains back.In IE and Edge, the event simply will not trigger a browser request to download the file. These browsers have such a feature that in order to simulate a click, confirmation of the user to download is required, as well as a clear indication of further actions. The solution was found in the window.navigator.msSaveOrOpenBlob () method, which is available in both IE and Edge. He just knows how to ask the user's permission for the operation and clarify what to do next. So, we determine whether the window.navigator.msSaveOrOpenBlob method exists, and act on the situation.Chrome on iOS didn’t have such a hack, and instead of a report, we got just a blank page. Wandering around the Web, we found a similar story, judging by which in iOS 13 this bug should have been fixed. Unfortunately, we wrote the application back in the days of iOS 12, so in the end we decided not to waste any more time and simply turned off the button in Chrome for iOS.Now about what the final export process to UI looks like. There is a button in the Angular report component that launches a chain of steps:- through the event parameters, the handler receives the identifier of the export format (for example, “PDF”);
- Sends a request to ReportService to receive a Blob-object for the specified format;
- checks if the browser is IE or Edge;
- when the answer comes from ReportService:
- if it is IE or Edge, it calls window.navigator.msSaveOrOpenBlob (fileStream, fileName);
- otherwise, it calls the this.exportDownload (fileStream, fileName) method, where fileStream is the Blob obtained from the request to ReportService, and fileName is the name of the file to save. The method creates a hidden tag with a link to window.URL.createObjectURL (fileStream), simulates a click and removes the tag.
With this sorted out, the last adventure remained.Problem number 3. Printout
Now we can see the report on the portal and export it to XLS, PDF, DOCX formats. It remains to implement the printing of the document in order to get an accurate multi-page report. If the table turned out to be divided into pages, each of them should contain headings - the same sticky blocks that we talked about in the section before last.The easiest option is to take the current page with the displayed report, hide everything superfluous using CSS and send it to print using the window.print () method. This method does not work immediately for several reasons:- Non-standard viewing area - the report itself is contained in a separately scrollable area so that the page does not stretch to incredible horizontal dimensions. Using window.print () trims content that does not fit the screen;
- , ;
- , .
All this can be fixed using JS and CSS, but we decided to save developers time and look for an alternative to window.print ().SSRS can immediately give us a ready-made PDF with a presentable pagination. This saves us from all the difficulties of the previous version, the only question is, can we print the PDF through a browser?Because PDF is a third-party standard, browsers support it through various viewer plugins. No plug-in - no cartoons, so again we need an alternative option.And if you put the PDF on the page as an image, and send this page to print? There are already libraries and components for Angular that provide such rendering. Searched, experimented, implemented.In order not to deal with the data that we do not want to print, it was decided to transfer the rendered content to a new page, and there already execute window.print (). As a result, the whole process is as follows:- Request ReportService to export the report in PDF format;
- We get the Blob-object, convert it to a URL (URL.createObjectURL (fileStream)), give the URL to the PDF viewer for rendering;
- We take images from the PDF viewer;
- Open a new page and add a little markup there (title, a little indentation);
- Add the image from the PDF viewer to the markup, call window.print ().
After several checks, a JS code also appeared on the page, which, before printing, checks that all images have loaded.Thus, the entire appearance of the document is determined by the parameters of the SSRS template, and the UI does not interfere with this process. This reduces the number of possible bugs. Since images are being transferred for printing, we are insured against any damage or deformation of the layout.There are also disadvantages:- a large report will weigh a lot, which will adversely affect mobile platforms;
- the design does not update automatically - colors, fonts and other design elements need to be installed at the template level.
In our case, the frequent addition of new templates was not expected, so the solution was acceptable. Mobile performance has been taken for granted.The last word
This is how a regular project once again makes us look for simple solutions for non-trivial tasks. The final product fully meets the design requirements and looks beautiful. And most importantly, although we did not have to look for the most obvious implementation methods, the task was completed faster than if we took on the original report module with all the consequences. And in the end, we were able to focus on the business goals of the project.