Radioactive products. Gamma spectrometer. Part 2
In the previous part, we learned how to assemble a gamma spectrometer. We learned how to choose the right crystal of sodium iodide and many other subtleties in this spectrometric craft.The first part Next we need to build a lead house. Its task is to isolate the spectrometer from the external natural background.We will need:
- 120 .
- 76- . 1941. , 60 , .
- . .
 The lead himself was thrown to us by a good friend, such small weights are used to balance the wheels on a tire fitting. The only negative of such a product is sticky stickers on one side. Therefore, we put on our pants and get out into the nature, you need to burn out all that is unnecessary and melt the noble metal. What good are these sorties to nature, here you can have a good thump, in fact what we did during the whole process.
 At this time, we are preparing a soup of lead. Here you need to remove foam and other slag, which is on top. The cleaner the original ingots, the less trash you have to catch. We heat the metal with a small margin, and begin its gradual pouring into the ventilation pipe. The bottom layer should be about 3 centimeters high.It is important to do such things in dry sunny weather, hints of rain are unacceptable, otherwise lead can easily spit in your face. Learned!Now it is necessary to install and center with a screw, a 76 mm tank sleeve, and continue pouring the product walls with hot lead. After several rather boring and repetitive procedures, our lead is over. The total weight of the product is 23 kilograms. Leaving everyone’s favorite picnics, do not forget the letter-letter to the bonfire. Having transported the blank home, with the help of a hacksaw for metal, we cut off all unnecessary.
 So, let's recall the picture of background pulses that we saw during the operation of the gamma spectrometer. Now let's see what changes.From practice.A layer of homogeneous lead with a thickness of 2 centimeters reduces the gamma background by exactly 10 times, and this is clearly visible in the Becquerel Monitor program. For a sodium iodide crystal measuring 30 * 40 mm, the number of pulses outside the house will be 60, and in the house only 6.
 Surely many will wonder why so much trouble with lead !?This is an example of a normal background shot with and without protection. On the spectrum it seems that there are not a dozen pulses here, but a hundred times more. With regard to household dosimeters. Radio scan 701 shows a background value of 11 micro-roentgen, 2 centimeters of lead lowers this value to 7.This is the norm, in the production of these Radioskans they showed a whole bunker made of lead bricks, I would like that ... The
 gamma spectrometer is assembled and tuned.The photomultiplier is powered by a high voltage, and we see pulses at the output of the operational amplifier. Approximately 99 percent of them should fit in an amplitude of one volt. Occasionally, pulses of large amplitude will slip through, these are high-energy cosmic particles that reach our detector. All the oscillograms that we observed in the detection unit are shown in this diagram. Here is the pinout of the PMT of the 85th, and the unicorn, in general, everything as you like.
 The product of all previous work is a signal that must be processed on a computer. Using a special program, decompose it into the amplitude spectrum, by which it is possible to judge a particular radioactive isotope in the test sample.It's time to connect the gamma spectrometer to your computer. Insert the connector into the microphone input. Some for these purposes use external sound cards such as Orico, but you need to consider that it has a different connector wiring.The software part. In the beginning, we need to go to the sound menu. In the microphone settings we find the improvement section. In it, you need to turn off all sound effects that may interfere with further work. Also here you can listen to the sound that comes to the microphone input. Make sure that everything works.
 Now we need a lead house. For reliability, we will place a copper plate at the bottom of the sleeve. For what it is necessary, and how the X-ray fluorescence of lead appears on the spectrum, we will consider a little later. Now we need to get a radioactive source.The simplest thing that can be used is old switches or a clock with a constant-current light mass based on radium-226. Keeping such shit at home is not entirely legal, because this instance will be purely demonstrative in nature, after which I will eat it. Joke. We put this infernal sample of fragile minds of that time to the bottom of our house, and lower the gamma spectrometer there.
 Now our task is to properly configure the program in which we will deal with the processing of spectra. It is called Becquerel Monitor.At this point, I want to express special thanks to Evgeny Soloviev , who helped in setting up the software and explained in simple language many of the processes taking place in this difficult craft.He’s a master of iodine damn it! Many fragments of this issue were drawn from his rich experience, and were transferred to me, the young Padawan. Now he is me, I am you, and you are he!So, for starters, click on the start button in the program and start collecting the spectrum. There will be quite a lot of pulses from the radium clock at the input of the sound card, which means the hardware is working. It is pointless to collect the spectrum now, since nothing is set up. Stop the process with the stop button.In the tool menu section, we need to go to the "change device configuration" section. Here we create a name for our gamma spectrometer “FEU-85A, sodium iodine 30 to 40”. On the right we see the section "basic". Here we are interested in two parameters. The first is the measurement time, by default it costs 3600 seconds, that is, one hour, add zero and increase the time to 10 hours. The number of channels instead of three thousand is set to 4-re. We don’t touch the channel step and leave it as it is. In the “basic” section, that’s all, we save the set parameters.
 Go to the "device settings", this section can be considered the main one.The audio device I have is Realtek High Definition, it is built into the motherboard. Sampling rate, the more the better. We put 192 thousand hertz. Bit depth select 24 bits. Signal level - put a tick “Auto tuning”, and use the slider on the left to lower the signal level to about 13 percent, your value may be different. Do not touch the polarity of the device. The lower limit threshold is selected individually, I get this value 0.7, the upper limit threshold is left as it is, 100. The threshold is in the shape of the pulse, the optimal value is 60 percent.Now, at the bottom we see a separate window "setting the exemplary pulse shape." In the beginning, we set the NRP value, it must be higher than the noise level, it is selected individually, I have it 1. We leave the runway as it is, 100. Press the start button, and the program will start recording model pulses.Pay attention to their shape, they are quite narrow and sharp. Let's try to stretch the momentum to the width of the window. To do this, we need to change the sample width parameter, set the value to 32, and the peak position, set 16. Pressing the record button, you can notice how the picture has changed, the impulse has been extended to the entire window.Now, what happens if the NRP parameter is below the noise level?In principle, nothing good, the signal will look like some kind of crooked hair. We increase the parameter of the NPP to 0.5 and see what changes. The shape of the impulse has become more beautiful, but still we see some distortion at the top. Not good. An acceptable result was a value of one. We collect about 2 thousand model pulses and save them to the program. Fine. Update the device configuration.
 The old canvas is not suitable for sketching another masterpiece, it should be cleaned. Let's start collecting a new spectrum, and see what is visible here.Continuous light in hours is quite active, it gives above two hundred pulses per second. After about 2 minutes, individual energy peaks can be observed on the spectrum that correspond to the SPD of radium, but the energies on the scale are not distributed correctly, let's see what value the last peak will show us. Yeah, 780 keV, that's a lot. This hill should correspond exclusively to 609 keV energy. That's bad luck ...
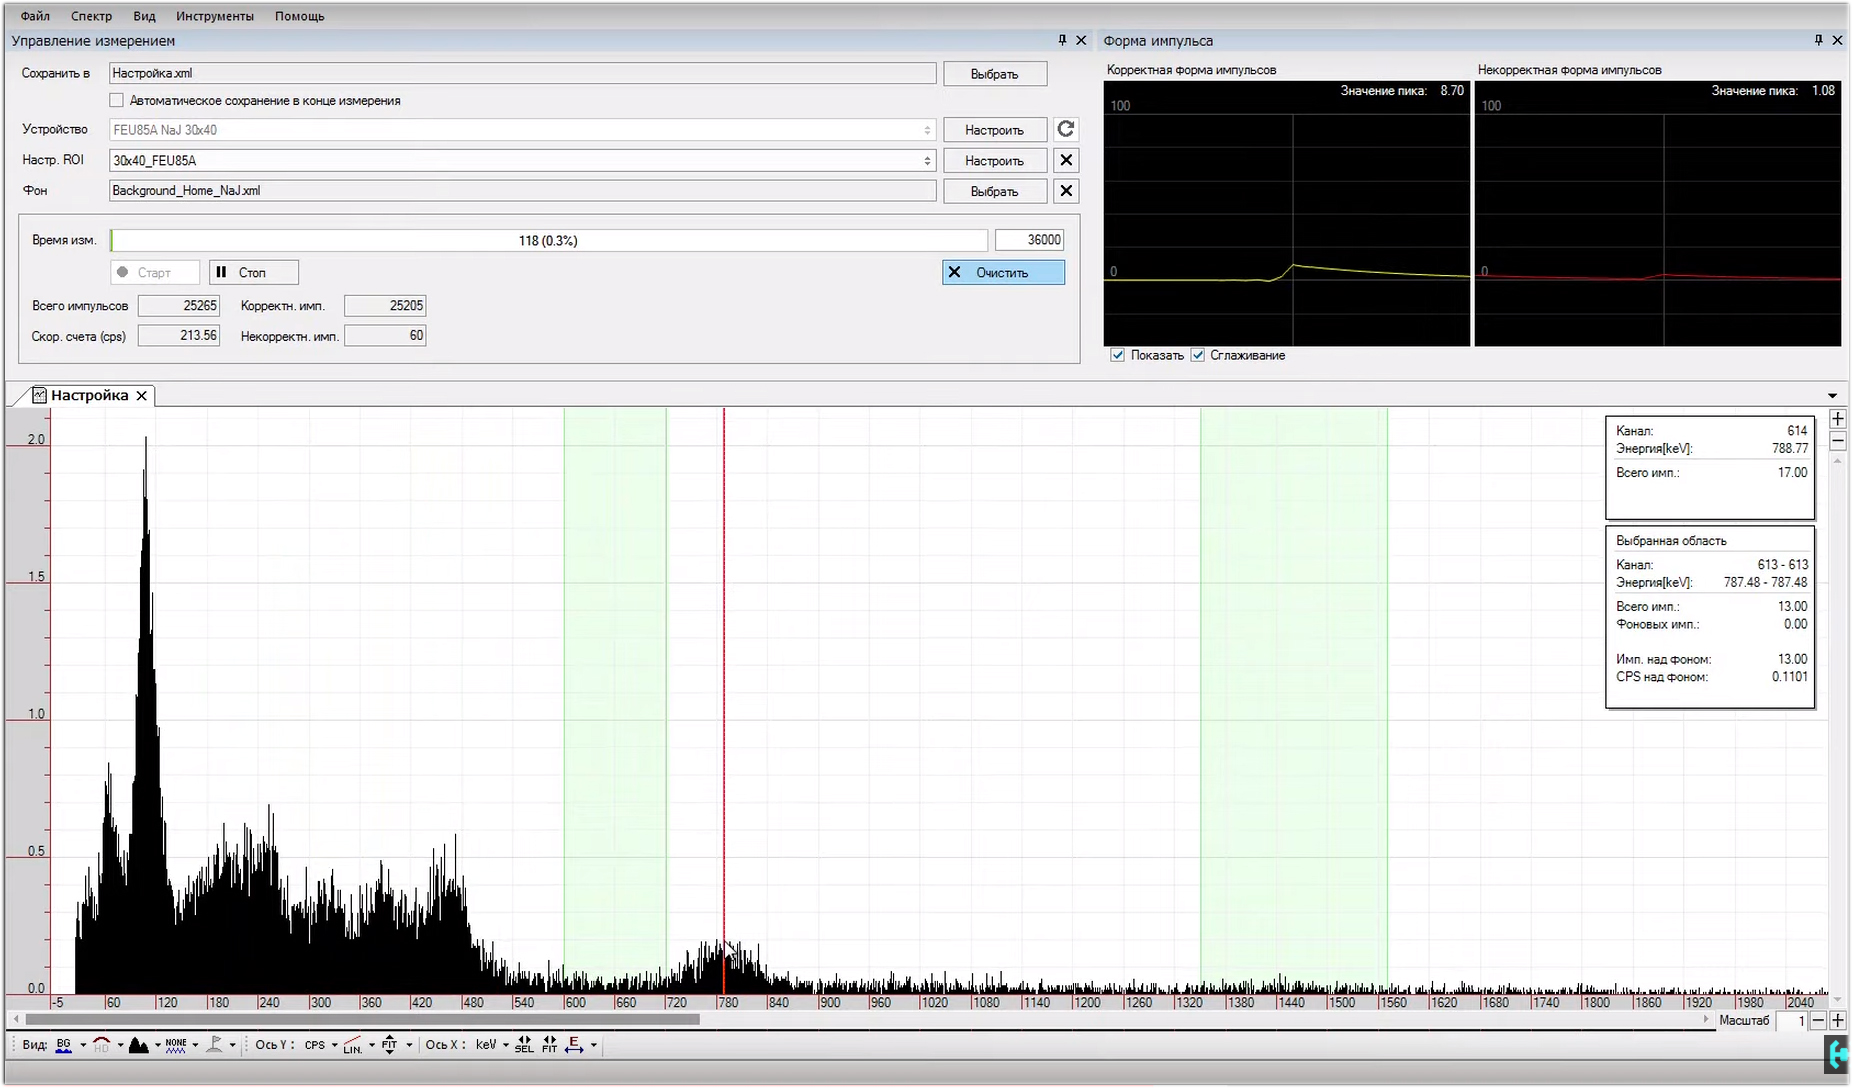 In order to fix this situation, we need to open the “energy calibration” window. We see three coefficients in it, A, B and C. Reduce the value of coefficient B to such an extent that a peak with an energy of 609 keV does not correspond to the same energy in the program. We’ll expand the spectrum to examine in more detail what and where we are shifting.Now this is a rough setting, it is necessary in order to roughly understand how much the value of two important parameters differs. With good tuning, the channel in the figure should approximately correspond to the energy. If it is larger, the spectrum will be collected longer, if less, the energy peaks will not be as detailed. In general, playing with the level of the input signal, you can move the spectrum up or down with respect to the channel. All this is adjusted individually for each gamma spectrometer. This setup took me about half an hour.Turn on the logarithmic scale and expand the picture. Here you can see the region of maximum energies that the program is capable of processing. They correspond to about 3-plus megaelectron-volts. Cosmic quanta in person!Accurate spectrum calibration.It is customary to carry out it according to sources that have single energy peaks; cesium-137 is used in the classics. But, I propose an interesting option, to use potassium-40 along with cesium. We will get a picture according to which you can quite accurately calibrate our spectrum for three peaks. How to do it? In the window under the coefficients we see the button "multi-point calibration". Now we are offered to choose a channel. Let's go from the smallest to the greatest. The first peak is the X-ray fluorescence of barium in the test sample with cesium-137, the second peak corresponds to the most radioactive isotope of cesium-137. The third hillock is potassium-40. I will tell you where to get such sources a little later. In the meantime, in the list above, you need to adjust the values with energies.For X-ray fluorescence, barium is 32 keV, for cesium 137 - 662 keV, for potassium 40 - 1461 keV. Press the button to calibrate, and the entire spectrum is automatically aligned according to the energies. Coefficients A, B and C themselves determined the necessary values for themselves. Now you need to save the settings in the device configuration. Everything, the program is configured and calibrated.
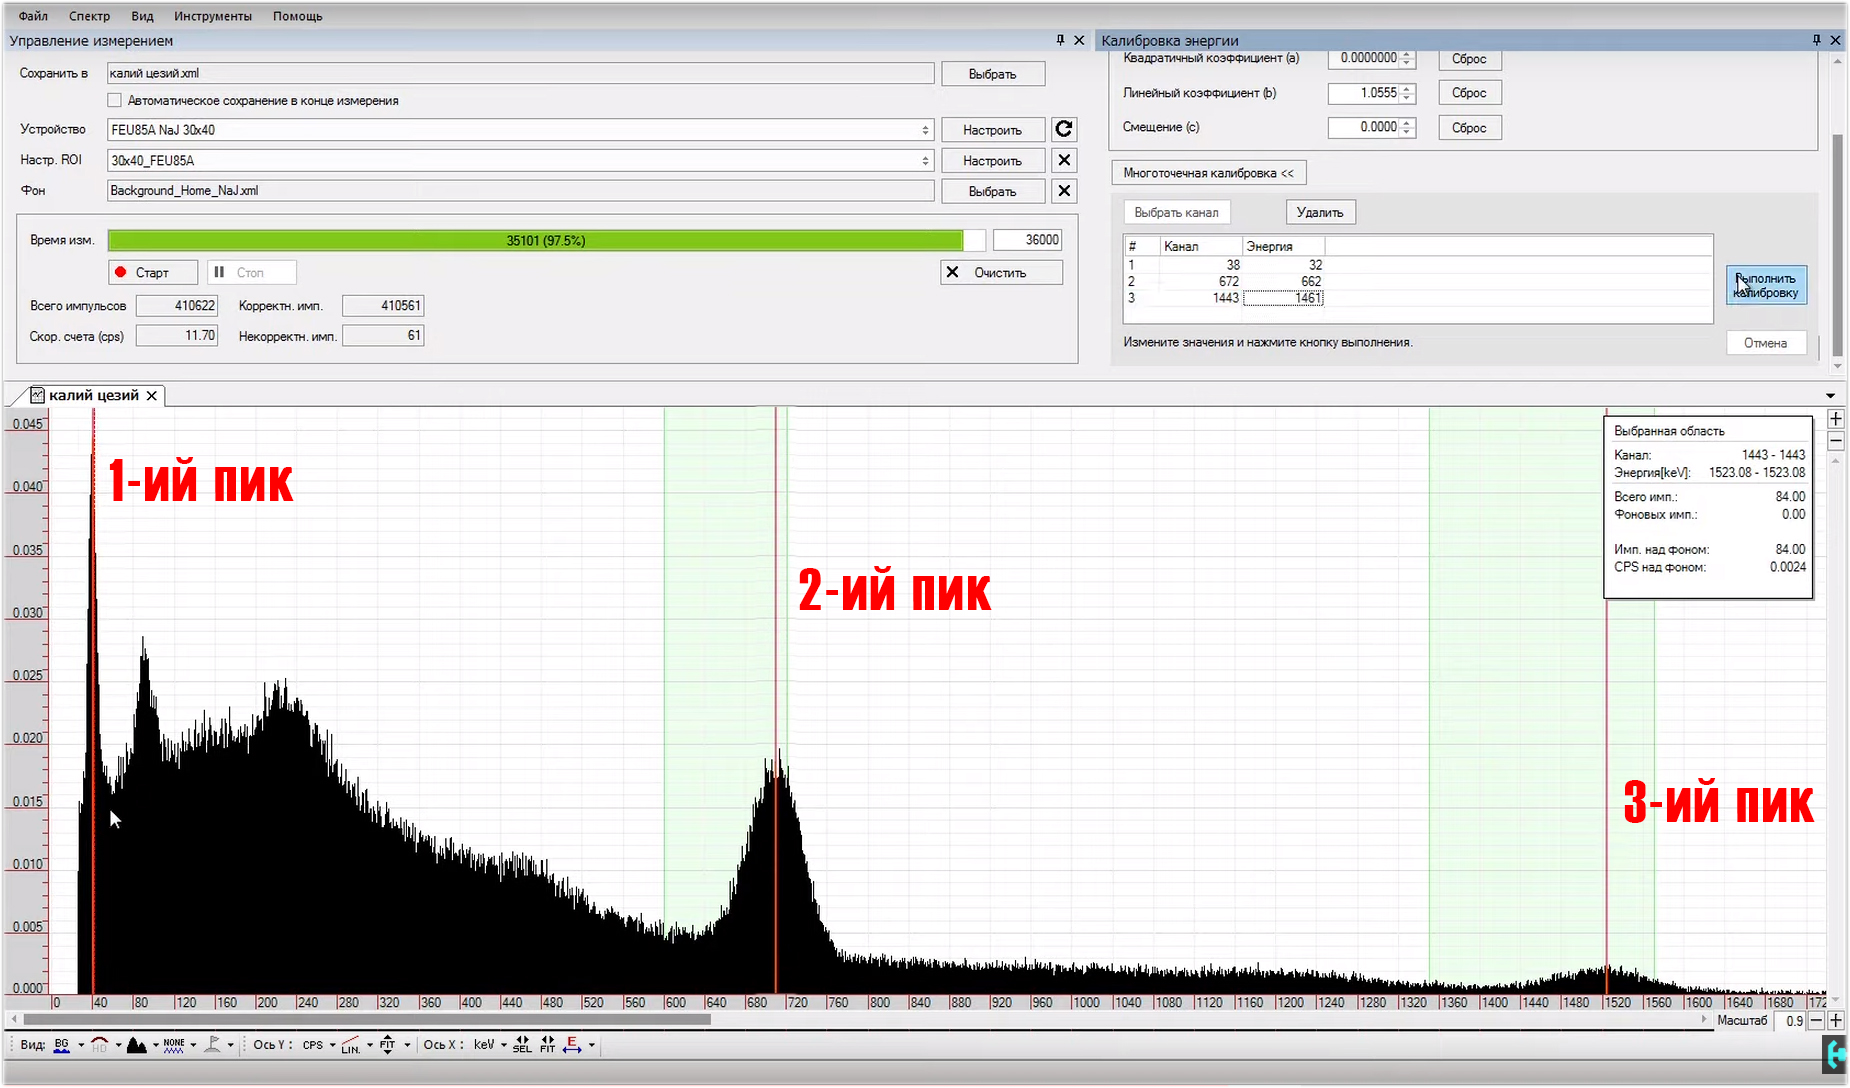 What do we have in the end !? This distribution is a spectrum of pulse amplitudes obtained in the study of monoenergetic radiation. It is from the parameters of such peaks that the radiation characteristic is restored. At the end of the amplitude spectrum of the pulses, there is a peak corresponding to the total absorption of a particle with a certain energy by the detector.Ideally, the peak of total absorption should be infinitely narrow, however, even in the case of an ideal scintillator, it will have a certain half-width associated with fluctuations in the detector.The ratio of the peak width to its amplitude is called the energy resolution of the scintillator. The smaller this value, the higher the resolution of the scintillation detector, in this case it is 8 percent. Basically, the resolution is usually measured by the peak of cesium-137, but the peak of bismuth-210 at the base of radium, which lies in the region of 609 keV, is also perfect for this.
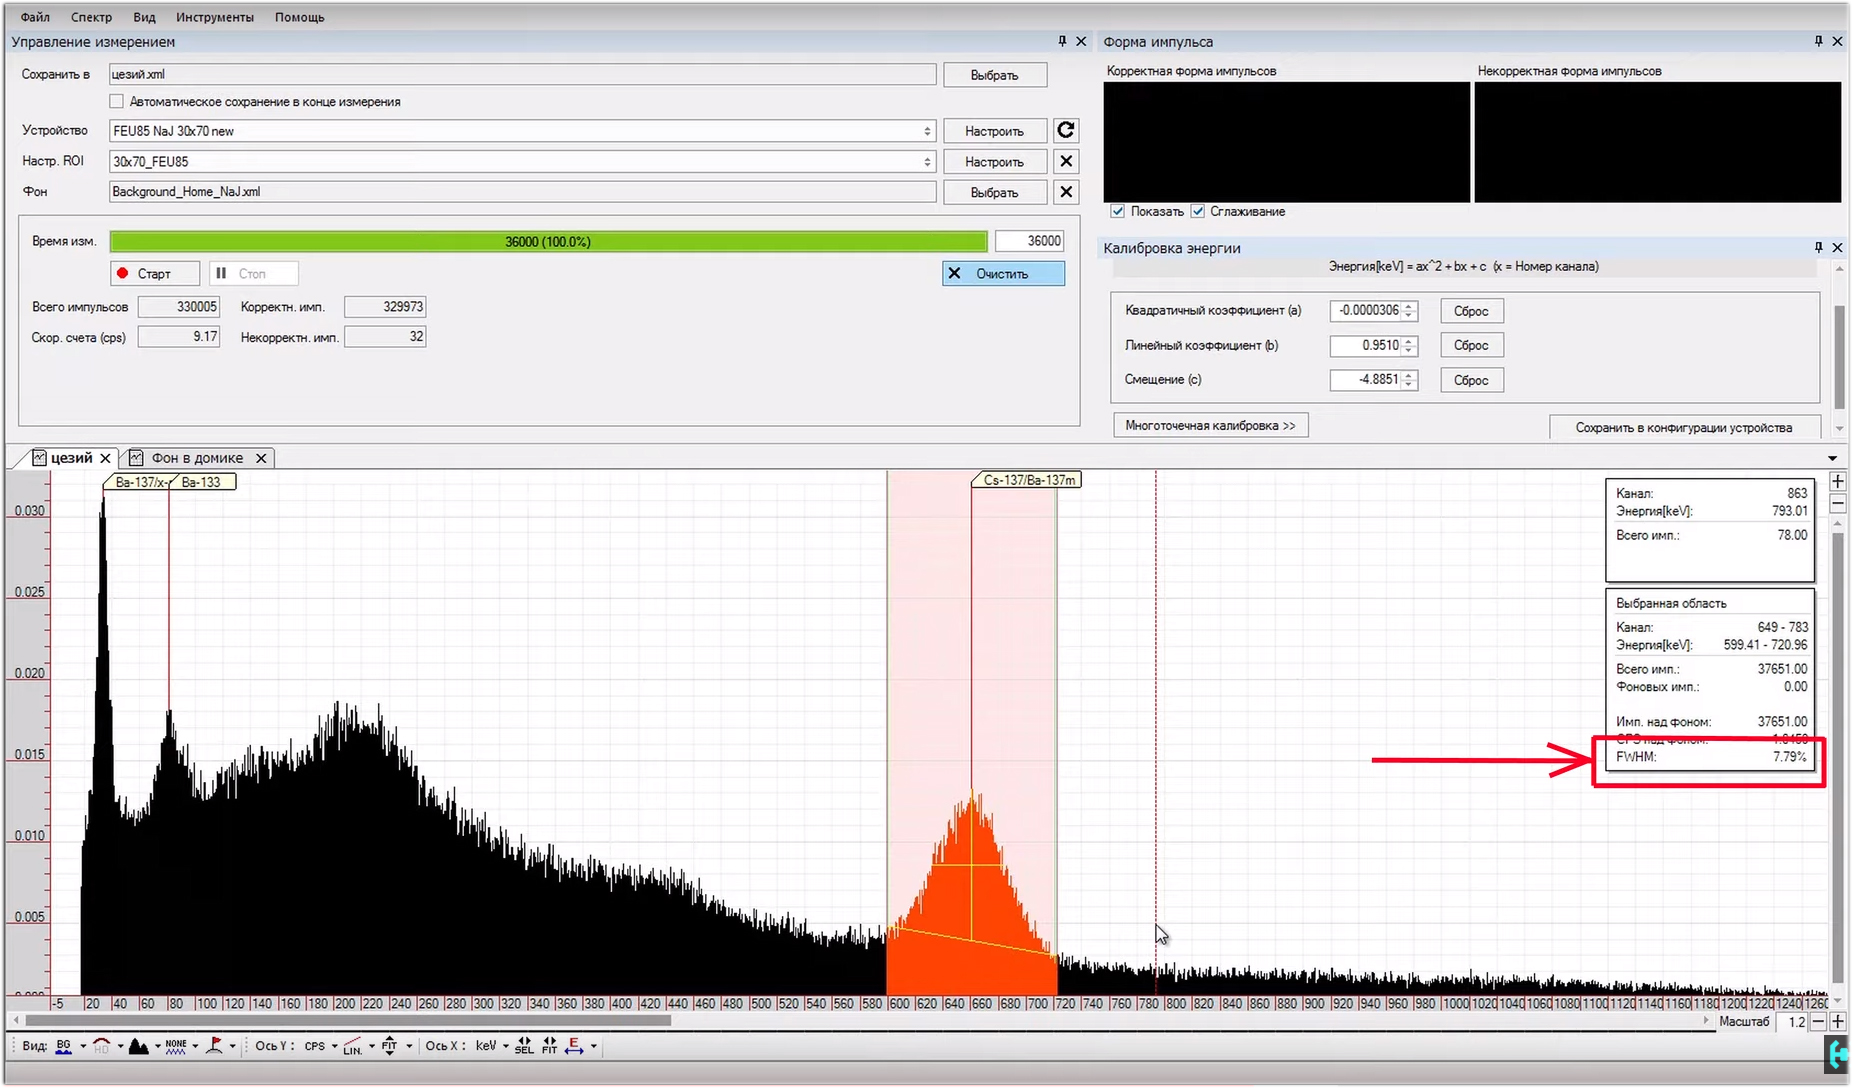 Analysis of the results. It sometimes takes a whole day to collect an acceptable spectrum of weakly active radioisotope samples. So we waited, we got an incomprehensible comb. What is it and what does it eat with?Let us examine an example based on radium-226. Each radioactive isotope in its life overcomes half-life with conversion into another chemical element with a different atomic weight. Each decay is accompanied by the release of alpha, beta or gamma particles.Here is the half-life chain of radium-226. In the process, it turns into radon, radon turns into lead-214, lead into barium, and so on until a stable element is formed in the last chain of this half-life, in this case lead-206. From this it is clear that we are dealing not only with radium-226 in hours, but with a whole bunch of radioactive isotopes, which must be considered separately.
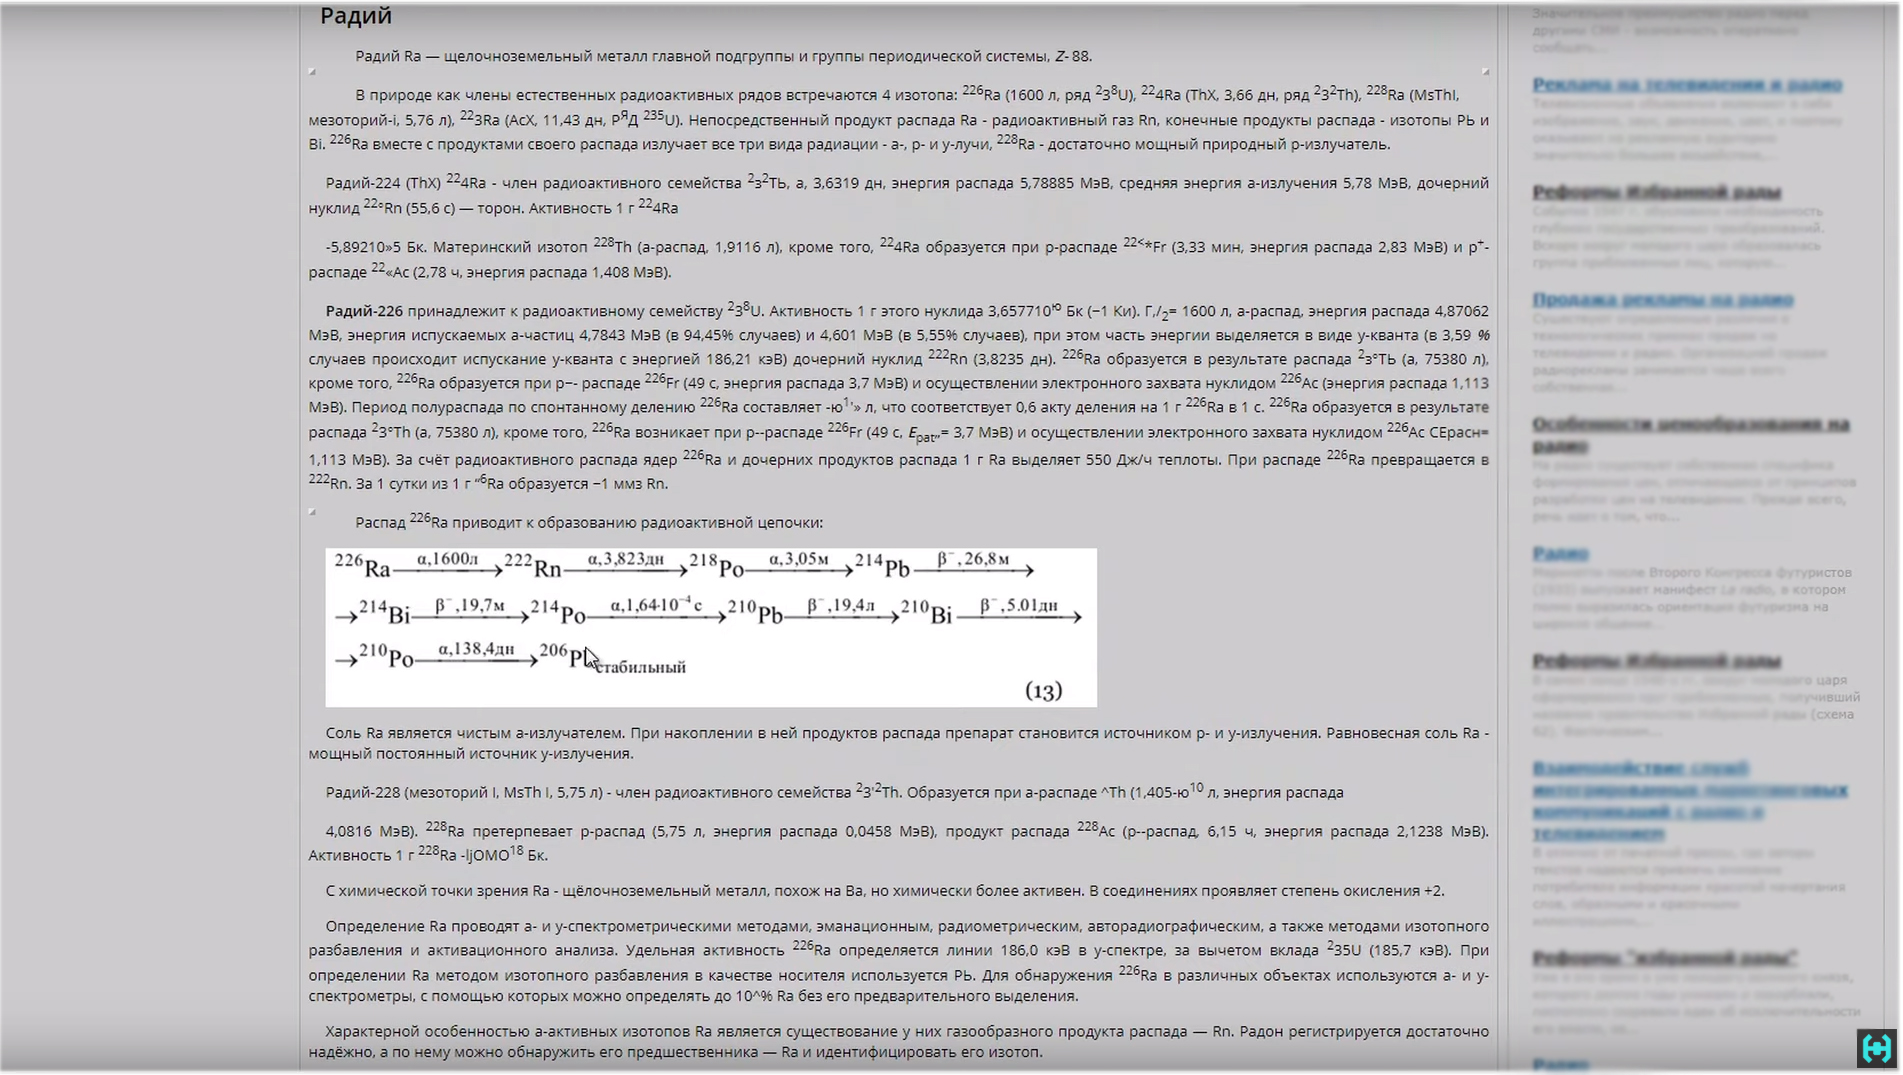 Here the NuDat resource can help us .All this daub in the picture is an advanced periodic table. Among all the possible isotopes we find radium-226. Click on it. After the program loads the necessary element, a small list will appear below, we are interested in the item “decay radiation” .
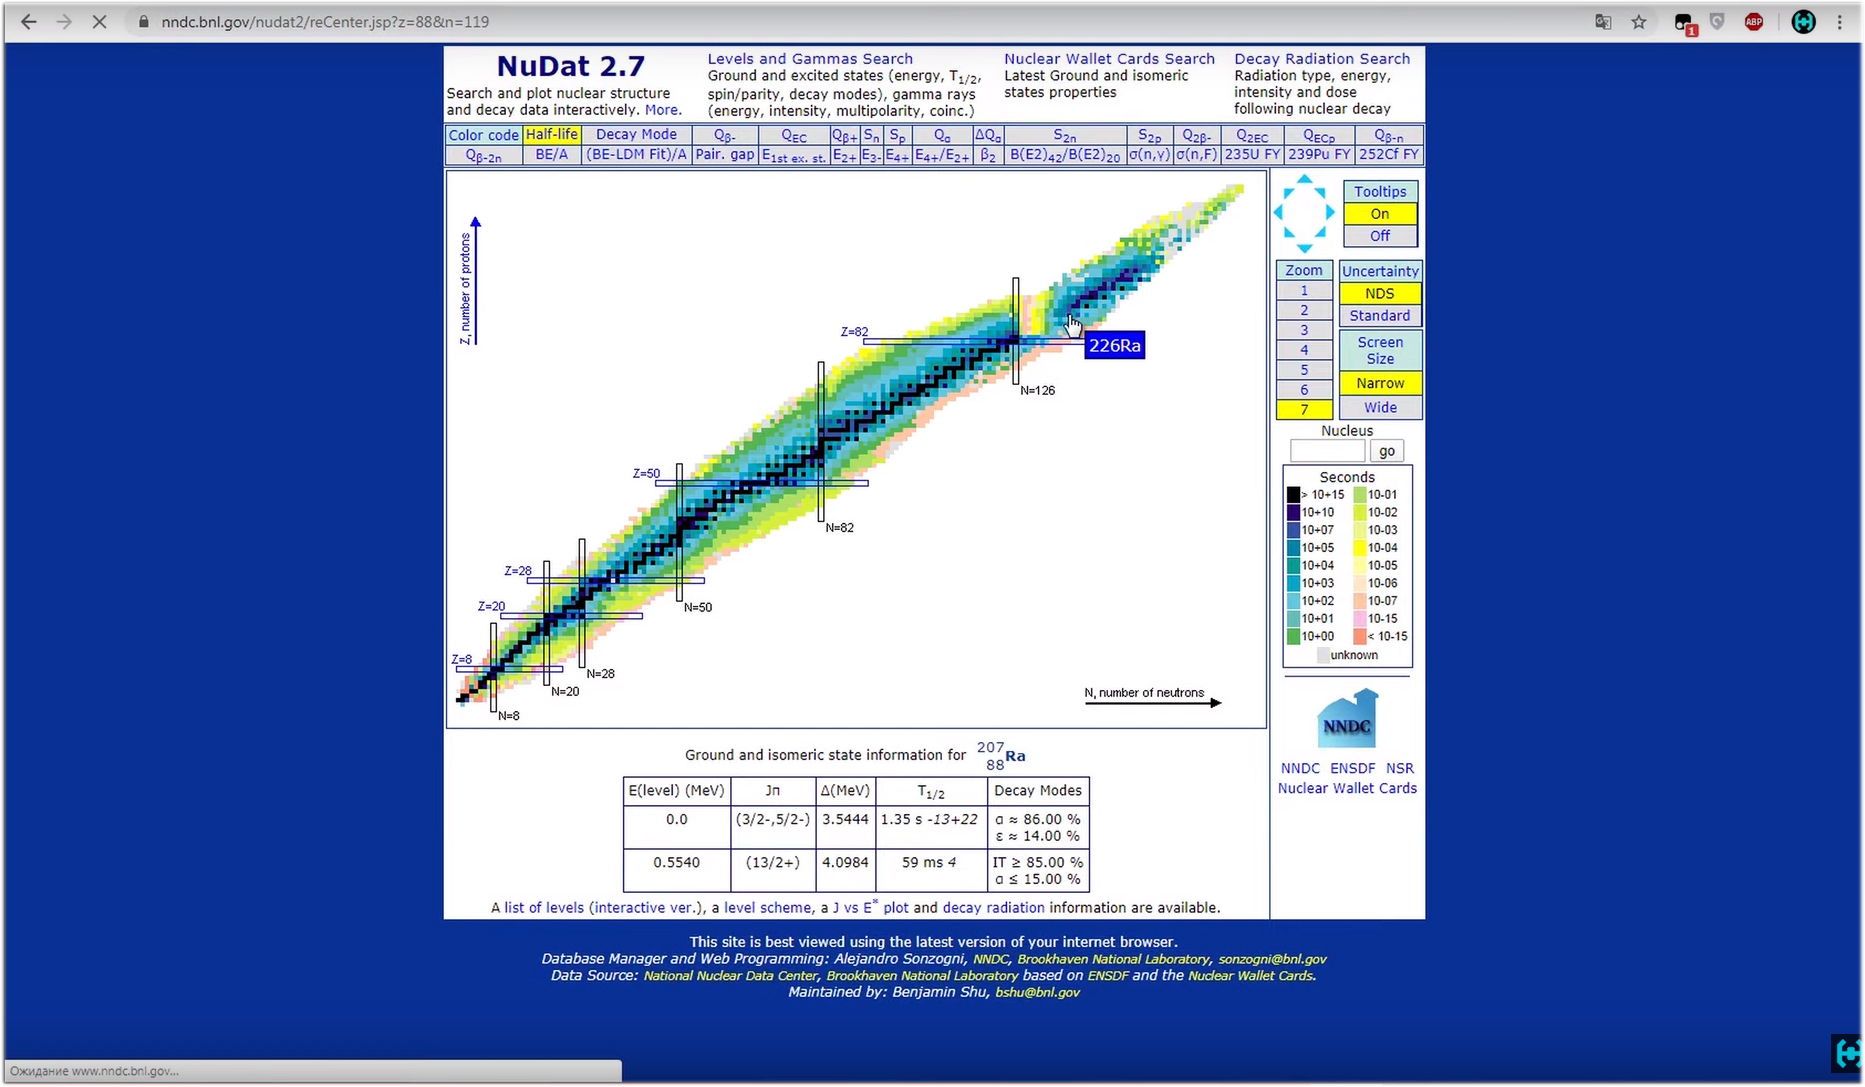 It will open a list of possible energies during decay. Below we are interested in the section with gamma and x-ray radiation. Here we see that with a greater degree of probability, 3.64 percent in our decay, energy corresponding to 186 kiloelectron-volts will be released. On the spectrum, this peak is right here, and corresponds to the very necessary energy of 186 keV. Fine.
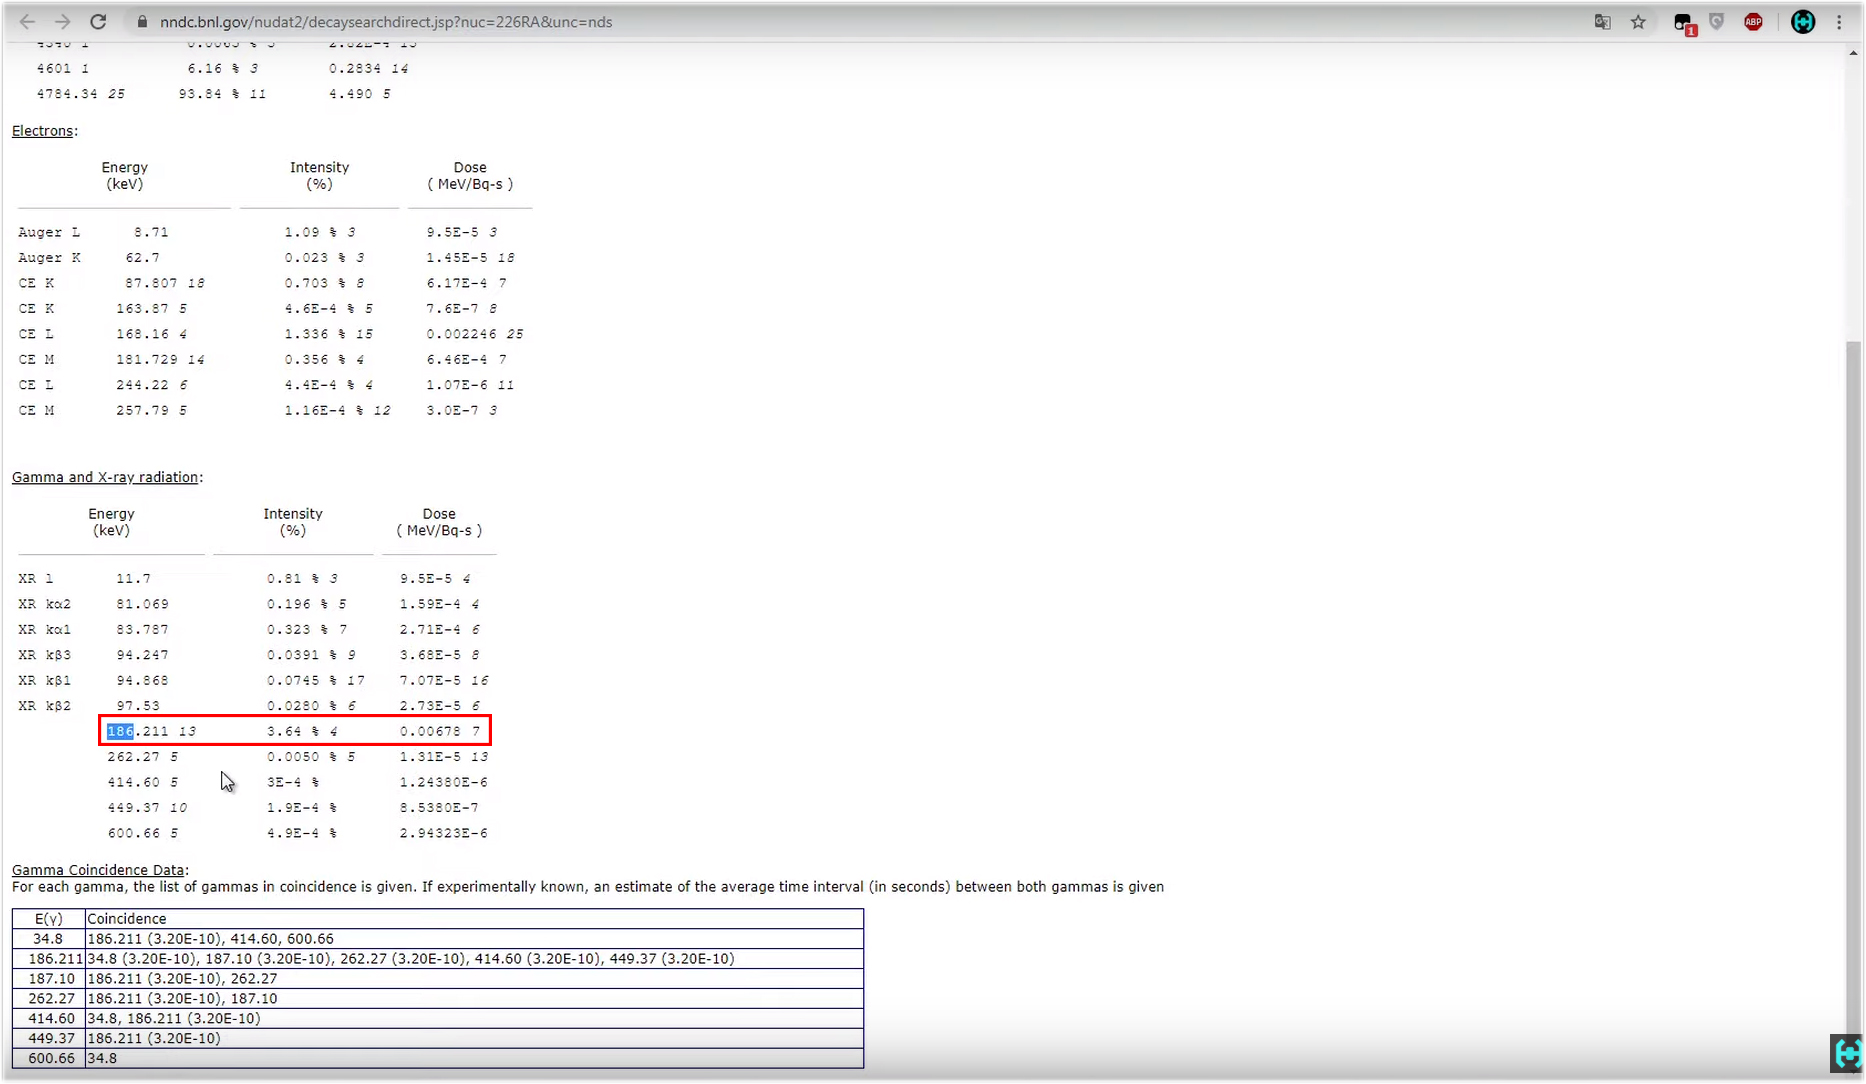 Consider the radioactive isotope cesium-137.Its half-life is 30 years. Cesium-137 itself is a beta source, undergoing beta decay, it turns into a barium-137m isomer, which lives only 2 and a half minutes and decays, spits a gamma quantum with an energy of 662 kiloelectron-volts, completing the decay chain and turning into a stable barium-137 isotope.But, on the spectrum there are still some three peaks.The first, which is 32 keV, is the X-ray fluorescence of barium, when a particle falls into barium during decay, it produces its quantum with an energy of 32 keV. The same applies to the second hillock, this is the x-ray fluorescence of lead in a lead house. Big black mound, this is the Compton effect. It occurs as a result of the fact that not all gamma quanta are completely absorbed by the scintillator. Most of them lose their energy along the way as a result of collisions with electrons of substances, and only after that are absorbed by the scintillator. In general, Compton, using cesium as an example, is our 662 keV that lost energy along the way.
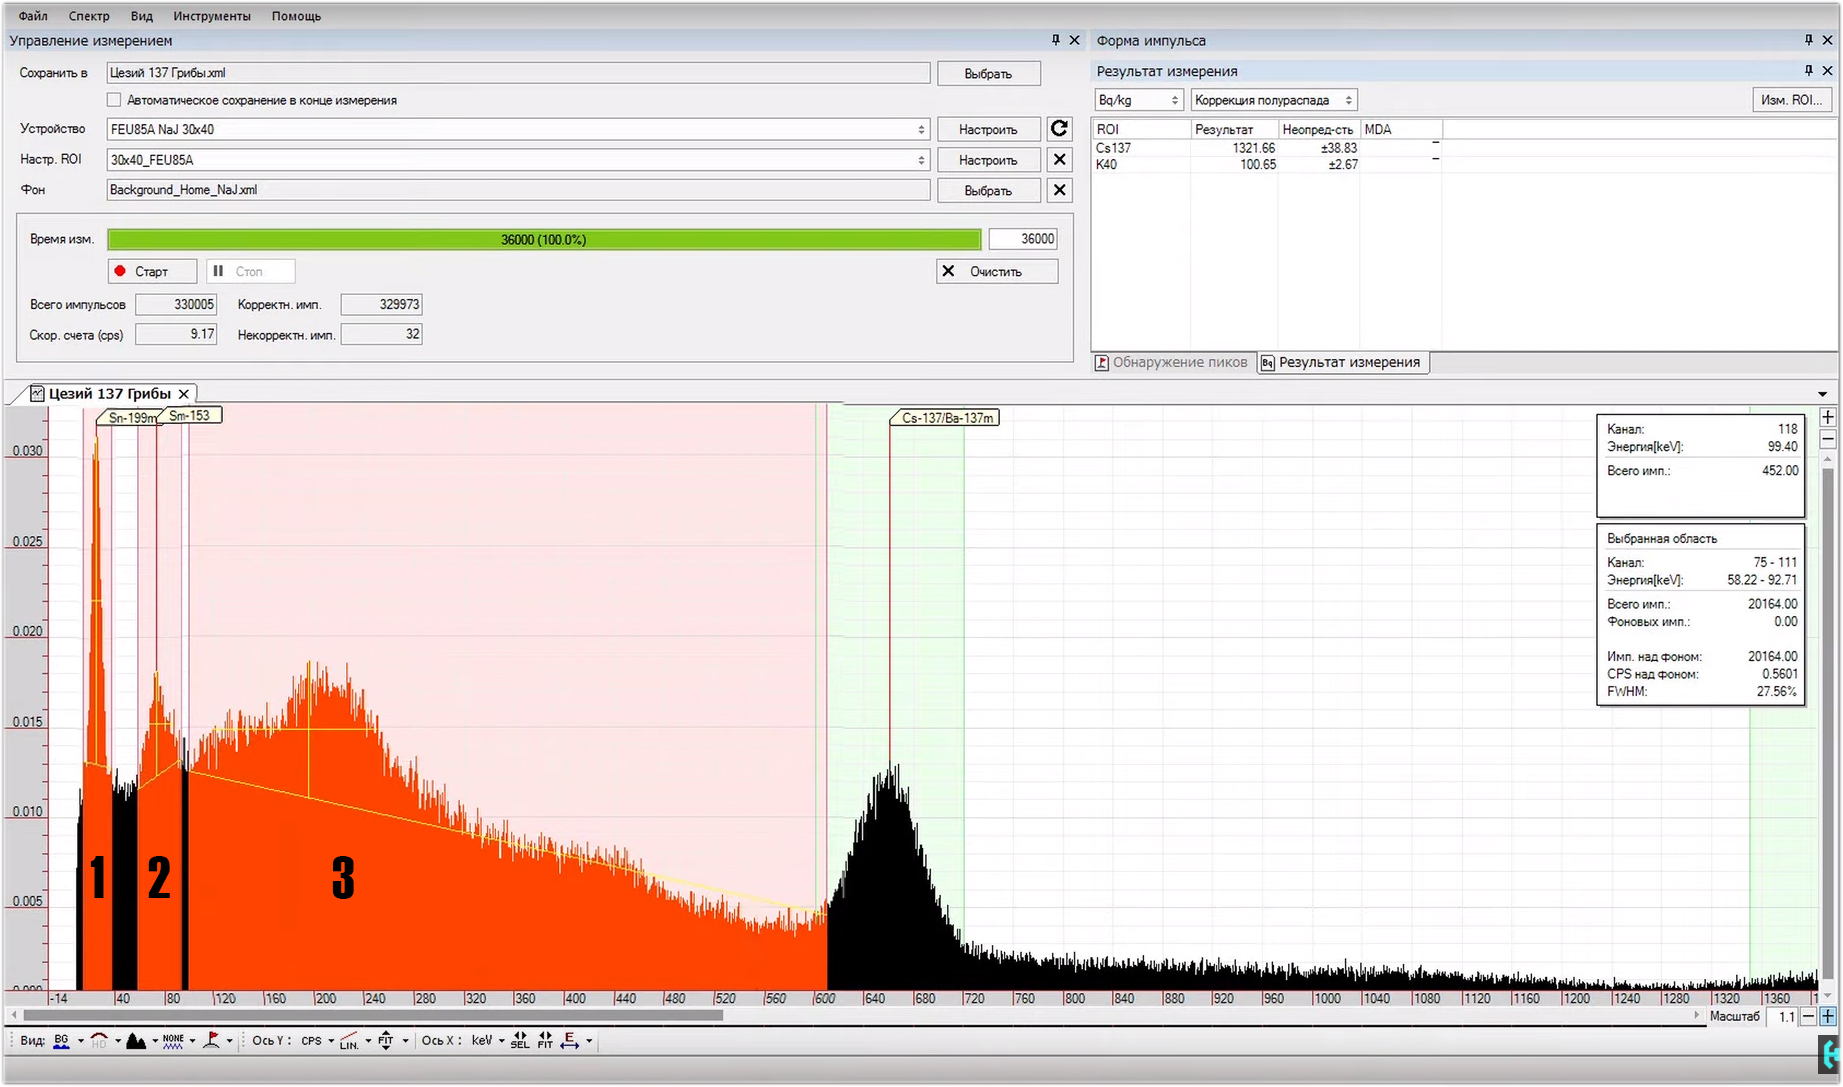 I am sure that now many of you have a question where to get legal radioactive sources for research!?.Everything is very simple. For example, cesium-137, these are ordinary porcini mushrooms that I eat. Some of them were collected in the Malinsky district, some were brought from Radynka, the village of Polessky district, which is located 30 kilometers from Chernobyl.To fix at least some excess in the background, the mushrooms must be completely dried and chopped in a coffee grinder. As a result of measuring such a bag, Radioskan 701 showed a background of 13 micro-roentgen, and the spectrum itself from it, had to be collected within 10 hours.
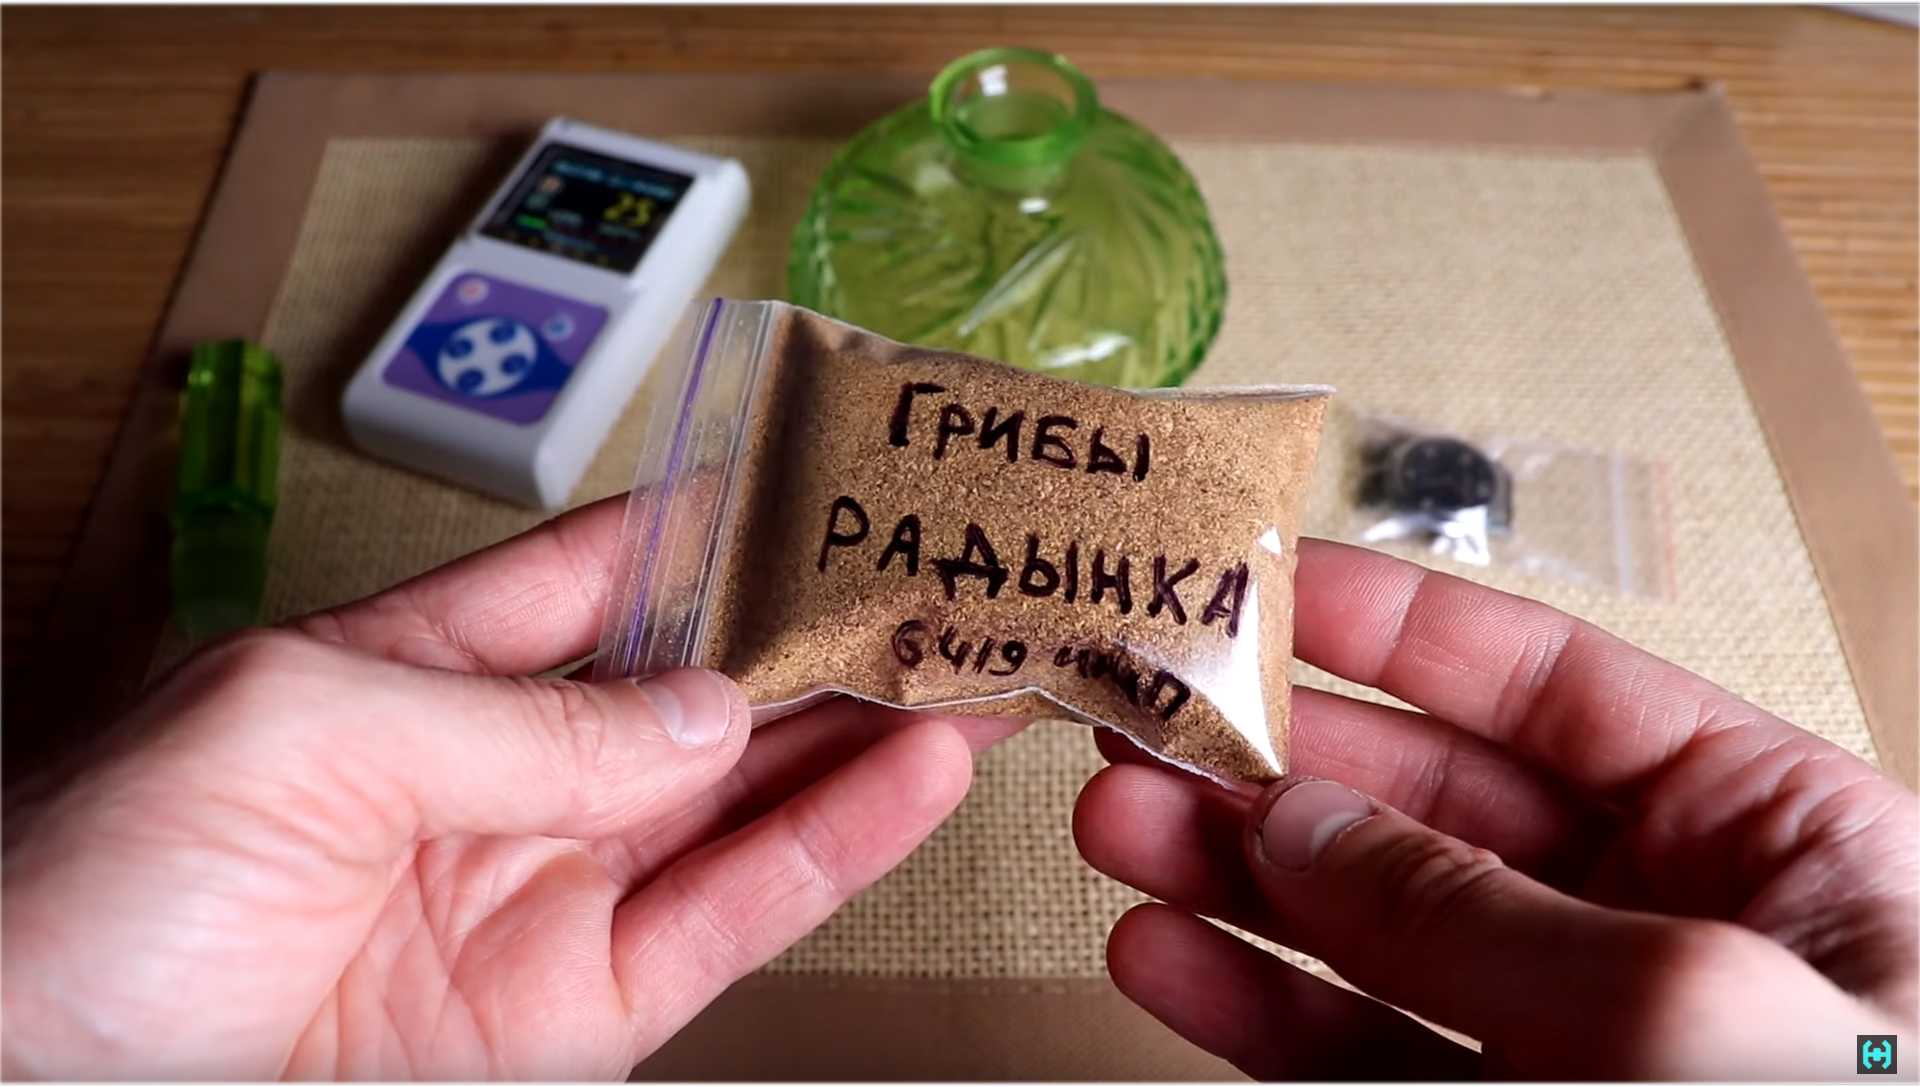 There are a lot of similar sources around us if you know what to look for.This is for example tungsten electrodes with two percent addition of thorium-232. You can buy them at any store selling welding equipment. For ease of measurement, we place the sample in a small plastic container. The radio scan with the lid of the gamma filter closed shows about 30 micro-roentgen.
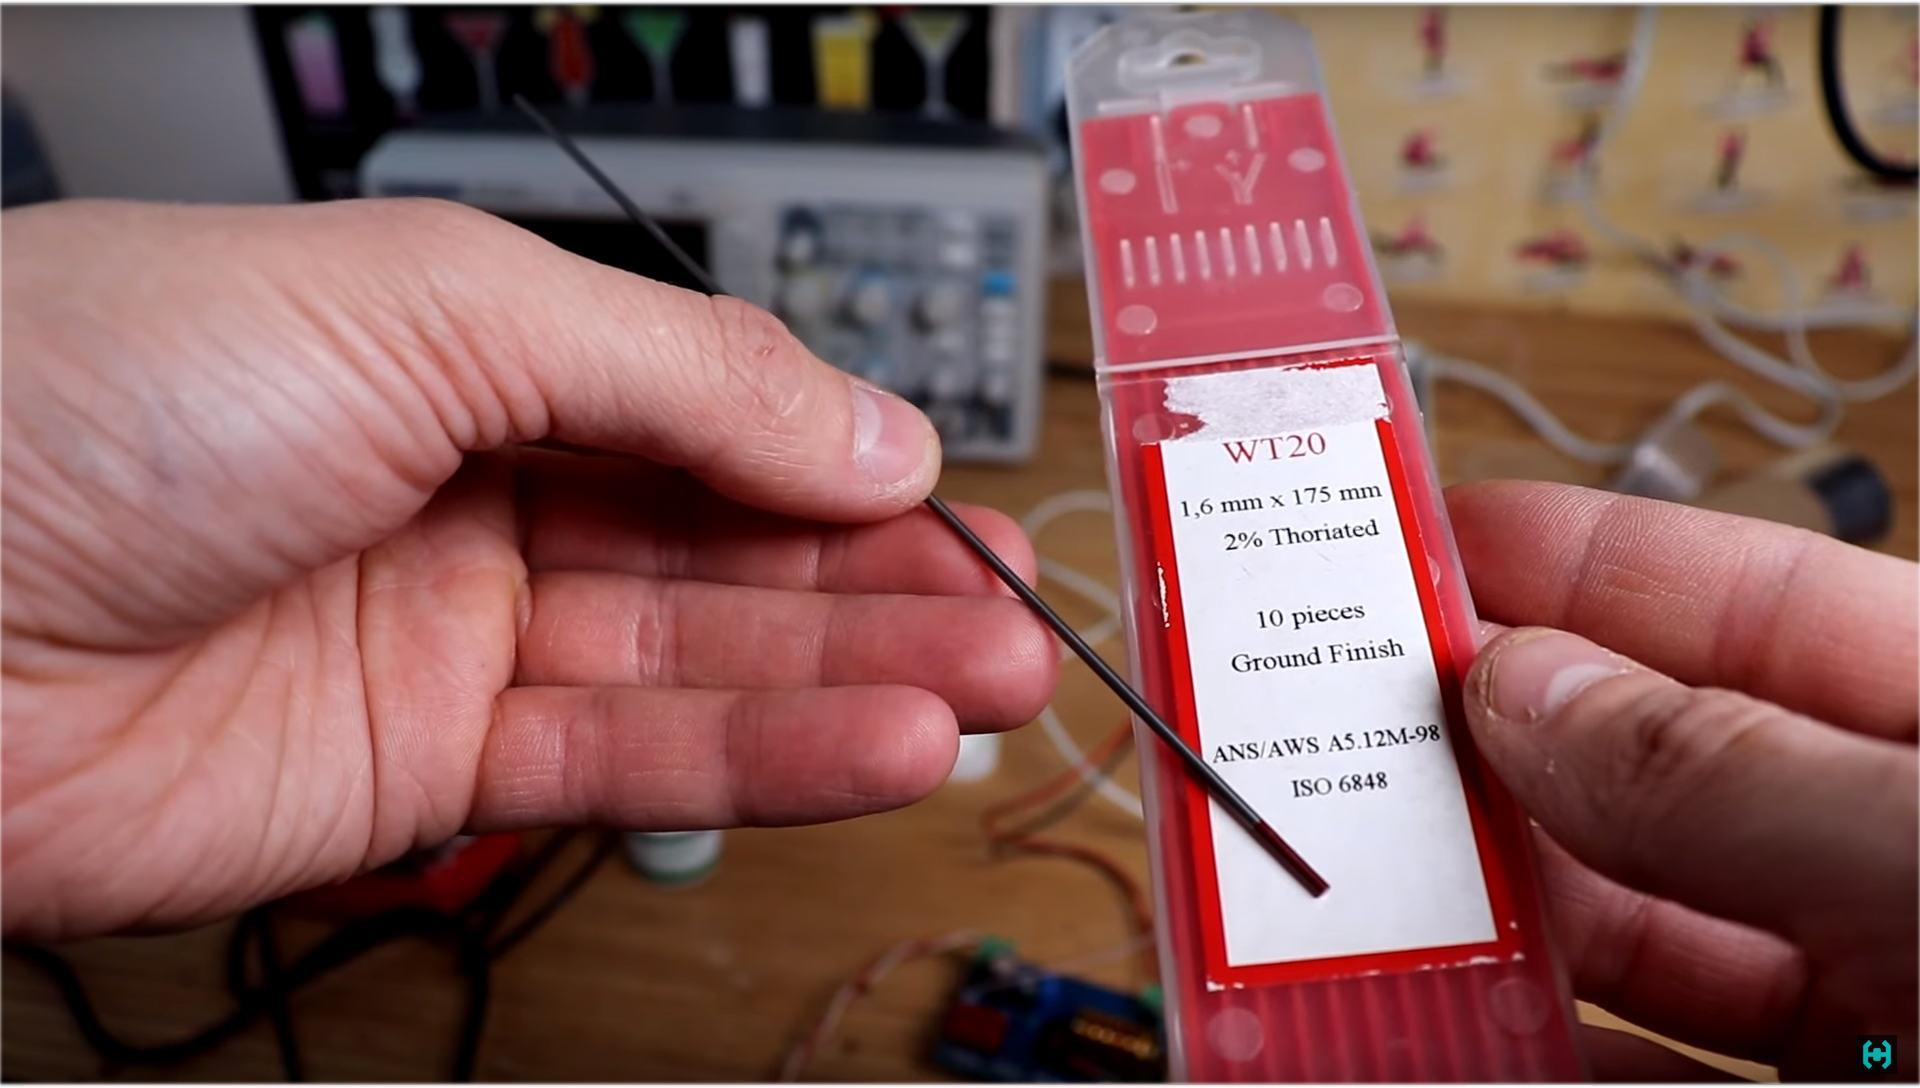 Uranium-238 is found in any uranium glass in the form of salts dissolved there. These buttons were bought in the local children's world, you can find such beauty with the help of an ultraviolet flashlight.Watches with radium phosphor constant action. This sample was found using a dosimeter at a flea market, the seller did not even suspect the existence of such artifacts. I do not advise you to keep this at home, otherwise you will need a lawyer.Americium 241.You can pick out from a fire smoke detector in which it is part of an ionization chamber. Such a source shows a gamma background of the order of 87 microroentgen. So we write on a piece of paper, 86 μR.Potassium 40. This is an ordinary potassium nitrate, which is sold in flower shops, and is used as fertilizer. Indications are 13 micro-roentgen. Almost all of the above samples are available for sale, and differ in their variety of spectra that can be studied and analyzed in practice. The radioactivity here is “extremely small,” and it takes a lot of time to discern at least some result of the same cesium.Gamma-ray spectrometry is for the most part a journey into the world of mysteries, here you will have to sort out the dodges on the monitor screen in the hope of knowing what kind of energy is emitting from isotopes.
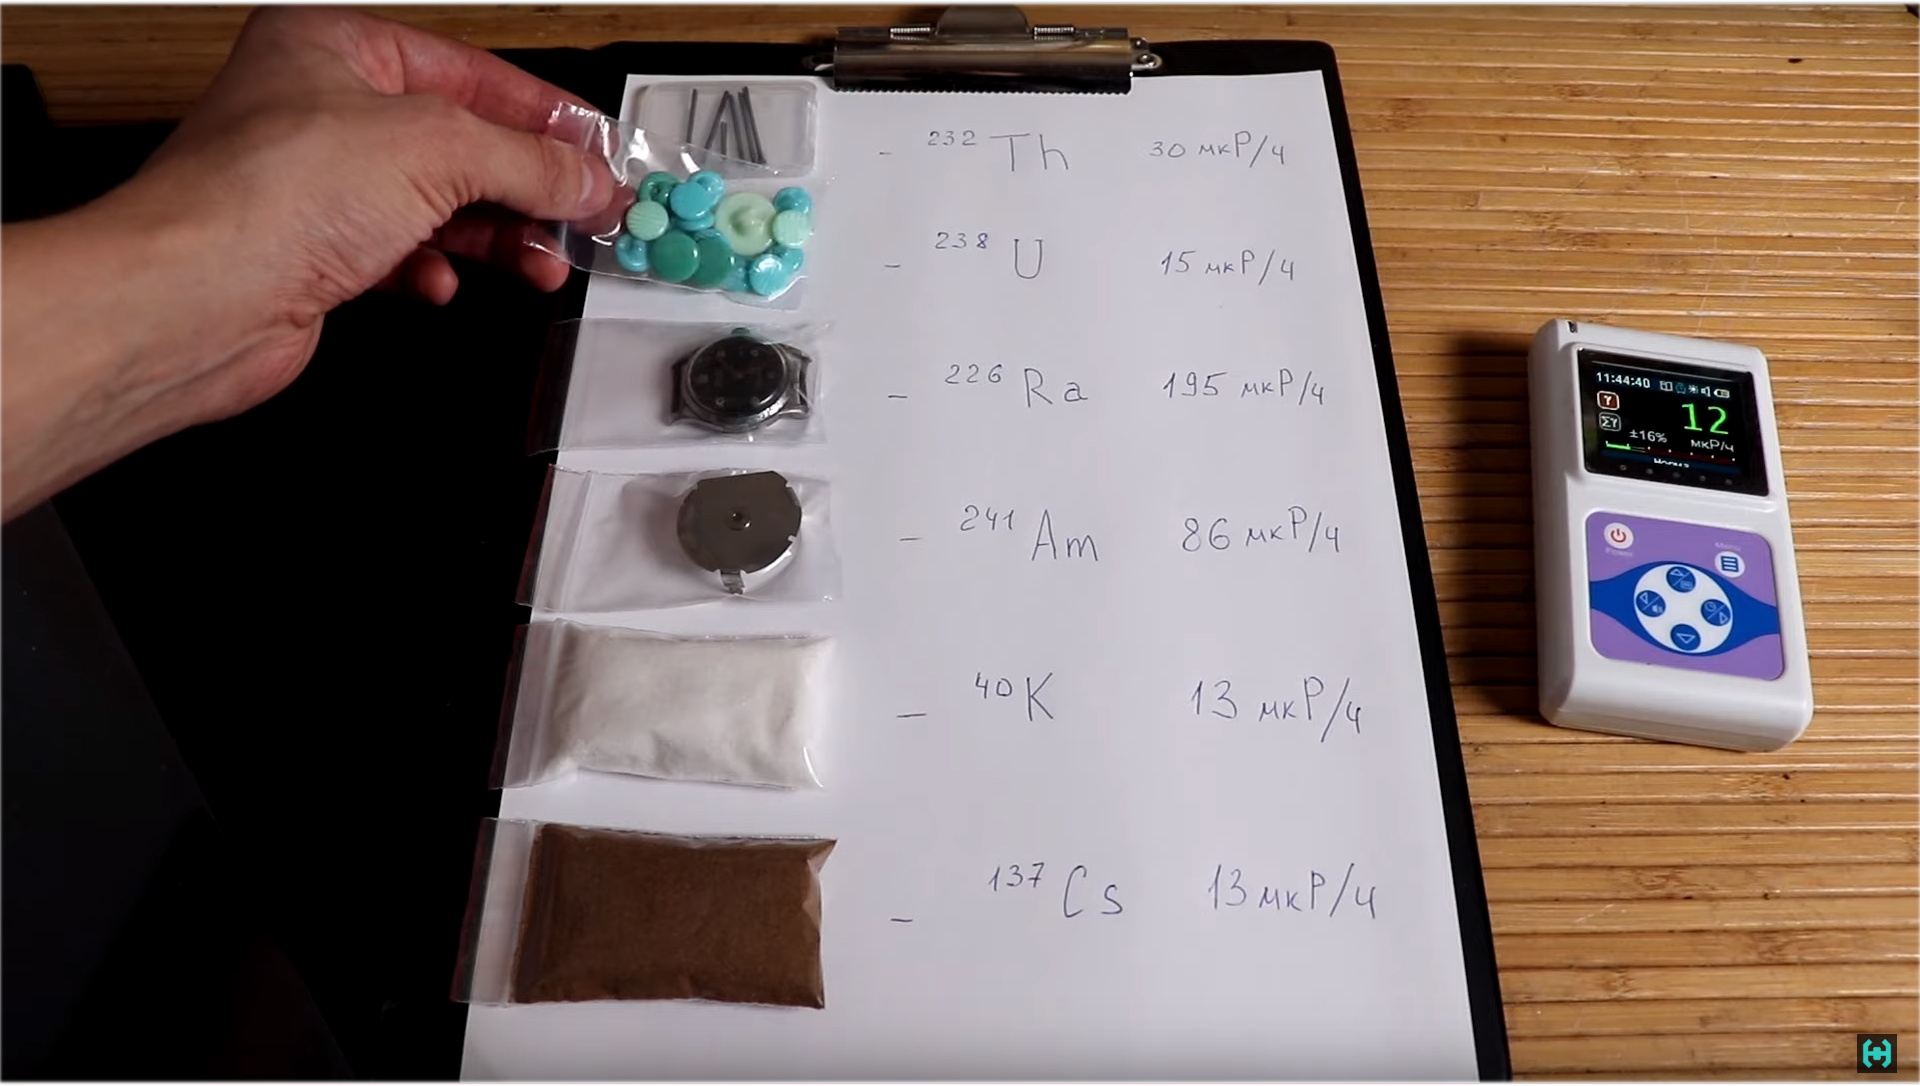 In order to simplify your task, you can make a library of spectra of the most common isotopes, as shown in this example. Now we see a linear scale, here the energy is proportional throughout the scale. Turning on the logarithmic scale, we will see a spectrum which is proportional to a certain logarithm of the ratio of quantities; it is easy to discern in it a high-energy gamut, which usually flies into the scintillator with less probability. On this beautiful note, we smoothly move from the tedious, to the most interesting part. Experiments, observations, intrigues and investigations ...
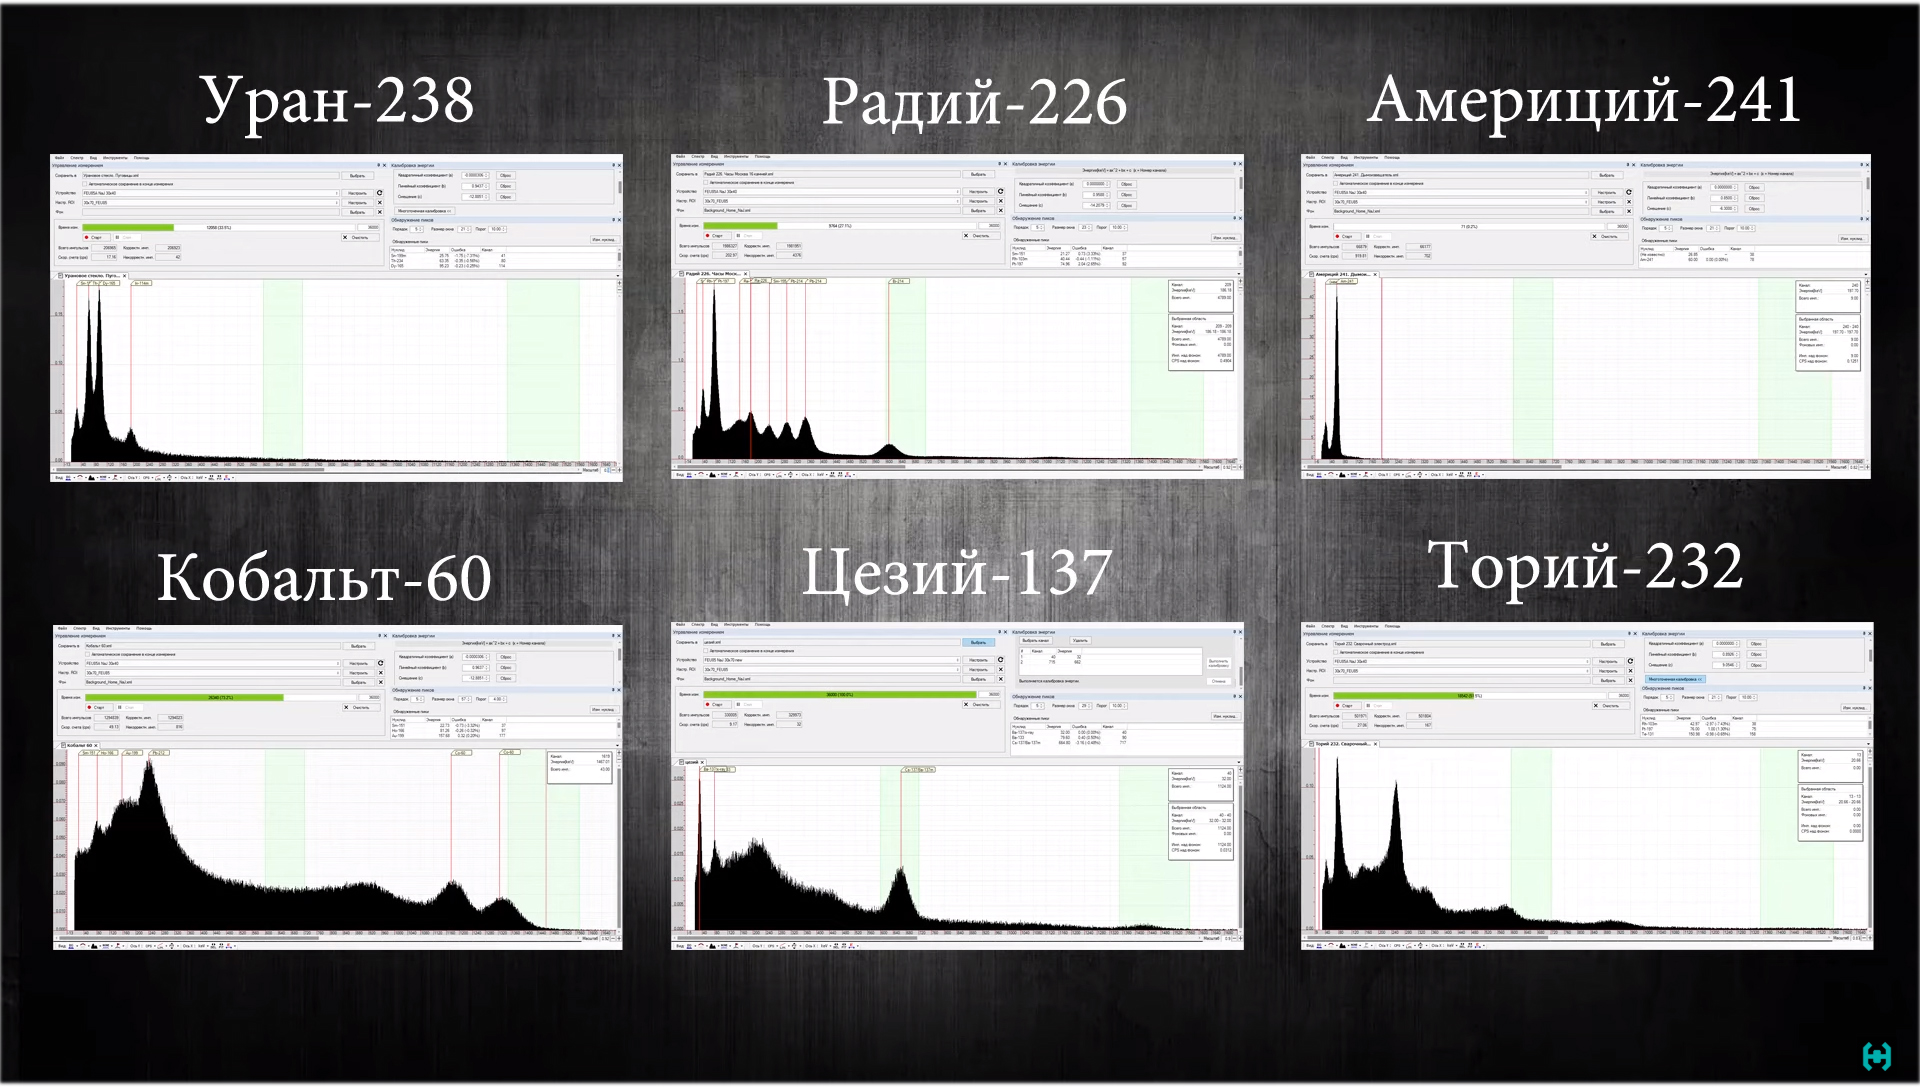 Temperature.To improve the accuracy of the measurements made by the spectrometer, some points must be taken into account. A sodium iodide crystal shifts the spectrum when the ambient temperature changes. This is especially evident in the morning and evening, when the room temperature differs by a couple of degrees. Therefore, the larger this spread during the measurement, the greater the drift, the more the spectrum spreads out on a scale, the more percent there will be a final resolution, which is not good!The position of the spectrometer in a lead house. It is advisable to carry out all measurements in the same position, for this I recommend making labels. Permalloy, although it protects the PMT from different magnetic fields, but this does not always give the desired result. The spectrum can also move in one direction or another.Many measurements in the initial stages were made through connecting a long, shielded wire. If you shorten it to one meter and screen the spectrometer well, then, provided that the temperature in the room is stable, you can observe an improvement in the resolution of cesium on the spectrum, the best is that it received 7 percent, but the source is weakly active. Not sure if the readings are correct. Following a simple recommendation, you can make a professional scintillation measuring instrument from a bunch of electronic components that allows you to determine the isotopic composition of radioactive materials.Now, someone may ask, why all the same do you need copper between the spectrometer and lead !?Let's do a simple experiment. We measure the background in the house with and without lead. In the spectrum, one can observe increased x-ray fluorescence of lead in the region of 80 keV, if one image is superimposed on another, the difference is very noticeable. Copper helps suppress this parasitic effect.
 It took a long time to understand the hallmarks of scintillators. A crystal, as they say, is a crystal in Africa. But, thallium activated sodium iodide is not easy.A little bit about the yellow crystal. All measurements were carried out at the same voltage on a PMT of 600 volts. Roughly speaking, the crystal simply changed without any adjustments. Watching the picture, even with the naked eye it was clear that all the impulses were somehow small in amplitude,If you believe in the seller’s previously expressed theory about a crystal that has turned yellow only at the walls, then the following most likely happens.That photon of light that was born in the depths of transparency is absorbed somewhere in the depths of yellow, as a result, few photons reach the photomultiplier tube. Any kind of multiplication occurs, but at the output we get a signal suitable only for counting.In counting mode, more decays of the natural background are indeed recorded. In the program we see as much as 90 particles per second.The resolution on the peak of cesium-137 is 14 percent, in this case you can really see the silhouette of cesium in the spectrum. Everything is not so simple with radios, these mono mounds disoriented me 2 years ago, forcing me to stop working in this direction.Suspicions were on the faulty converter circuit and photoelectronic multiplier. As a result, I had to buy another PMT, another crystal, spend resources and time on understanding what happened.And the following happened, I was simply deceived. Naturally, I wanted to return the money, or at least change the yellow scintillator to normal, I dialed the seller and told him the whole story, to which he answered me:- Transparency (yellowness and whiteness) is a very subjective assessment, some people say that everything is OK, everything works . Someone says that the spectrometer will not work, I’ll take it to the counting mode.To understand what a counting mode is.There is a scintillation radiometer SRP-88. The principle of its operation is to amplify any pulse that comes from a PMT to a certain level, say up to 5 volts, and apply it to its counting part of the circuit. Such a radiometer does not give a damn about the amplitude of the output signal from the photomultiplier tube. His main task is to count! Hence the conclusion, even a crystal from the garbage will go for the account. Here the question more arises as to how many light quanta will be lost on the way to the PMT.
 Continuation of the conversation:- You see, a person, when he takes a crystal of 85, 86, 87 years old, it is clear that he will not correspond to the characteristics that are in the new crystal of the 2000s;- That is, they are all with yellowness !?- Well, they are in such a degree of transparency, so to speak;- Come on! Here is the crystal of 1976, it never turns yellow and all work was carried out with it during the preparation of this release. You say that yellow crystals are bought from you for spectrometric tasks !?- Buy ...- I am the first to say that the yellow crystal is not suitable for these matters !?- Yes, the first person ...I turned to the group of spectrometry with the question: "Did anyone come across good crystals from this seller?" To which all together replied: "NO!"- I would not despair in your place ...- I do not despair, everything is fine, where else to gain experience, except for trying to figure out what's what.For reference. Filming this release took a record three years. Not all hamsters were able to see the end result of research in this direction.I would also like to thank Evgeny Solovyov , Dmitry Novikov, Sergey Matyushenko , Vasily Chechyulinsky and many others who helped in one way or another in preparing this project. There is a lot of technical information. If in the process somewhere mistakes are made, you are welcome in the comments! I'm not a spectrometer, but just a hell out of the way.
As Master Yoda said:
“Listening to you is so complicated.” Do you hear what I said?
― Teacher, moving stones is one thing. And here - a completely different matter!
-No! Not another! Other in the head only.
First part
Archive with gerber files and other utilitiesFull project video on YouTubeOur Instagram Source: https://habr.com/ru/post/undefined/
All Articles