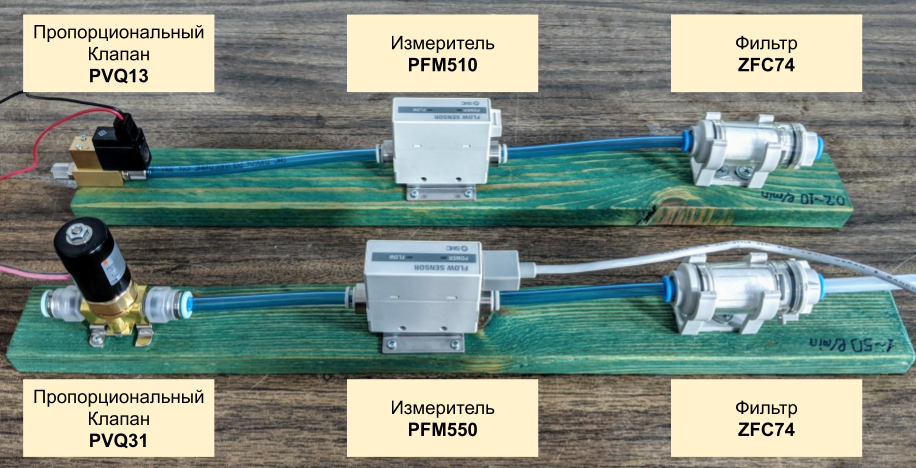
 Gas flow controllers (RRG) are designed to maintain a user-defined flow rate. RWGs are used in industry and research laboratories to organize the supply of gas from cylinders and highways. The devices of Eltochpribor, MKS, Bronkhorst, etc. are represented on the market. The cost of such devices is 1000-2500 USD. The aim of this work is to create a gas flow regulator from more accessible components. The idea is to organize a feedback system that includes a proportional valve and a flow meter. Below is a brief description of the hardware and software of the system, which allows reproducing it to everyone who uses the RRG in their activities. All source codes are available on GitHub .We used SMC products, PVQ series valves and PFM5 series flow meters without indication. Two RWGs were assembled with adjustable flow ranges of 0.2-5 L / min (PVQ13 + PFM510) and 1-50 L / min (PVQ31 + PFM550), shown in the figure. The cost of one flow regulator can be estimated from above as 100 USD (PVQ31 valve) + 80 USD (PFM5 meter) + 20 USD (Arduino Nano microcontroller, power supply and radio components) = 200 USD. Everything described below applies to the RWG 1-50 l / min. Creating a regulator 0.2-5 l / min, as well as any other regulators from similar components follows the same scheme, but may differ in minor details.
Hardware
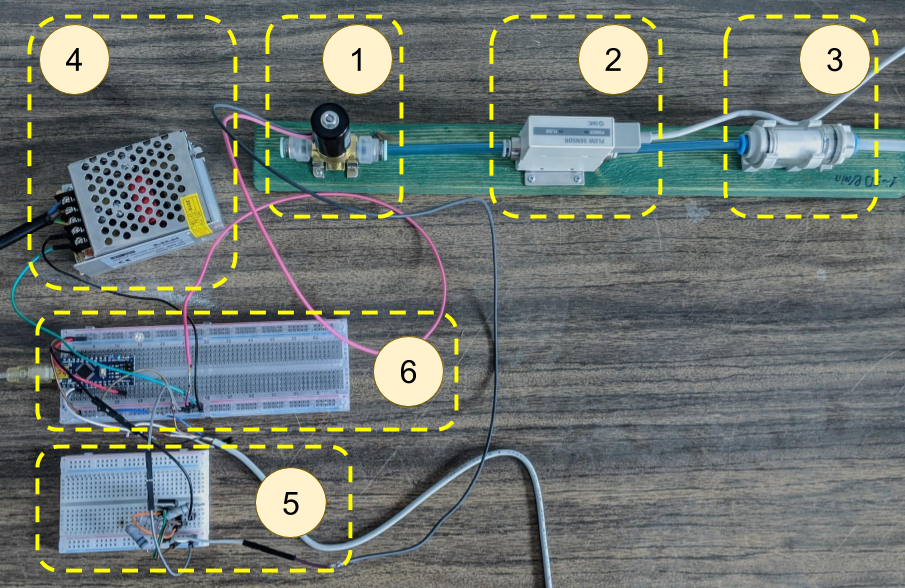 The hardware is shown in the figure and consists of:
- Proportional Valve PVQ31
- PFM550 flow meter
- Filter
- Power supply unit (24V, 1A)
- Current control circuits
- Arduino Nano microcontroller and its power schemes
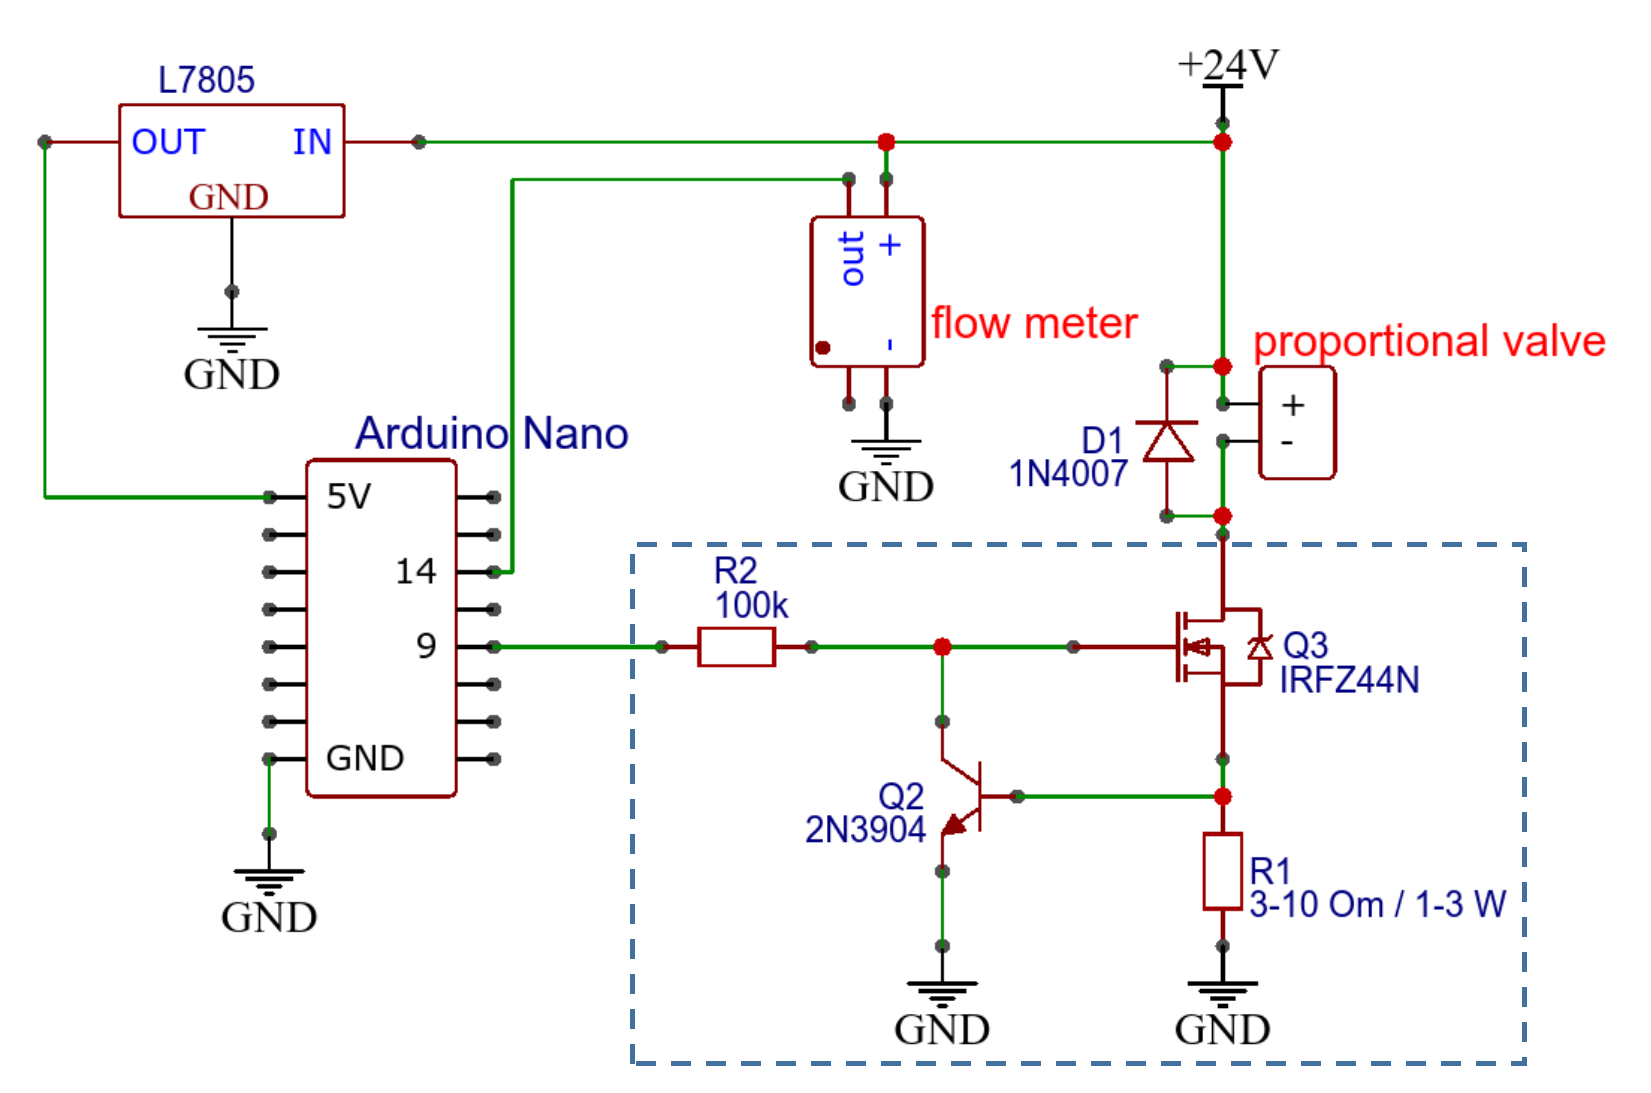 The electrical connection diagram of the components is shown in the figure. To power the circuit, a 24 V, 1 A DC source is used, which is more than enough, given the valve consumption of less than 200 mA and a meter of less than 35 mA. The PVQ Series Proportional Valves are current controlled. In accordance with the documentation, it is not recommended to control them by voltage control. Current control can be implemented using the circuit discussed here , here and in more detail here . The current control circuit is highlighted on the general electrical circuit (Fig. 3) by a dashed rectangle. PVQ series valves are connected by two power wires: red - DC +, black - DC-.The current strength is regulated using the PWM signal produced by the analog pin of the microcontroller. By default, ATmega328-based controllers (Arduino UNO / Nano / Pro Mini) generate an 8-bit (0-255) PWM signal at a frequency of 488 or 976 Hz, depending on the pin. Low PWM signal width reduces the accuracy of valve control. Low frequency leads to its buzz. These values can be increased programmatically to 10 bits (0-1023) and 15.6 kHz, respectively. We used a frequency of 7.8 kHz. A description of the commands that need to be inserted into the
 setup()Arduino firmware function is given here and here .PFM5 series flow meters have 2 signal wires (black - analog output, white - response time setting (not used)) and two power wires (brown - DC +, blue - DC-). Powered by a 24 V DC source. The flow meter gives an analog signal in the range of 1-5 V. A value of 1 V corresponds to a zero gas flow rate, 5 V - the maximum for this meter. According to the documentation, the relationship between flow and voltage is linear. Meanwhile, it seems worthwhile to regularly calibrate the flowmeter. The analog signal from the flow meter (black wire) is received by a 10 bit (0-1023) Arduino analog pin for processing and display. The white wire is designed to set the response time, we do not use it. In this case, the response time is 50 ms.The Arduino board should be powered through a 5V pin, the supply voltage should not exceed 5.5 V. Such power can be provided from the valve PSU and flow meter through the L7805 stabilizer, as shown in the diagram (Fig. 3). Most likely you will need a radiator on the stabilizer. Power from the USB port of the computer used during testing (Fig. 2) is not desirable since in this case the reference voltage is unstable when using the ADC. For more information about board power, see here .Software partThe software part consists of the firmware of the Arduino Nano microcontroller and a graphical user interface that runs on a PC.The program downloaded to the microcontroller cyclically performs the following actions:- ,
- ,
- , -
The system can operate in manual and automatic mode. During manual operation, the value of the desired valve opening, expressed by a variable valve(0 <= valve<1023), should be sent to the serial port . The value of this variable determines the occupancy of the PWM signal, which is sent through the analog output of the microcontroller to the current control circuit and the proportional valve command analogWrite(valvepin, valve). After opening, the valve remains in the set position until a new command is received via the serial port.To switch to automatic operation, a negative number must be sent to the serial port -targetflow. Variable valuetargetflowlies in the range 0-1023 and determines the gas flow rate that should be maintained. The actual gas flow rate is determined by the flow meter readings, which are read from the analog input of the microcontroller with a command realflow = analogRead(fmpin)(0 <= realflow<1023). In automatic mode, the system strives to maintain equality between targetflowand by realflowcontrolling the proportional valve. The valve opening value is calculated using the proportional-integral-differentiating (PID) controller. You can read about the PID controller here , here and here . The GyverPID library is used to implement the controller .with some changes and additions. Since the library has been modified, use the library attached to this code, and not downloaded from the link above.To use the PID controller, it is necessary to select the coefficients of the proportional Kp, integral, Kiand differential Kdcomponents, as well as the iteration time dtpid. The value of the variable dtpidmust be selected depending on the inertia of the system. The more inert the system, the more it should be dtpid. Based on the ratings and test results for the device in question, we chose values dtpid= 100-330 ms. The coefficients Kp, Ki, Kdare selected at a fixed valuedtpidand significantly depend on the system. Recommendations on the selection of coefficients can be found here , here and here .So, the algorithm cyclically executed by the microcontroller is as follows:if( )
inp
if(inp >= 0 && inp < 1023)
inp
if(inp <= 0 && inp >= -1023)
-inp
if( && dtpid )
-
if( dt )
The graphical user interface is written in Python using the PyQt graphical framework. The design was created in the Qt Designer program, after which the code of the .ui file was converted into a Python file. For an introduction to GUI development and the use of PyQt, see here and here .The graphical interface interacts with the Arduino firmware via the serial port using the library pyserial. The Python program does the following:- , ,
- 0-1023, ,
- .3
- , ( 0-1023)
- .5
The code for connecting to the serial port is borrowed from here .The module is intended for transferring from user units to the range 0-1023 units.py. This module makes it easy to add new units. The user is required to indicate the name of the units and the conversion formula from 0-1023 to the new units. The module is provided with detailed comments.Data received from the flow meter and output by the microcontroller firmware to the serial port are read from the port by the Python program and, after the units have been converted, are displayed in text and graphical form. A library is used to draw a graph of current consumption pyqtgraph.results
To start working with RRG, you need to: flash the microcontroller, connect the power, run the Python program, establish a connection to the serial port. After that, the user can select the operating mode (manual or automatic) and set the required valve opening value in manual operation mode or the supported flow value in automatic mode. The current gas flow rate is displayed in the corresponding field and displayed on the graph. The graph is updated cyclically, after reaching the specified number of points, the graph is cleared and drawing starts again. The user can select the units used.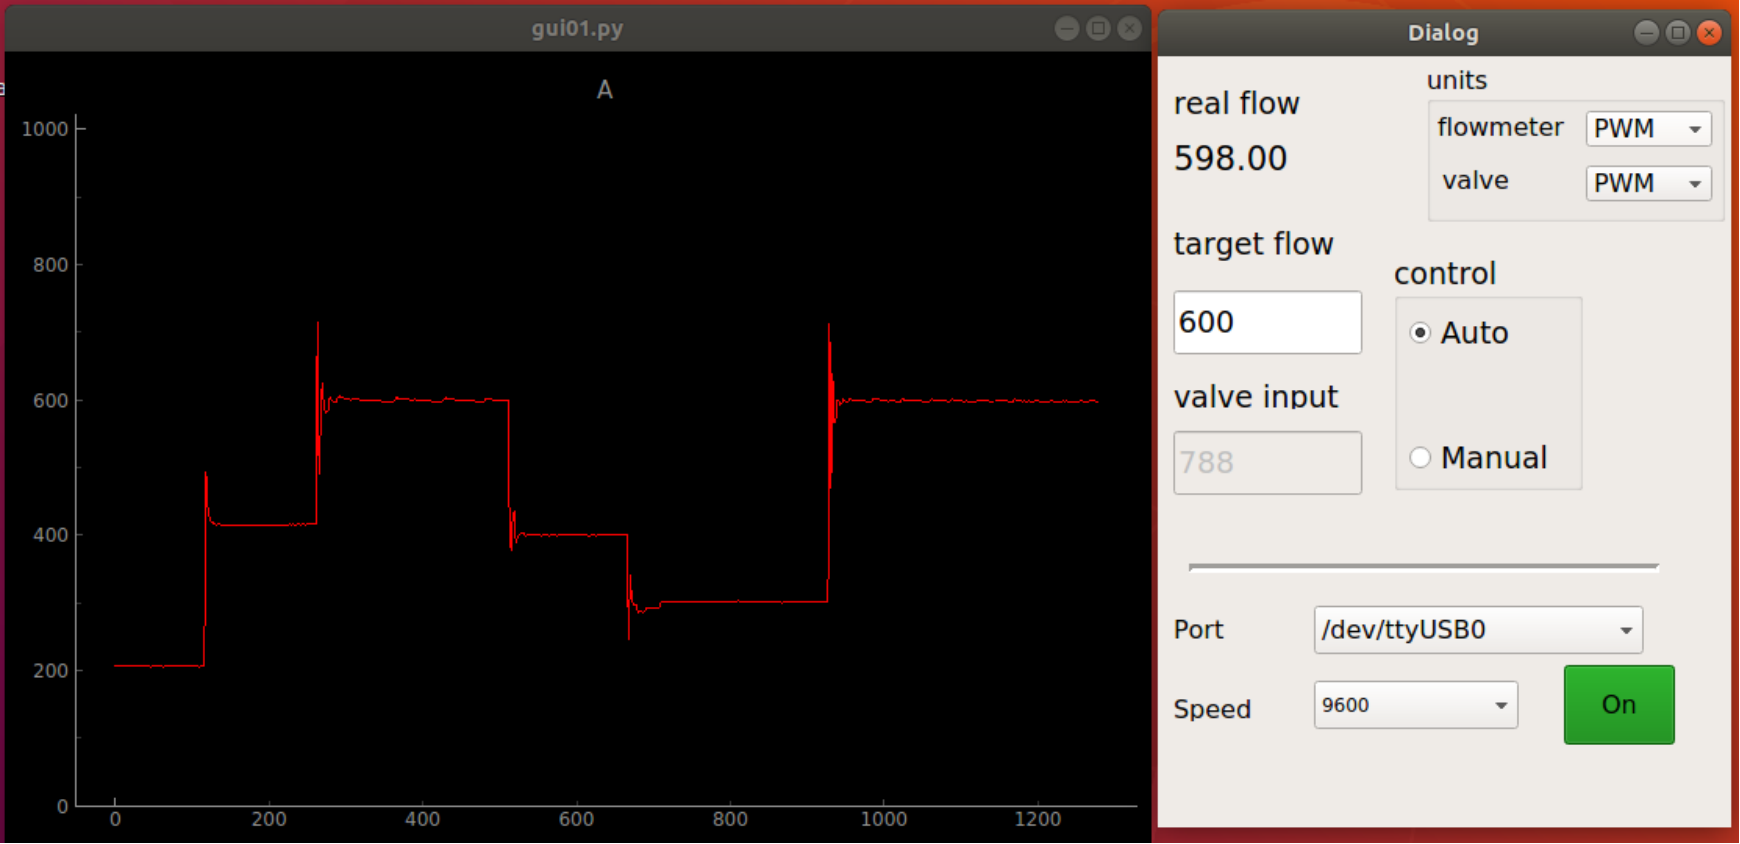 The figure shows the appearance of the graphical user interface and a graph of the gas flow rate obtained in the automatic mode and showing the switching of the RGG between different values of the supported flow rate. The results are given in units of 0-1023.To demonstrate the possibilities of maintaining a constant gas flow rate, we considered the case when the flow rate when the proportional valve is opened by a constant value “floats”, as shown on the left side of the graph (x <950) in the figure below. The result of the operation of the automatic maintenance of the set flow rate can be seen on the right side of the graph (x> 1000). Tests showed that the deviation from the set flow rate in the automatic hold mode is no more than 2%.
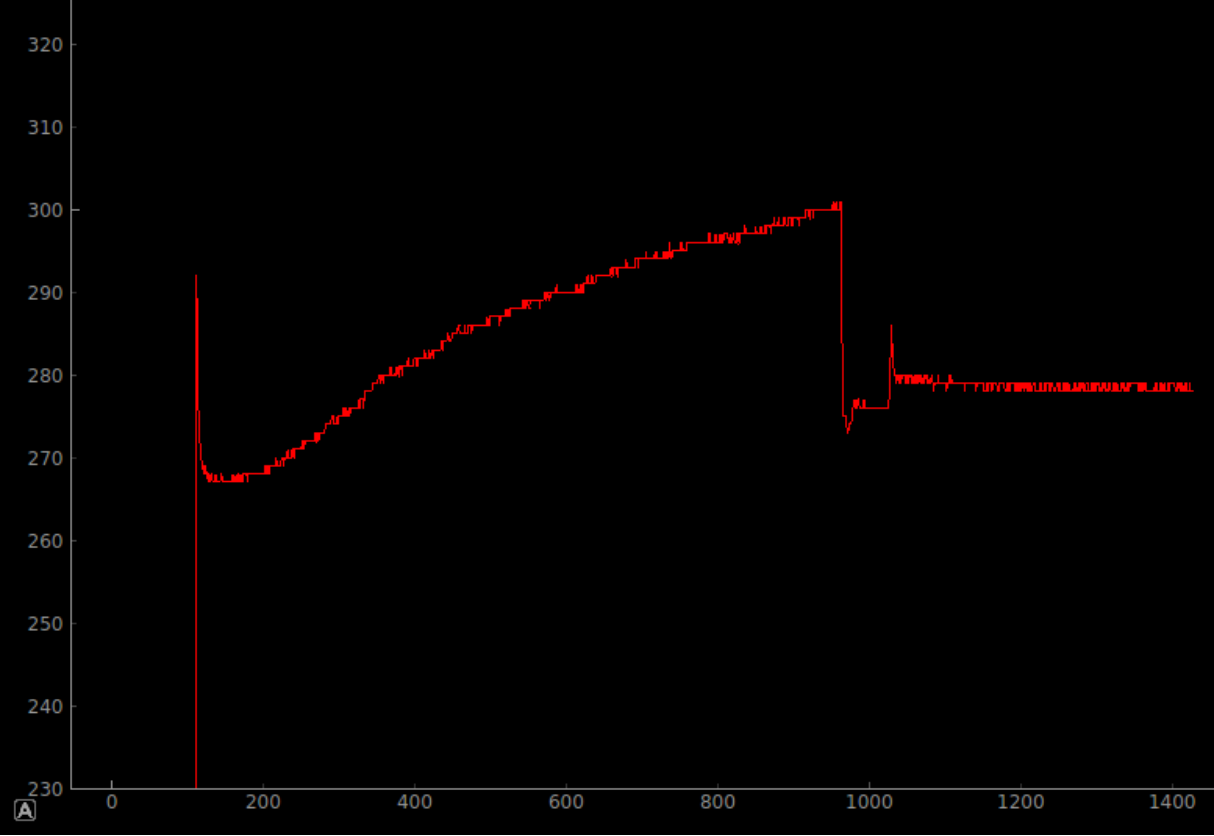
Remarks
Using the Arduino Nano microcontroller is unnecessary since only a small part of its pins is involved. On the other hand, it would be better to use microcontrollers with a larger bit capacity of analog inputs / outputs to increase the accuracy of measurement and adjustment. When changing the type of microcontroller, it may be necessary to implement your own PID controller; this should not cause difficulties since the algorithm is simple.At the development stage, the electrical circuit was assembled on a breadboard (see Figure 2). For further use, it is necessary to solder the circuit and place it in the housing.The authors of the article are neither electronic engineers nor programmers, therefore, constructive tips for improvement are welcome.Additional materials
The source codes for the Arduino firmware and Python programs, as well as the documentation for the flow meters and proportional valves used, are available on GitHubAcknowledgments
We are grateful to our colleagues for the idea of the system implemented in this work. AlexGyver and other users generously sharing their experiences for the information we used in our work.findings
Using a feedback system consisting of a proportional valve, a flow meter, and a microcontroller allows you to make RRG to maintain a given gas flow. Tests showed a deviation from the required flow rate within less than 2%. The cost of the system was less than 200 USD. The assembled prototype showed operability in a wide range of conditions. Further use may require refinement, including wiring the circuits, manufacturing the case, etc.