How to calculate the financial model of a loyalty program
This year, for the first time, we considered the financial model of a loyalty program. In order for the loyalty program to really work, the project must be approached very carefully.Types of Loyalty Programs
- Scoring - for each purchase, the client receives points, which he can then spend.
- Getting a cashback is the same as with points, only for purchases customers receive a cashback, usually in the form of a coupon for some amount that can be used exclusively from the same retailer.
- Cards with marks - on the first purchase, the customer receives a card, on each subsequent purchase - stamps are put on it, stickers are glued or holes are punched. When the card is full, the buyer receives either a reward or a discounted card.
- Multi-level system of discounts - upon reaching certain amounts of purchases, the client switches to new statuses. More status - higher discount.
- Rewards from partners - for purchases, the client receives discounts / points, which he can use from brand partners.
- Paid bonuses - the client pays to participate in the loyalty program. For payment receives fast / free delivery, additional discounts, etc.
- A combination of rewards - such programs are called hybrid. For example, a point system + a multi-level system, when depending on the level, different points are awarded for purchases: a higher level means more points.
- Non-monetary rewards. Loyal customers receive intangible bonuses. For example, a meeting with the captain for a regular passenger of the airline.
In the article, we analyze the calculations for option 4 from the list in which the discount grows depending on the accumulated amount of purchases.Collect data from previous periods
Loyalty programs exist to encourage customers to buy more. If they would buy 3600 rubles without a loyalty program, and 4000 with a program, the company makes money on it. But it so happens that the loyalty program was calculated and implemented, but FIGs will understand why people buy: either because they are already loyal and ready to buy, or the loyalty program really stimulates them.Therefore, in the calculations it is important to build two forecasts:- what would be sales without a loyalty program;
- what an increase in sales will give the loyalty program.
This requires retrospective sales data.First of all, you need to analyze how sales go without a loyalty program - upload the data and study it. There are features here.- . - -. , , , . , : .
- , . , . , , , , , . , .
- Most likely, the data will have to be processed, it is unlikely that you will receive it in perfect form: duplication of purchases or too large amounts from wholesalers - all this will have to be cleaned.
Explore customer behavior
The data was collected and cleaned. Then you can get valuable information from them:- total number of customers;
- the number of loyal customers who bought more than once, and the number of “one-time” customers;
- how much customers buy.
For clarity, we have compiled this diagram in Power BI. It shows the ratio of loyal customers and “one-time” ones: And then we take a closer look at loyal customers: how much they buy, how many times, when.
 Vertical here is the period for which customers made purchases; the numbers on the columns and the length of the column indicate the number of customers, color - the number of purchases.How to understand this diagram:
- 2874 customers made 2 purchases in one month, 783 customers made 3 purchases in one month;
- 1145 customers made 2 purchases in two months, and 487 - 3 purchases in two months;
- etc.
The amounts of purchases could be set by a separate filter: In the future, these data were transferred to a table, but more on that later.
Based on the data to build a forecast without a loyalty program
The forecast answers the question of what sales will look like, if you leave, everything is as it is. In our case, offline sales grew, while online sales fell. We apply data on loyal / “one-time” customers and purchase amounts to the trend of last year and get the forecast for the next year: In this paragraph, the nuance is this: you must take into account the trend of the previous period and seasonality. You cannot count on a loyalty program, assuming sales will grow. We need to look at the real numbers and build a forecast based on them.
Assume Loyalty Program Model
At the beginning of the work, when we still do not know which program we will choose: what type, how discounts will be accrued and under what conditions, we must assume something, otherwise there will be nothing to consider. In our example, the type when the discount increases depending on the amount of purchases. For him, we proposed four models for calculating discounts.But, as we have already said, one cannot proceed only from the assumption that sales will grow, and new customers come in droves. Therefore, we suggested three options for increasing the number of customers: pessimistic, moderate and optimistic. But it is possible that the number of new customers will depend on the discount. Therefore, these forecasts varied depending on the discount accrual model.We considered 4 models of the loyalty program in three versions (pessimistic, moderate, optimistic) separately for offline and online: But of course, we will give examples only for one model, online.
Calculate how many customers are already on prospective loyalty program statuses
We have data on customers and purchases, we have a model of a loyalty program. Now you need to transfer the data to the loyalty program. We compile a table and calculate what percentage of customers at which statuses of the loyalty program is already located and how this percentage will change by month: Actually, the values in it are calculated for 12 months, but only two are shown here so as not to overload you with unnecessary information. The main thing to pay attention to is the percentage of clients in different statuses. Statuses start at 5,000 rubles, but we also counted up to 3,000, because when buying for 3,000, the buyer receives a gift.
Calculate how many customers are easily motivated to transition to a new status
The next step is to check how many clients are in the border status values. These are those buyers who need to buy quite a bit before a gift or a transition to a new status. That is, if a client has already bought for 2800 rubles, then selling him something else up to 3000 will be easy - pay only 200 rubles and you will receive a gift. This is what we call boundary values.But it’s one thing when a customer bought 700 rubles. Then you are unlikely to be able to convince him to buy another 2300 rubles for the sake of a gift. But if he bought for 23,000 rubles, then buying another 2,000 and getting a bigger discount is not so difficult for him.Therefore, for different statuses we consider different boundary values. For the first status, which starts with 5000 rubles, there are several borderline values: we find the proportion of customers who are in the ranges of amounts 3500–3999 rubles, 4000–4499 rubles, 4500-4999 rubles. For the last status, starting with 25,000 rubles, the range is one - 21,000–24,999 rubles.
Predict uplift from loyalty program
And here the article begins to resemble the movie “The Wolf of Wall Street”. You look, you look, the plot is filled with many events, it already seems to you that the movie is coming to an end, and then - once - and the helicopter crash scene with which the film began. And you understand that all this time I watched the backstory.So, everything that has been described so far has been a prehistory to the main goal - the calculation of the uplift. That is, what an increase in turnover will give the loyalty program.Nuances when calculating aplift
- . , 2030 3000 , . . 970 , . . 5% ( — 150 ) , — 350 . , 350 150 970 = 470 . 470 2030 23% — .
- , . , , . , , , , . , , , . 80% .
Calculations by months looked like this: A few explanations: The left tables are auxiliary, in them are the distribution of clients by status. On the right - the distribution of customers in close to status values. Depending on what status and how close they are, we assume a different conversion to a transition to a new status. We have already said that the average sales check is considered to be over 80% of the usual average check. Subtract the value of the gift, the percentage of the discount from it, and online delivery also. The number of customers at different steps of proximity to the new status is multiplied by the average check and the estimated conversion. We get how much we can sell - uplift. We calculated all this: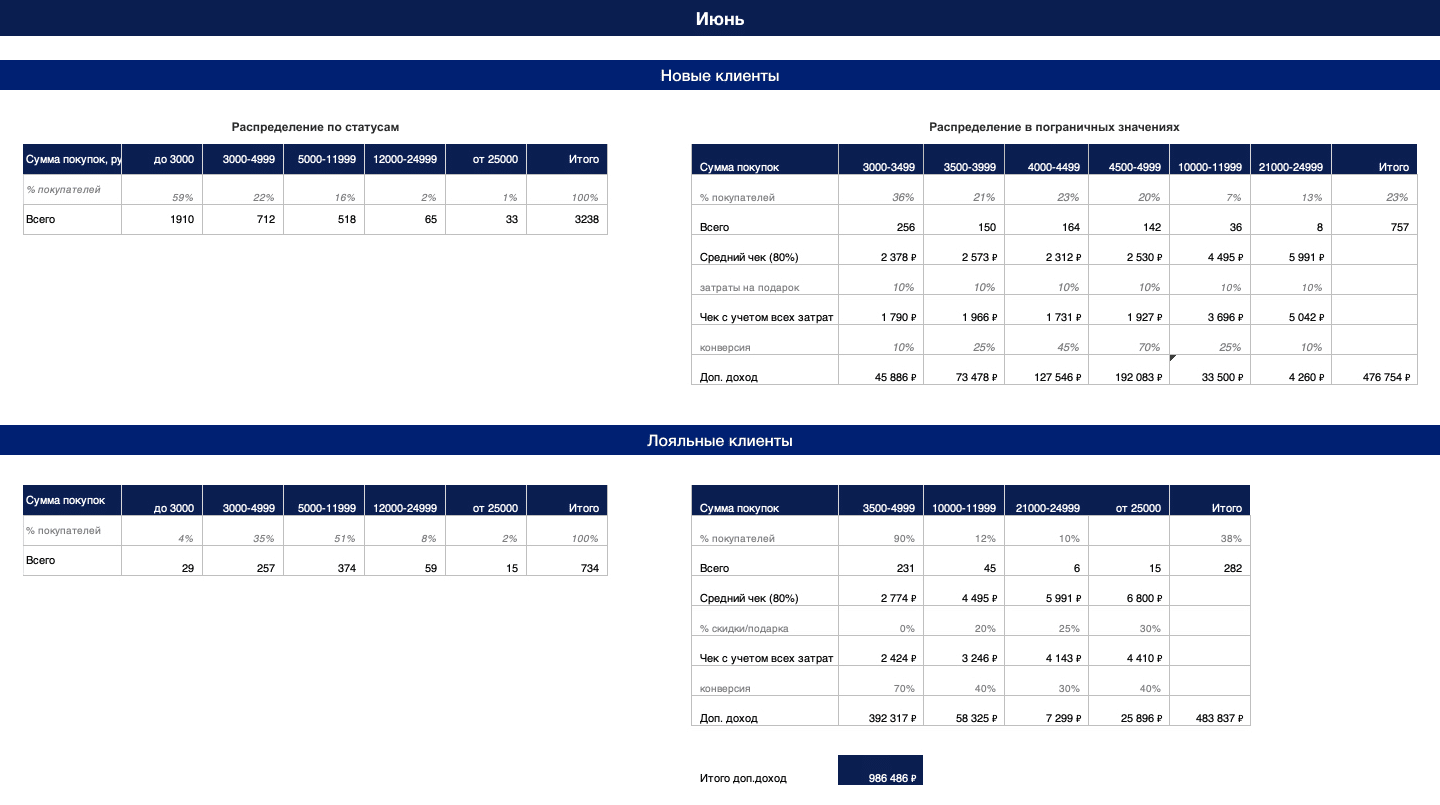

- for 4 models of the loyalty program;
- 3 forecasts of attracting new customers (pessimistic, moderate, optimistic);
- Separately for offline and online;
- 12 months for each model, separately for new and loyal;
- Separately, the category of customers is up to 3000 rubles, they were considered immediately for a year, not for months.
It turned out 312 tables in Excel.These were monthly calculations, but in order to choose the optimal model of the loyalty program, you need to collect all the data in the annual forecast. So for each submarine model, we summarized these values and made a forecast for the year in a pessimistic, moderate and optimistic version. And compared with the forecast without a loyalty program. In this table, the offline and online data are summarized.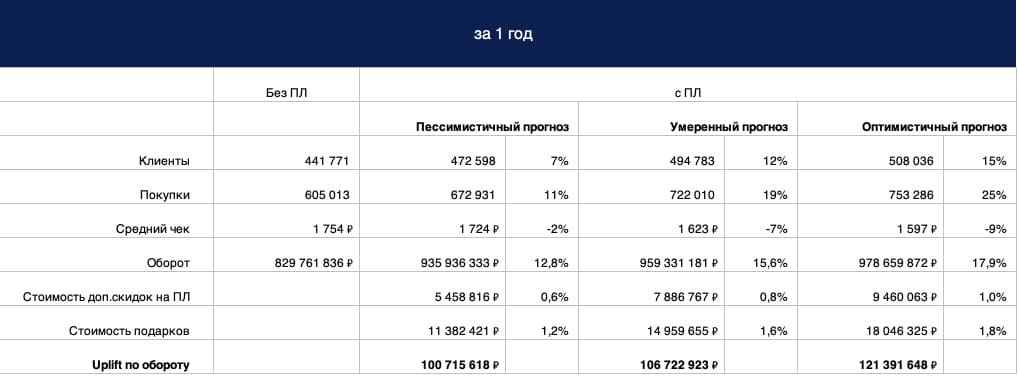
Choose the best model
And then, if you considered several models, it remains only to choose the optimal one: the greatest uplift at the lowest cost for encouraging customers.In our calculations, this one wins:Discounts of 0%, 10%, 15%, 20%, with amounts of 5,000 rubles, 12,000 rubles and 25,000 rubles.Parting words
We have described only one calculation option for only one type of loyalty program. Other types will have different difficulties, but the principles are the same everywhere:- Calculations should be as scrupulous as possible, or even burn out briefly.
- You need to calculate the loyalty program on real data and take into account sales trends of the previous period.
- Online patterns are different from offline, you need to consider the submarine model separately.
- You need to consider the price of gifts that motivate you to transition to new statuses, and online, you may also need to consider delivery;
- After calculating the financial model, the work does not end, since any forecast is a hypothesis. We implement, check how it works, whether forecasts come true. Perhaps something will change, so you need to change the model itself.
Source: https://habr.com/ru/post/undefined/
All Articles