Salute, Khabrovites! In anticipation of the start of a new set for the DevOps Practices and Tools course , we have prepared for you a translation of interesting material.
This article is a brief introduction to Loki. The Loki project is supported by Grafana and aims to centrally collect logs (from servers or containers).The main source of inspiration for Loki was Prometheus with the idea of applying its log management approaches:- use of labels (labels) for data storage
- low resource consumption
We will return to the principles of Prometheus and give some examples of its use in the context of Kubernetes.A few words about Prometheus
To fully understand how Loki works, it's important to take a step back and recall Prometheus a bit.One of the distinguishing features of Prometheus is the extraction of metrics from collection points (through exporters) and storing them in TSDB (Time Series Data Base, time series database) with the addition of metadata in the form of labels.Why is it necessary
Recently, Prometheus has become the de facto standard in the world of containers and Kubernetes: its installation is very simple, and the Kubernetes cluster initially has an endpoint for Prometheus. Prometheus can also retrieve metrics from applications deployed in a container, while retaining certain tags. Therefore, monitoring applications is very easy to implement.Unfortunately, there is still no turnkey solution for managing logs, and you must find a solution for yourself:- managed cloud service for centralizing logs (AWS, Azure or Google)
- monitoring as a service monitoring service (for example, Datadog)
- creating your own log collection service.
For the third option, I traditionally used Elasticsearch, despite the fact that I was not always happy with it (especially its severity and complexity of the settings).Loki was designed to simplify implementation in accordance with the following principles:- be easy to get started
- consume few resources
- work independently without any special maintenance
- complement Prometheus to help investigate bugs
However, this simplicity is achieved through some compromises. One of them is not to index content. Therefore, text search is not very effective or rich and does not allow statistics on the content of the text. But since Loki wants to be the equivalent of grep and complement the Prometheus, this is not a flaw.Incident investigation
To better understand why Loki does not need indexing, let's go back to the incident investigation method used by the Loki developers: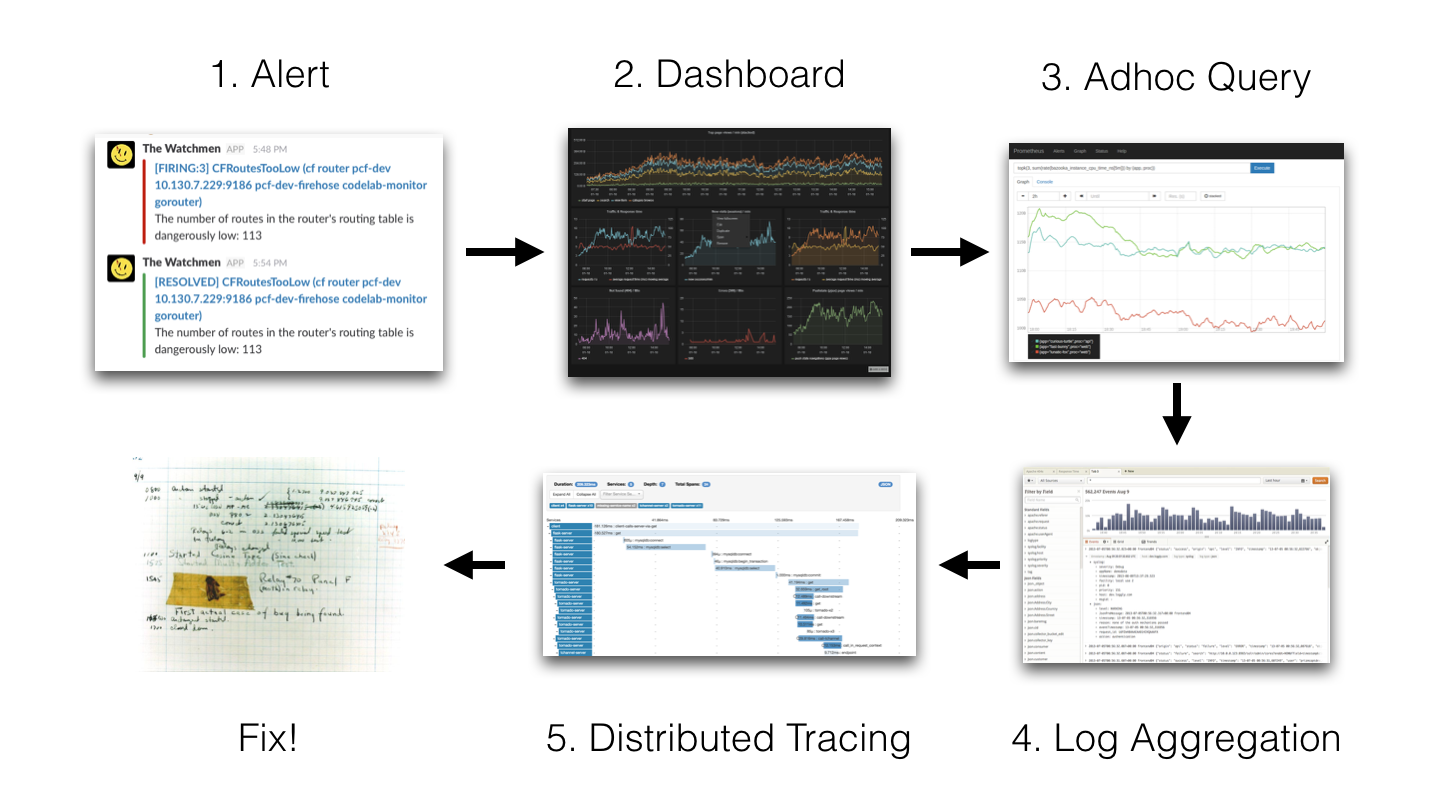 1 Alert → 2 Dashboard → 3 Adhoc Query → 4 Log Aggregation → 5 Distributed Tracing → 6 Fix!
(1 Warning → 2 Dashboards → 3 Adhoc Query → 4 Log Aggregation → 5 Distributed Tracing → 6 Correcting!)The idea is that we get some alert (Slack Notification, SMS, etc.) and after that:- Grafana
- (, Prometheus)
- (, Elasticsearch)
- , (Jaeger, Zipkin .)
- , , .
Here, in the case of the Grafana + Prometheus + Elasticsearch + Zipkin stack, you will have to use four different tools. To reduce time, it would be nice to be able to perform all these steps with one tool: Grafana. It is worth noting that this approach to research has been implemented in Grafana since version 6. Thus, it becomes possible to access Prometheus data directly from Grafana.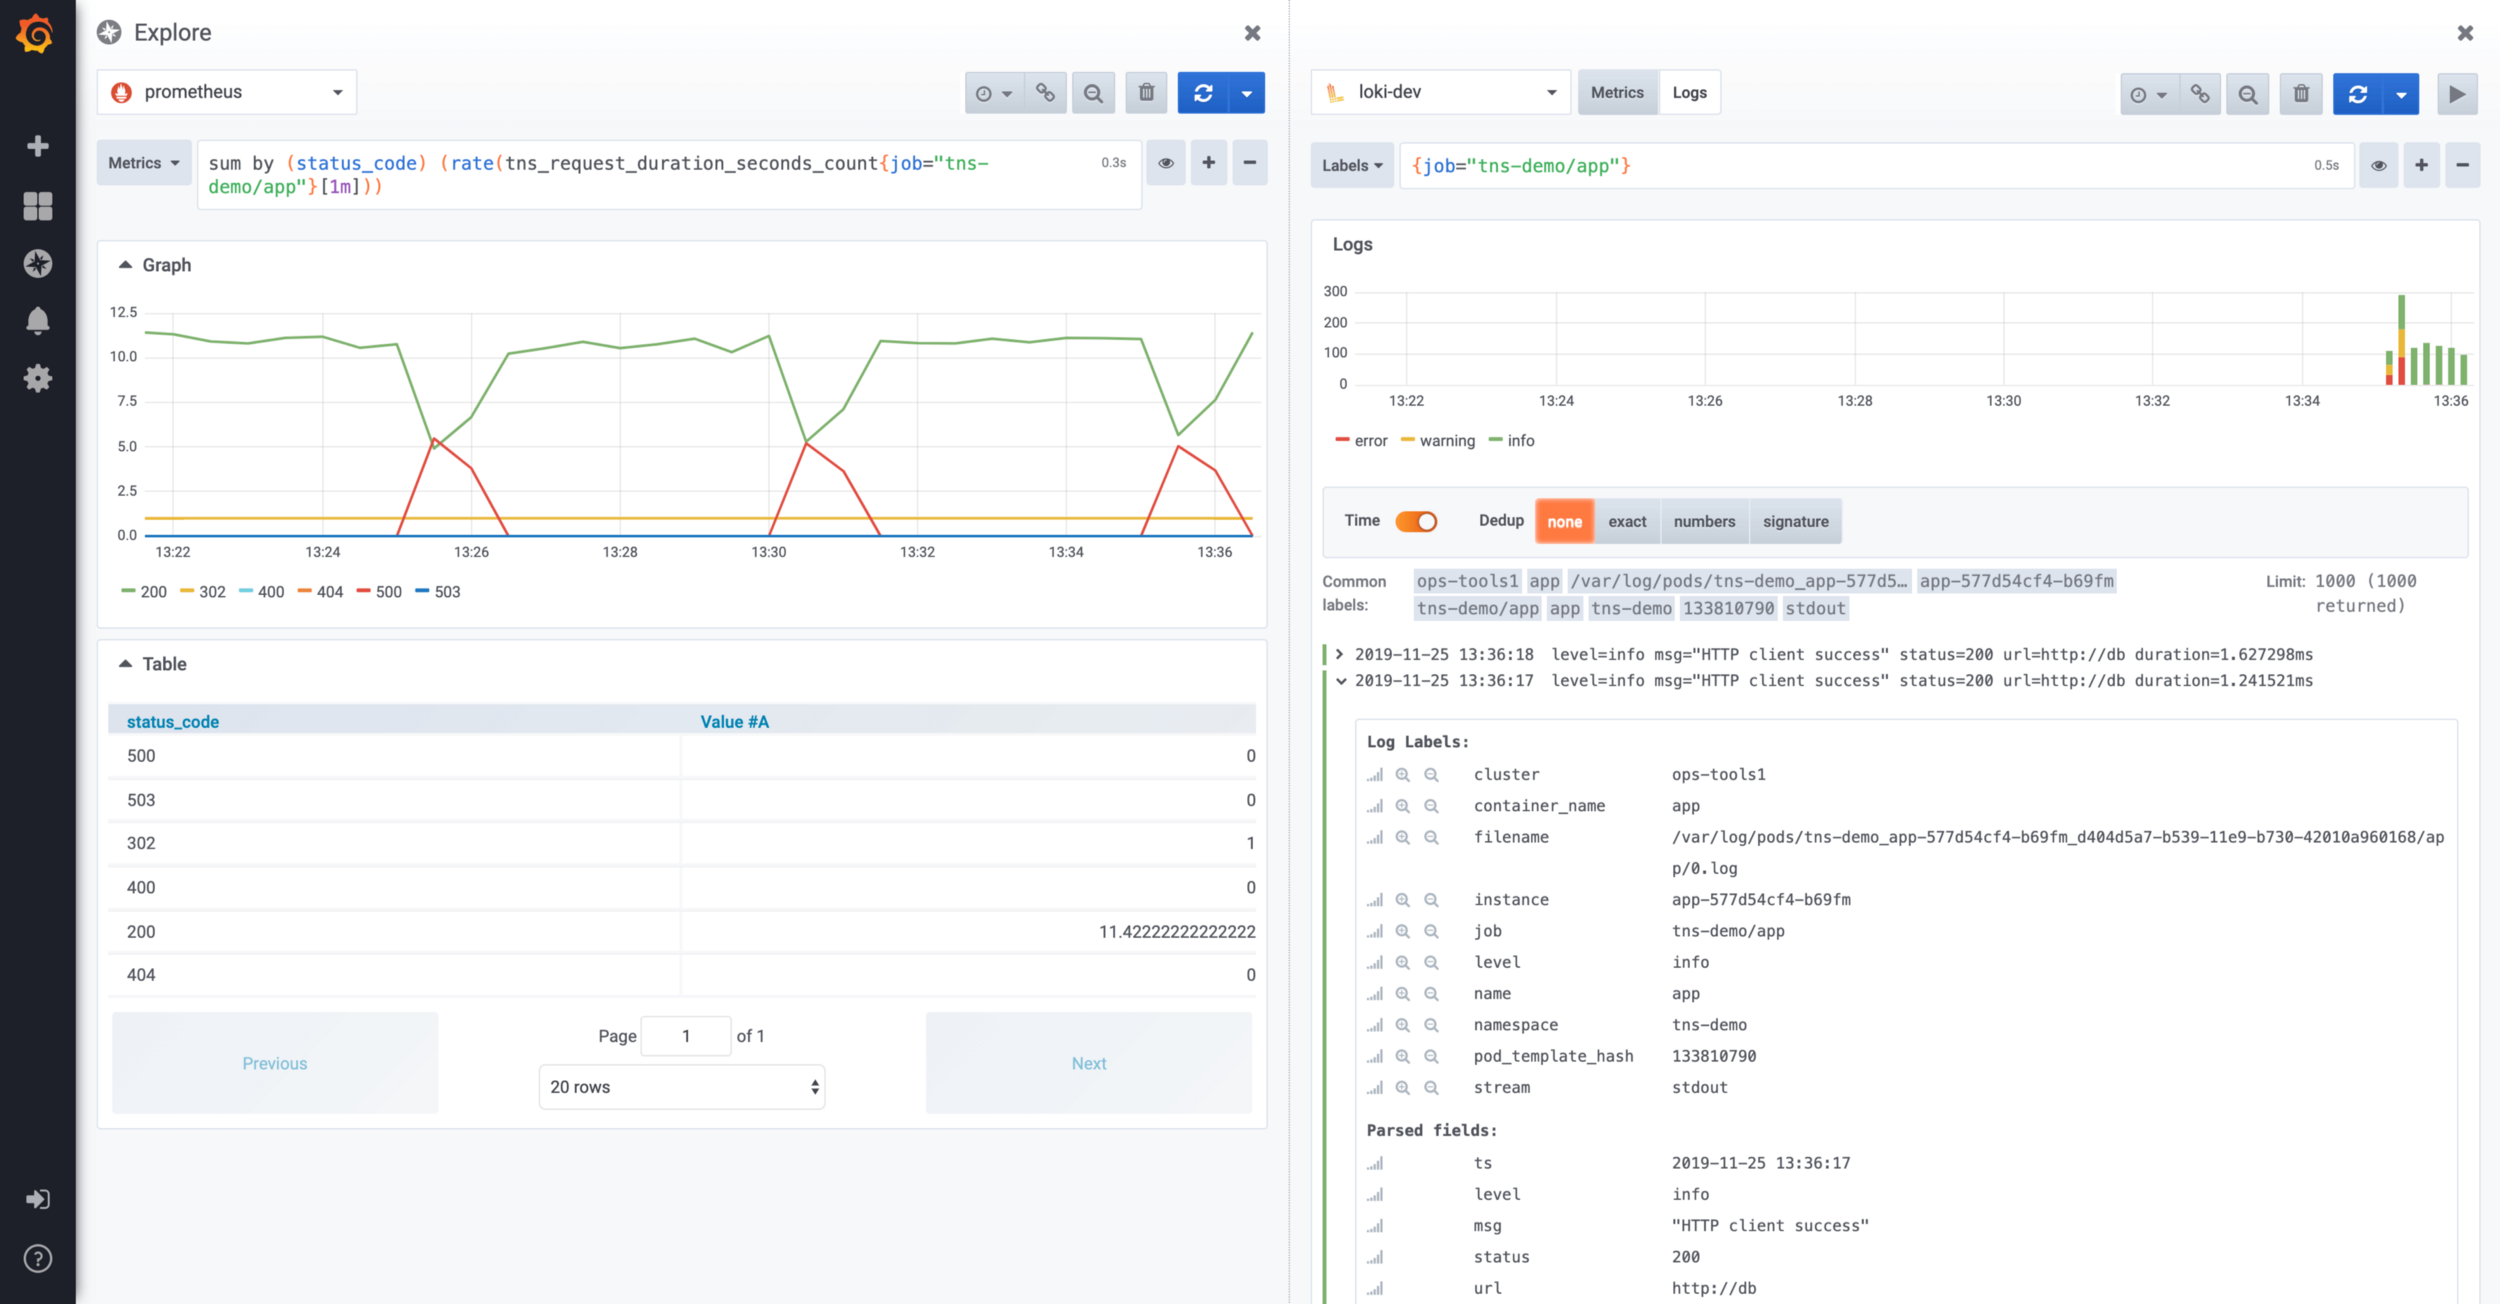 Explorer screen split between Prometheus and LokiOn this screen, you can view Loki logs related to Prometheus metrics using the split screen concept. Starting with version 6.5, Grafana allows you to process the trace id in the Loki log entries to follow the links to your favorite distributed tracking tools (Jaeger).
Loki Local Test
The easiest way to test Loki locally is to use docker-compose. The docker-compose file is in the Loki repository. You can get the repository using the following command git:$ git clone https:
Then you need to go to the production directory:$ cd production
After that, you can get the latest version of Docker images:$ docker-compose pull
Finally, the Loki stack is launched with the following command:$ docker-compose up
Loki Architecture
Here is a small diagram with the Loki architecture: Principles of the Loki architecture Theweb client launches applications on the server, Promtail collects logs and sends them to Loki, the web client also sends metadata to Loki. Loki aggregates everything and transfers it to Grafana.Loki is up and running. To view the available components, run the following command:
$ docker ps
In the case of a freshly installed Docker, the command should return the following result:IMAGE PORTS NAMES
grafana/promtail: production_promtail_1
grafana/grafana: m 0.0.0.0:3000->3000/tcp production_grafana_1
grafana/loki: late 80/tcp,0.0.0.0:3100... production_loki_1
We see the following components:- Promtail: agent for centralizing logs
- Grafana: A Famous Dashboard Tool
- Loki: a data centralization daemon
Within the framework of a classical infrastructure (for example, based on virtual machines), a Promtail agent must be deployed on each machine. Grafana and Loki can be installed on the same machine.Kubernetes Deployment
Installing Loki components on Kubernetes will be as follows:- daemonSet for deploying Promtail agent on each machine in a server cluster
- Deployment Loki
- and lastly, the deployment of Grafana.
Fortunately, Loki is available as a Helm package, making it easy to deploy.Installation via Helm
Helm should already be installed. It can be downloaded from the project’s GitHub repository. It is installed by unpacking the archive that matches your architecture and adding helm to $PATH.Note: Helm version 3.0.0 was recently released. Since there were a lot of changes in it, the reader is advised to wait a bit before using it first .
Adding a source for Helm
The first step is to add the “loki” repository with the following command:$ helm add loki https:
After that, you can search for packages named “loki”:$ helm search loki
Result:loki/loki 0.17.2 v0.4.0 Loki: like Prometheus, but for logs.
loki/loki-stack 0.19.1 v0.4.0 Loki: like Prometheus, but for logs.
loki/fluent-bit 0.0.2 v0.0.1 Uses fluent-bit Loki go plugin for...
loki/promtail 0.13.1 v0.4.0 Responsible for gathering logs and...
These packages have the following features:- loki / loki package only matches Loki server
- loki / fluent-bit package allows you to deploy DaemonSet using fluent-bin to collect logs instead of Promtail
- package loki / promtail contains a collection agent log files
- The loki / loki-stack package allows you to immediately deploy Loki together with Promtail.
Loki installation
To deploy Loki to Kubernetes, run the following command in the “monitoring” namespace:$ helm upgrade --install loki loki/loki-stack --namespace monitoring
To save to disk, add the option --set loki.persistence.enabled = true:$ helm upgrade --install loki loki/loki-stack \
--namespace monitoring \
--set loki.persistence.enabled=true
Note: if you want to deploy Grafana at the same time, add the parameter--set grafana.enabled = true
When you run this command, you should get the following output:LAST DEPLOYED: Tue Nov 19 15:56:54 2019
NAMESPACE: monitoring
STATUS: DEPLOYED
RESOURCES:
==> v1/ClusterRole
NAME AGE
loki-promtail-clusterrole 189d
…
NOTES:
The Loki stack has been deployed to your cluster. Loki can now be added as a datasource in Grafana.
See <a href="http://docs.grafana.org/features/datasources/loki/">http:
Looking at the status of the hearths in the “monitoring” namespace, we’ll see that everything is expanded:$ kubectl -n monitoring get pods -l release=loki
Result:NAME READY STATUS RESTARTS AGE
loki-0 1/1 Running 0 147m
loki-promtail-9zjvc 1/1 Running 0 3h25m
loki-promtail-f6brf 1/1 Running 0 11h
loki-promtail-hdcj7 1/1 Running 0 3h23m
loki-promtail-jbqhc 1/1 Running 0 11h
loki-promtail-mj642 1/1 Running 0 62m
loki-promtail-nm64g 1/1 Running 0 24m
All pods are running. Now it's time to do some tests!Connect to Grafana
To connect to Grafana under Kubernetes, you need to open a tunnel to its bottom. The following is the command to open port 3000 for Grafana hearth:$ kubectl -n port-forward monitoring svc/loki-grafana 3000:80
Another important point is the need to recover the Grafana administrator password. The password is kept secret loki-grafanain a field .data.admin-userin base64 format.To restore it, you must run the following command:$ kubectl -n monitoring get secret loki-grafana \
--template '{{index .data "admin-password" | base64decode}}'; echo
Use this password with the default administrator account (admin).Defining a Loki data source in Grafana
First of all, make sure the Loki data source (Configuration / Datasource) is created.Here is an example: Example of setting up a data source for LokiBy clicking on “Test” you can check the connection with Loki.
Making requests to Loki
Now go to Grafana's “Explore” section. When receiving logs from containers, Loki adds metadata from Kubernetes. Thus, it becomes possible to view the logs of a specific container.: For example, the following query promtail be used to select the container logs {container_name = "promtail"}.Also, be sure to select your Loki data source here.This request will return the activity of the containers as follows: The result of the request in Grafana
Adding to the dashboard
Starting with Grafana 6.4, you can put information about the logs directly on the dashboard. After that, the user will be able to quickly switch between the number of requests on his site to the application traces.The following is an example of a dashboard that implements this interaction: An example of a dashboard with Prometheus metrics and Loki logs
Future loki
I started using Loki back in May / June with version 0.1. Today version 1 is already released, and even 1.1 and 1.2.Admittedly, version 0.1 was not stable enough. But 0.3 already showed real signs of maturity, and the next versions (0.4, then 1.0) only strengthened this impression.After 1.0.0, no one can have any excuses not to use this wonderful tool.Further improvements should not concern Loki, but rather its integration with the excellent Grafana. In fact, Grafana 6.4 already has good integration with dashboards.Grafana 6.5, which was released recently, further improves this integration by automatically recognizing the contents of logs in JSON format.The following video shows a small example of this mechanism: Using Loki Strings Displayed in GrafanaIt becomes possible to use one of the JSON fields, for example, for:
- external tool links
- filtering log content
For example, you can click on traceId to go to Zipkin or Jaeger.Traditionally, we are waiting for your comments and we invite you to an open webinar where we will talk about how the DevOps industry developed during 2019 and discuss possible development paths for 2020.