HighLoad ++, Mikhail Makurov, Maxim Chernetsov (Intersvyaz): Zabbix, 100kNVPS on one server
The next HighLoad ++ conference will be held on April 6 and 7, 2020 in St. Petersburg. Details and tickets here . HighLoad ++ Moscow 2018. Moscow Hall. November 9, 3 p.m. Abstracts and presentation . * Monitoring - online and analytics.* The main limitations of the ZABBIX platform.* Solution for scaling analytics storage.* ZABBIX server optimization.* UI optimization.* Experience in operating the system with loads of more than 40k NVPS.* Briefly conclusions.Mikhail Makurov (hereinafter - MM): - Hello everyone!Maxim Chernetsov (hereinafter - MCH): - Good afternoon!MM: - Let me introduce Maxim. Max is a talented engineer, the best networker I know. Maxim deals with networks and services, their development and operation.
 MCH: - And I would like to talk about Michael. Michael is a C developer. He wrote some highly loaded traffic processing solutions for our company. We live and work in the Urals, in the city of severe peasants in Chelyabinsk, at Intersvyaz. Our company is a provider of Internet and cable television services for one million people in 16 cities.MM:- And it is worth saying that Intersvyaz is much more than just a provider, it is an IT company. Most of our decisions are made by our IT department.A: from servers that process traffic, to the call center and mobile application. There are about 80 people in the IT department with very, very diverse competencies.
About Zabbix and its architecture
MCH: - And now I’ll try to set a personal record and say in one minute what Zabbix is (hereinafter - “Zabbiks”).Zabbix positions itself as a monitoring system “out of the box” at the enterprise level. It has many life-simplifying features: advanced escalation rules, APIs for integration, grouping and auto-detection of hosts and metrics. In Zabbix there are so-called scaling tools - proxies. Zabbix is an open source system.Briefly about architecture. We can say that it consists of three components: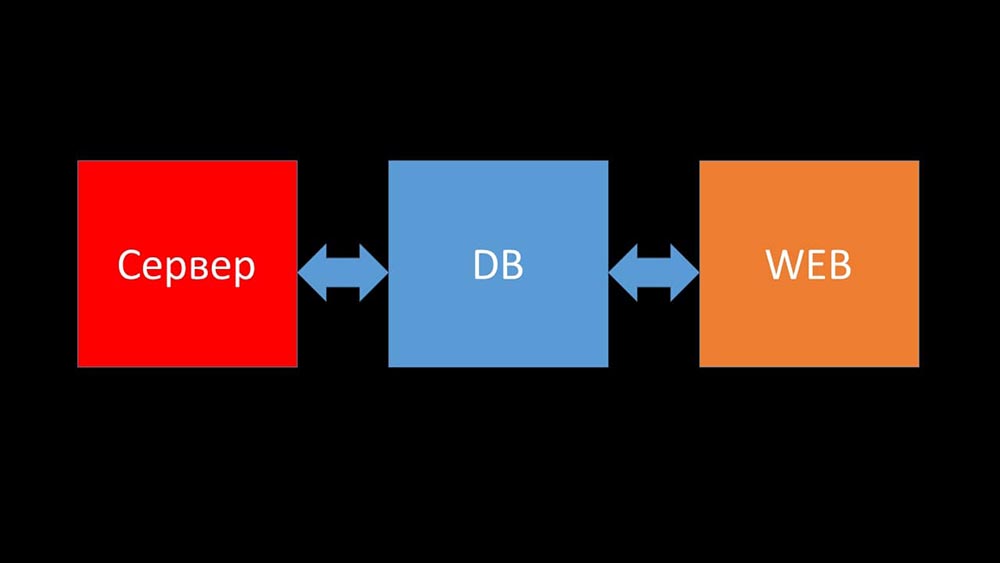
- Server. It is written in C. With rather complicated processing and transmission of information between streams. All processing takes place in it: from receiving to saving to the database.
- All data is stored in the database. Zabbix supports MySQL, PostreSQL, and Oracle.
- The web interface is written in PHP. On most systems, it comes with an Apache server, but works more efficiently in the nginx + php bundle.
Today we would like to tell from the life of our company one story related to Zabbix ...Life story of Intersvyaz company. What do we have and what is needed?
 5 or 6 months ago. Once after work ...MCH: - Misha, hello! Glad I managed to catch you - there is a conversation. We again had problems with monitoring. During a major accident, everything slowed down, and there was no information about the status of the network. Unfortunately, this is not the first time repeated. I need your help. Let's make our monitoring work under any circumstances!MM: - But let's synchronize first. I have not looked there for a couple of years. As far as I remember, we refused Nagios and switched to Zabbix 8 years ago. And now we seem to have 6 powerful servers and about a dozen proxies. Am I confusing anything?MCH:- Nearly. 15 servers, some of which are virtual machines. Most importantly, this does not save us at the moment when we need it most. Like an accident - the servers are slowing down and nothing is visible. We tried to optimize the configuration, but this does not give the optimal performance gain.MM: - I see. Did you look something, did you dig something from the diagnosis?MCH:- The first thing you have to deal with is just the database. MySQL is so constantly loaded, preserving new metrics, and when Zabbix starts generating a bunch of events, the database goes into itself literally for several hours. I already told you about the configuration optimization, but literally this year we updated the hardware: there are more than a hundred gigabytes of memory on the servers and disk arrays on SSD RAID-ahs - it makes no sense to grow it linearly far. What do we do?MM: - I see. In general, MySQL is an LTP database. Apparently, it is no longer suitable for storing an archive of metrics of our size. Let's figure it out.MCH: - Come on!
Zabbix and Clickhouse integration as a result of hackathon
After some time, we received interesting data: Most of the space in our database was occupied by the archive of metrics and less than 1% was used for configuration, templates and settings. By that time, for more than a year now we had been operating the Big data solution based on Clickhouse. The direction of movement was obvious to us. At our spring Hackathon, he wrote the integration of Zabbix with Clickhouse for the server and frontend. At that time, Zabbix already had support for ElasticSearch, and we decided to compare them.
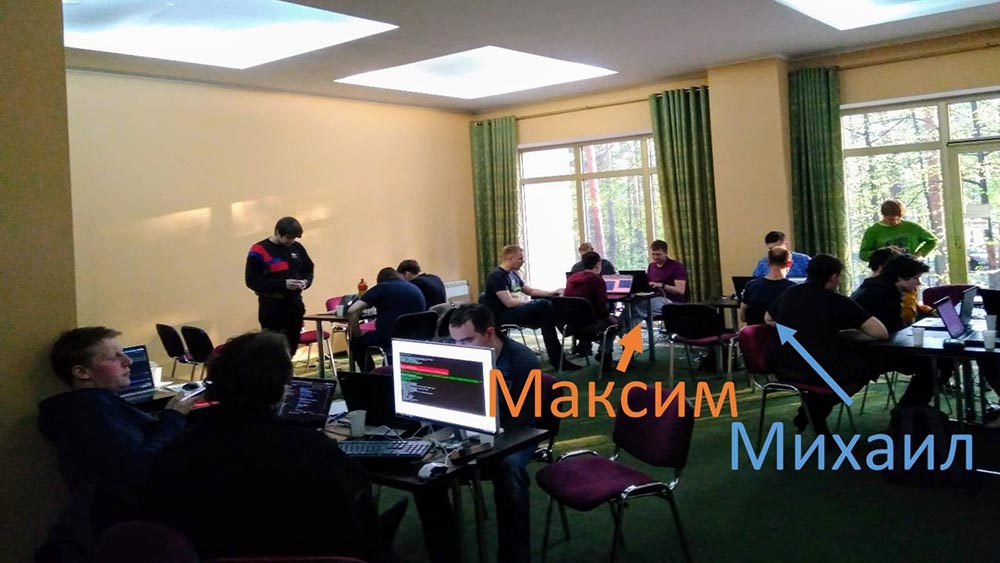
Compare Clickhouse and Elasticsearch
MM: - For comparison, we generated the same load that the Zabbix server provides and looked at how the systems would behave. We wrote data in batches of 1000 lines, used CURL. We previously suggested that the Clickhouse would be more effective for the load profile that Zabbix does. The results even exceeded our expectations: Under the same test conditions, the Clickhouse wrote three times as much data. At the same time, both systems consumed very efficiently (a small amount of resources) while reading data. But “Elastix” required a large amount of processor when recording:In total, Clickhouse significantly exceeded Elastix in processor consumption and speed. At the same time, due to data compression, “Clickhouse” uses 11 times less on the hard disk and does about 30 times less disk operations:
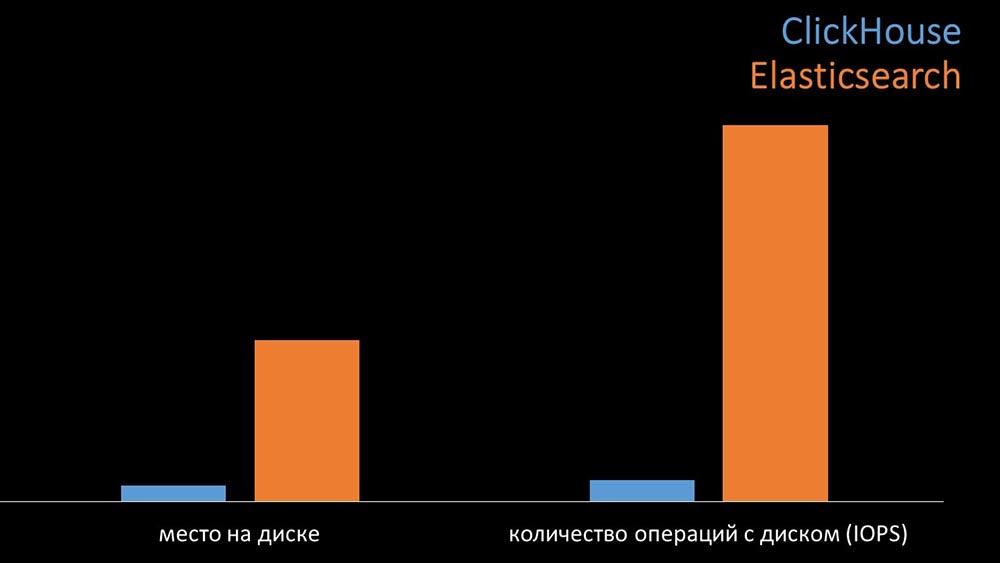 MCH: - Yes, working with the disk subsystem at “Clickhouse” is very effective. Under the bases, you can use huge SATA disks and get a write speed of hundreds of thousands of lines per second. The system "out of the box" supports sharding, replication, it is very easy to configure. We are more than happy with its operation for a year.To optimize resources, you can install "Clickhouse" next to the existing main base and thereby save a lot of processor time and disk operations. We took out the archive of metrics to the existing “Clickhouse” clusters:
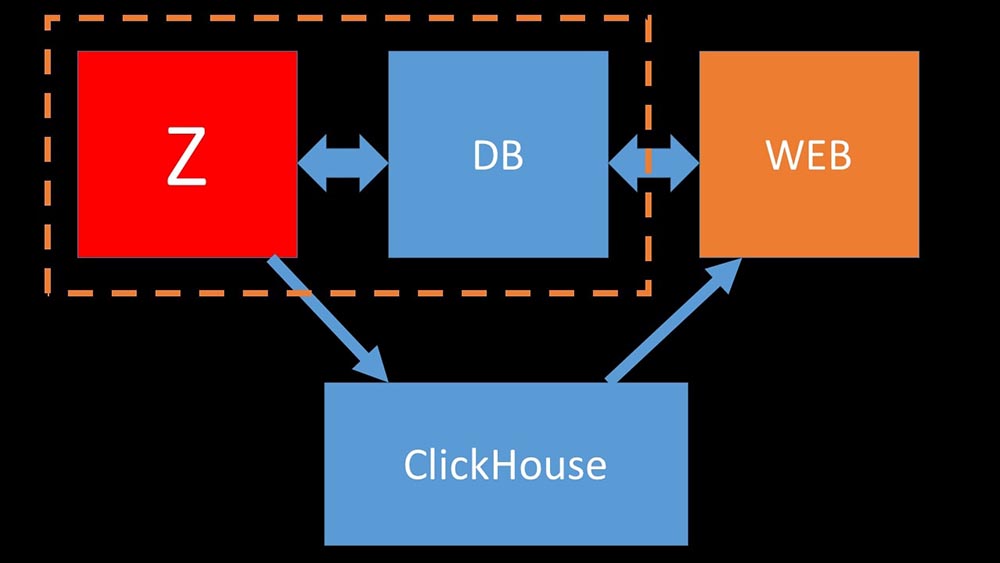 We unloaded the main MySQL database so much that we could combine it on the same machine with the Zabbix server and abandon the dedicated server for MySQL.
How does polling work in Zabbix?
4 months agoMM: - Well, you can forget about the problems with the base?MCH: - That's for sure! Another problem we need to solve is slow data collection. Now all of our 15 proxies are overloaded with SNMP and polling processes. And there are none other than setting up new and new servers.MM: - Great. But first tell me how polling works in Zabbix.MCH: - In short, there are 20 types of metrics and a dozen ways to obtain them. Zabbix can collect data either in the "request-response" mode, or expect new data through the "Trapper Interface". It is worth noting that in the original Zabbix this method (Trapper) is the fastest.There are proxies for load balancing:
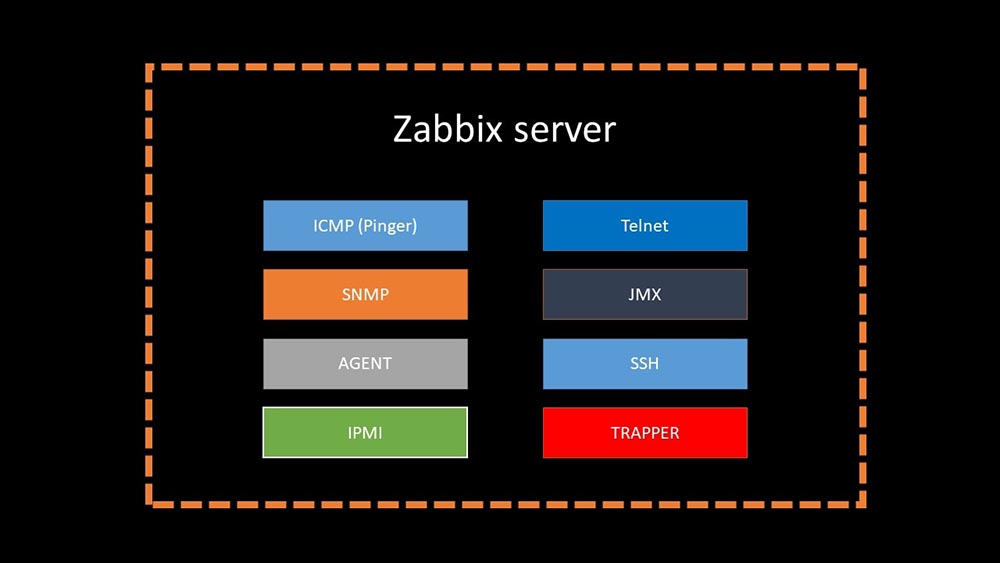 Proxies can perform the same collection functions as the Zabbix server, receiving tasks from it and sending collected metrics through the Trapper interface. This is the officially recommended load balancing method. Also, proxies are useful for monitoring a remote infrastructure that works through NAT or a slow channel:
 MM: - Everything is clear with the architecture. We must look at the source ...A couple of days later
Tale of how nmap fping won
MM: - It seems that I dug up something.MCH: - Tell me!MM: - I found that during availability checks, Zabbix does a check of up to 128 hosts at a time. I tried to increase this figure to 500 and removed the inter-packet interval in their ping (ping) - this increased the performance by a factor of two. But I would like big numbers.MCH: - In my practice, I sometimes have to check the availability of thousands of hosts, and I haven’t seen anything faster than nmap. I am sure this is the fastest way. Let's try it! You need to significantly increase the number of hosts in one iteration.MM: - Check more than five hundred? 600?MCH: - At least a couple of thousand.MM:- Okay. The most important thing I wanted to say: I found that most of the polling in Zabbix was done synchronously. We must redo it asynchronously. Then we can dramatically increase the number of metrics collected by the pollers, especially if we increase the number of metrics in one iteration.MCH: - Great! And when?MM: - As usual, yesterday.MCH: - We compared both versions of fping and nmap: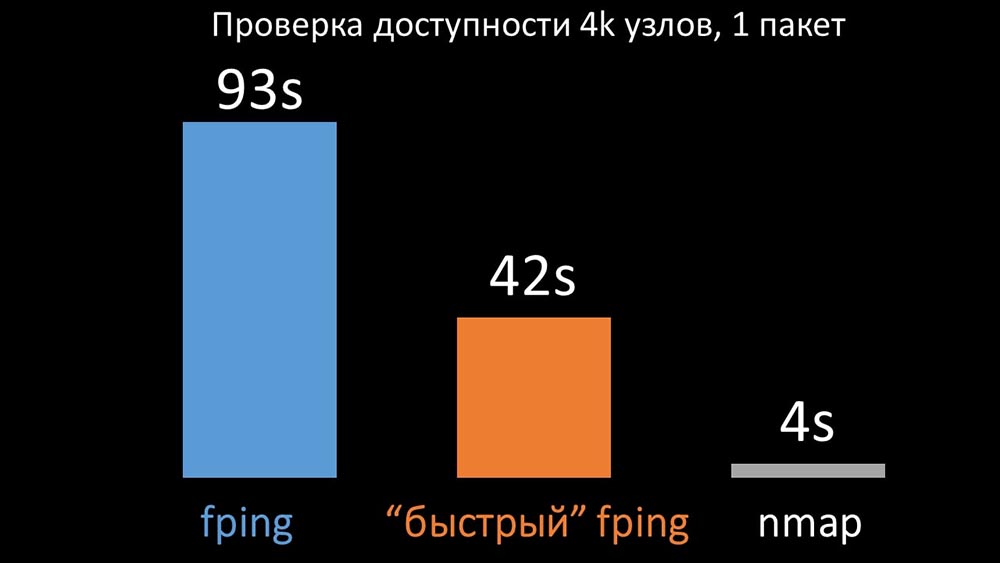 On a large number of hosts, nmap was expected to be up to five times more efficient. Since nmap only checks for the fact of availability and response time, we transferred the loss calculation to triggers and significantly reduced the availability check intervals. We found the optimal number of hosts for nmap in the region of 4 thousand per iteration. Nmap allowed us to reduce the CPU costs for availability checks by three times and reduce the interval from 120 seconds to 10.
Polling optimization
MM: - Then we went in for pollers. We were mainly interested in SNMP removal and agents. In Zabbix, polling was done synchronously and special measures were taken in order to increase the efficiency of the system. In synchronous mode, host unavailability causes significant polling degradation. There is a whole system of states, there are special processes - the so-called unreachable-pollers, which work only with inaccessible hosts: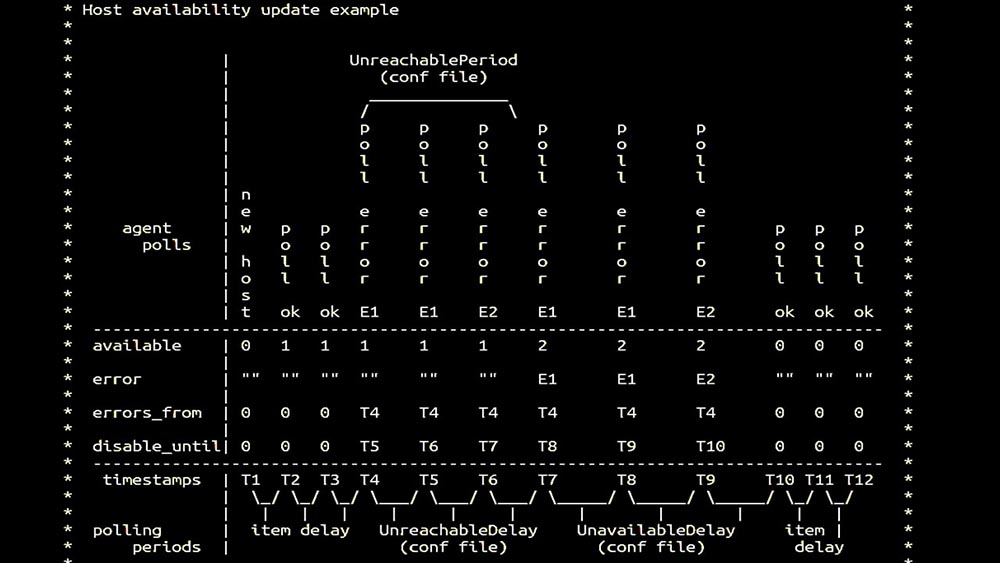 This is a commentary that demonstrates the state matrix, the complexity of the transition system that is required in order for the system to remain effective. In addition, synchronous polling itself is rather slow:
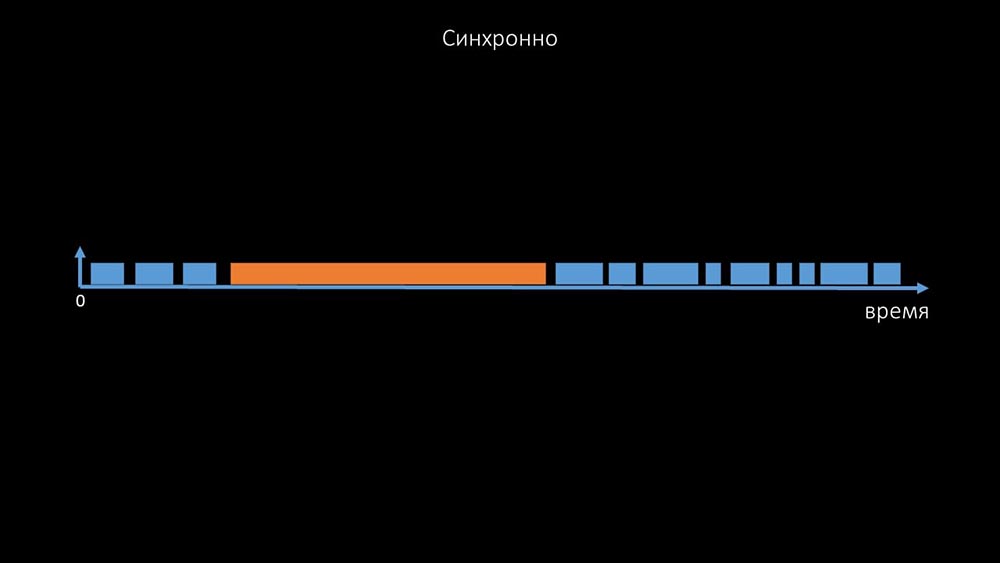 That is why thousands of poller threads on a dozen proxies could not collect the necessary amount of data for us. The asynchronous implementation solved not only the problems with the number of threads, but also significantly simplified the state system of inaccessible hosts, because for any number checked in one iteration of polling, the maximum wait time was 1 timeout: In
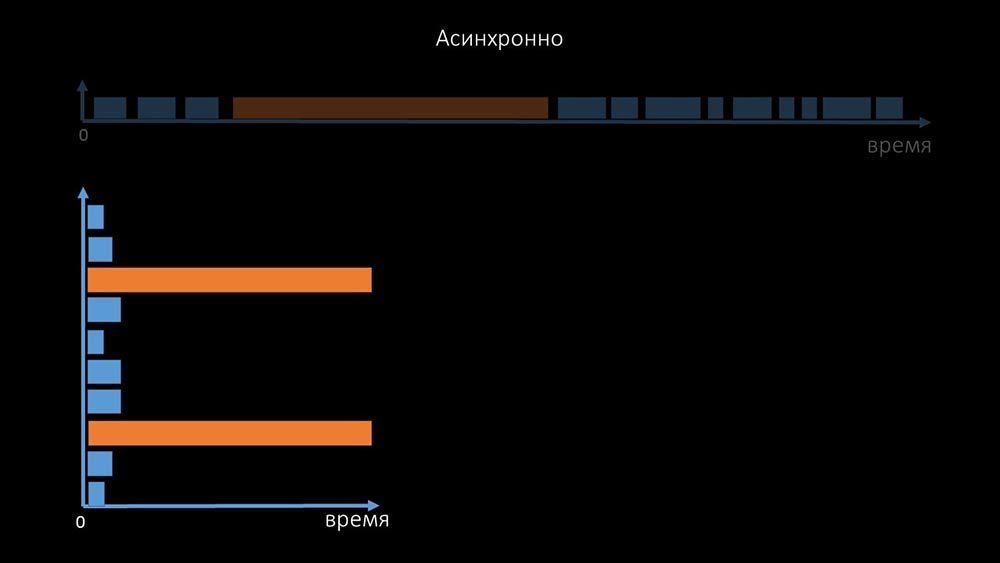 addition, we modified and improved the polling system for SNMP- queries. The fact is that most cannot respond to multiple SNMP requests at the same time. Therefore, we made a hybrid mode when SNMP polling of the same host does asynchronously:
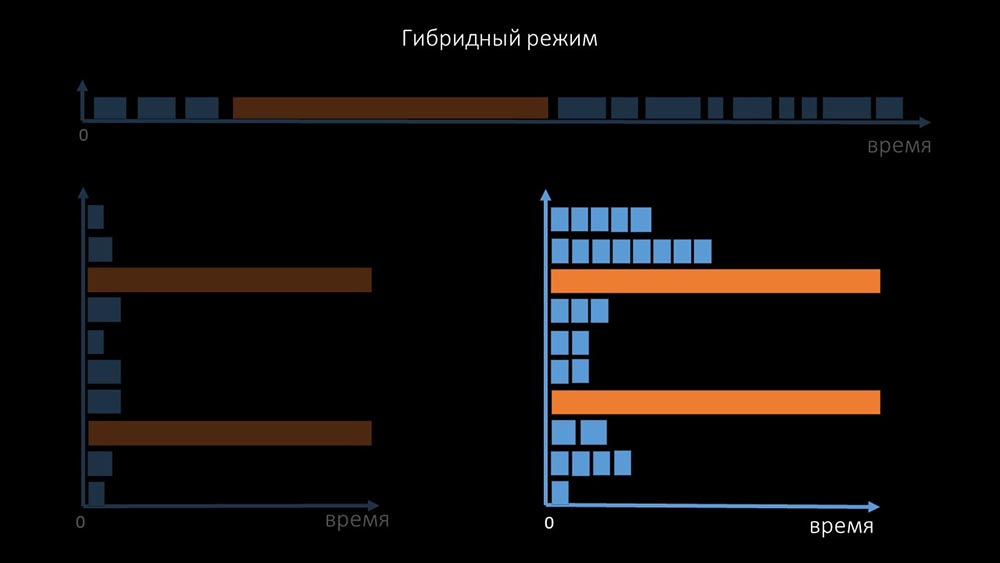 This is done for the entire host bundle. This mode in the end is not slower than completely asynchronous, since polling one and a half hundred SNMP values is still much faster than 1 timeout.Our experiments showed that the optimal number of requests in one iteration is about 8 thousand with SNMP polling. In total, the transition to asynchronous mode allowed to accelerate polling performance by 200 times, several hundred times.MCH: - The obtained polling optimizations showed that we can not only get rid of all proxies, but also reduce the intervals for many checks, and proxies will not be needed as a way to share the load.About three months ago
Change the architecture - increase the load!
MM: - Well, Max, is it time to be productive? I need a powerful server and a good engineer.MCH: - Well, we plan. It's time to get off the ground at 5,000 metrics per second.Morning after theMCH upgrade : - Misha, we updated, but rolled back in the morning ... Guess what speed you achieved?MM: - Thousand 20 maximum.MCH: - Yeah, 25! Unfortunately, we are where we started.MM: - And so? Did you get any diagnostics?MCH: - Yes, of course! Here, for example, an interesting top: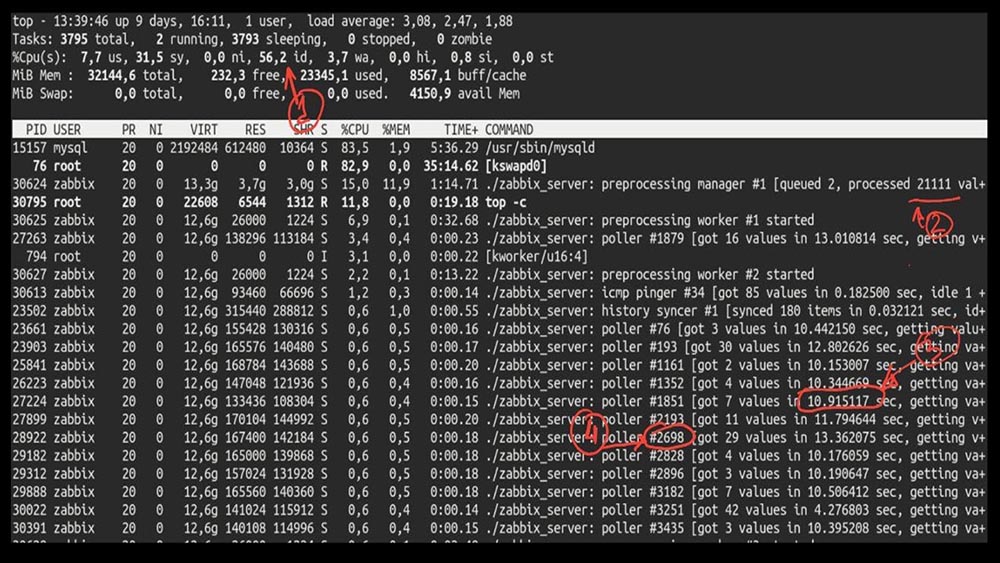 MM: - Let's see. I see that we tried a huge number of polling threads:
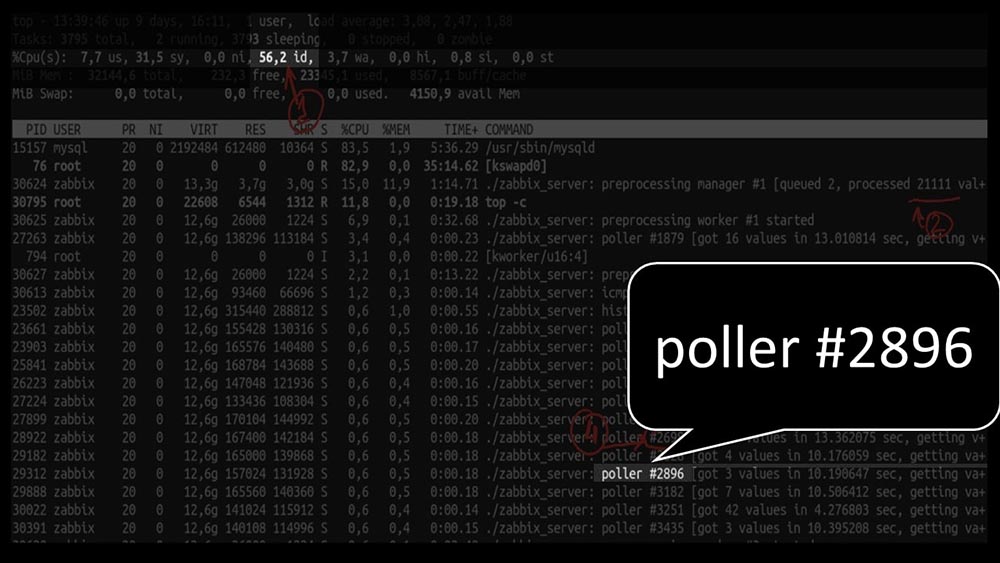 But at the same time we were not able to utilize the system even halfway:
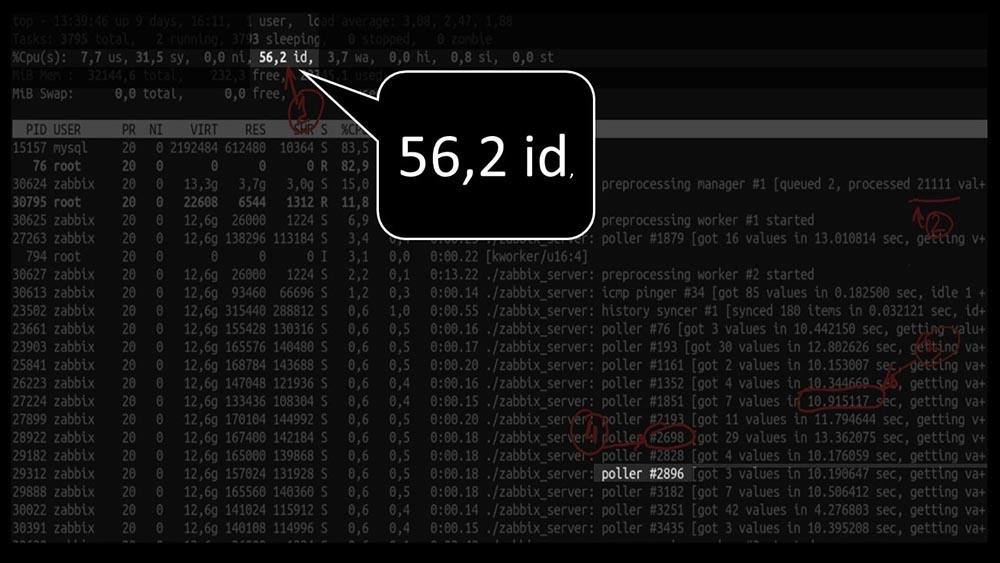 And the overall performance is quite small, about 4 thousand metrics per second:
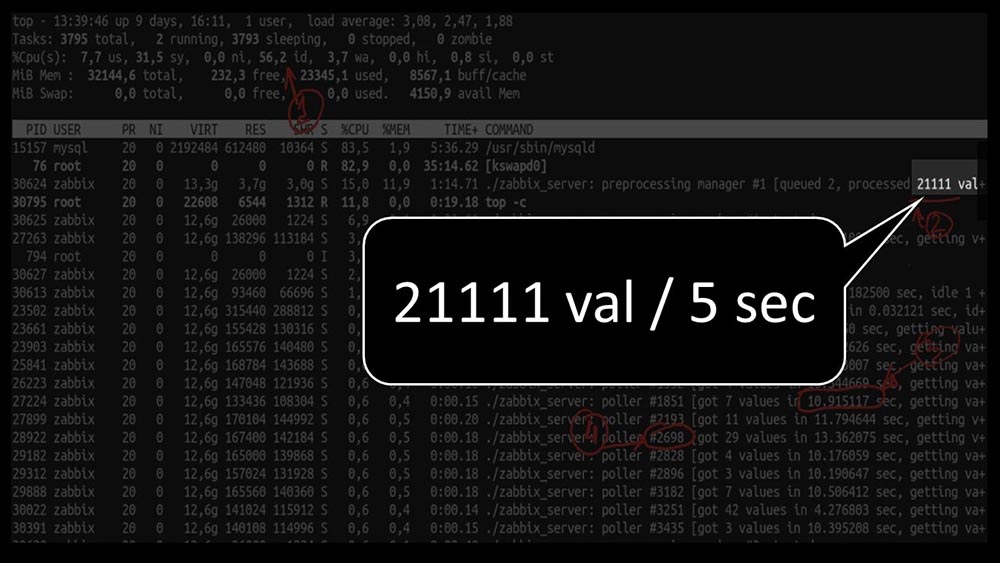 Is there anything else?MCH: - Yes, strace of one of the pollers:
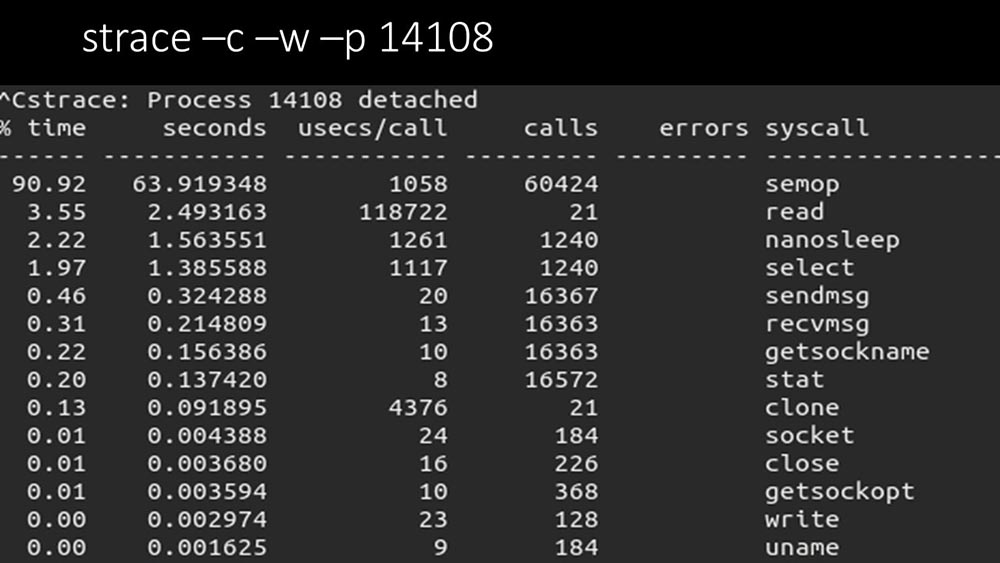 MM: - It is clearly seen here that the polling process is waiting for the "semaphores". These are locks:
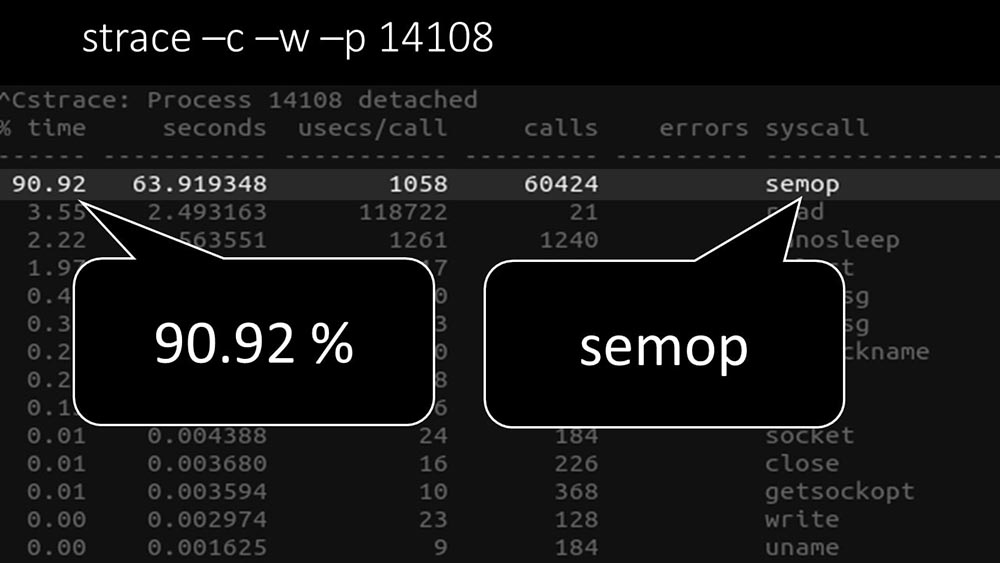 MCH: - It is not clear.MM: - Look, this is like a situation where a bunch of threads are trying to work with resources that only one can work with at a time. Then all they can do is share this resource by time:
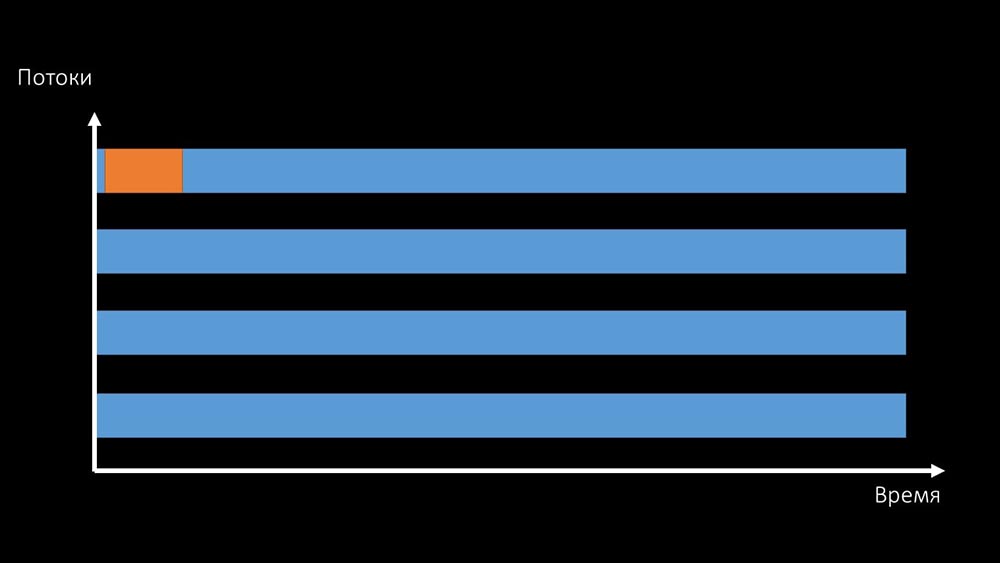 And the total productivity of working with such a resource is limited by the speed of one core: There
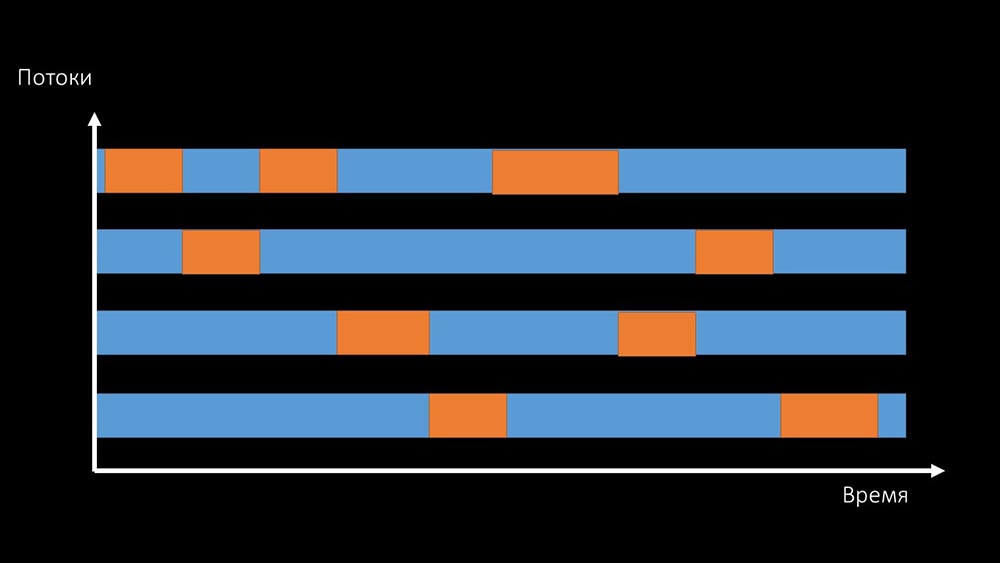 are two ways to solve this problem.Upgrade machine iron, switch to faster kernels:
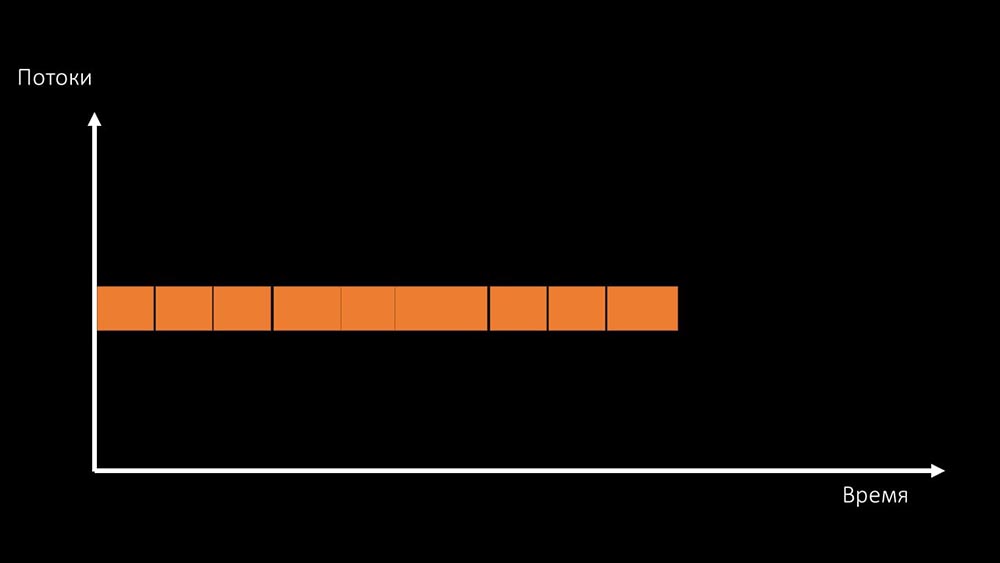 Or change the architecture and , at the same time , the load:
 MCH: - By the way, we’ll use fewer cores on a test machine than on a combat one, but they’ll be 1.5 times faster in frequency per core!MM: - Is that clear? It is necessary to look at the server code.
Data Path in Zabbix Server
MCH: - To understand, we began to analyze how the data is transmitted inside the Zabbix server: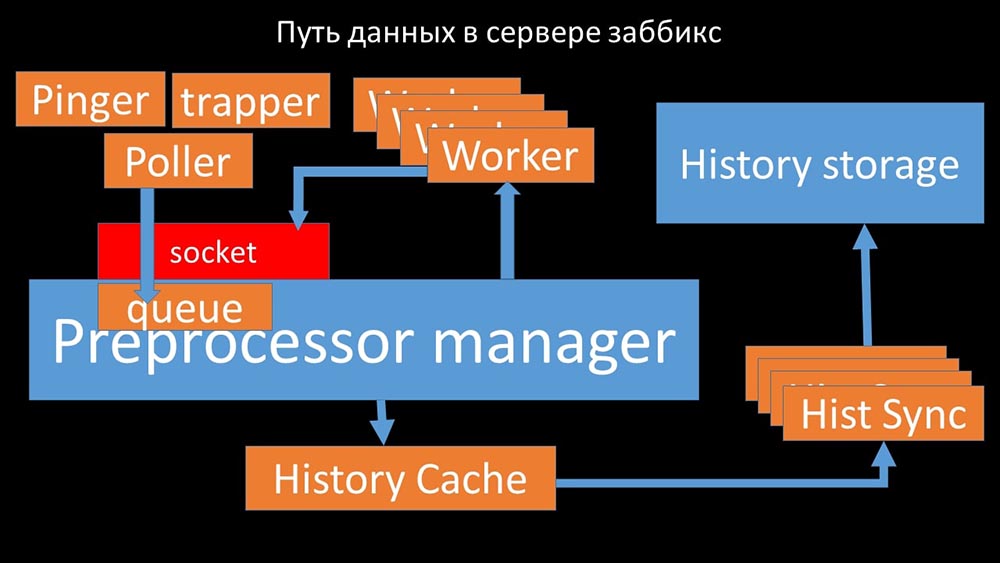 Cool picture, right? Let's go through it step by step to more or less clarify. There are streams and services responsible for collecting data:
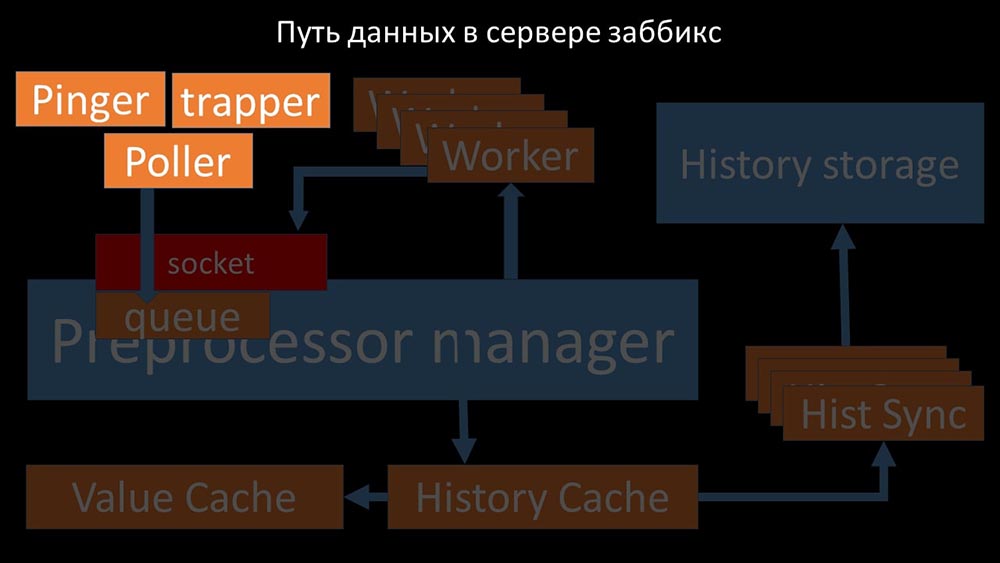 They transfer the collected metrics through the socket to the Preprocessor manager, where they are queued:
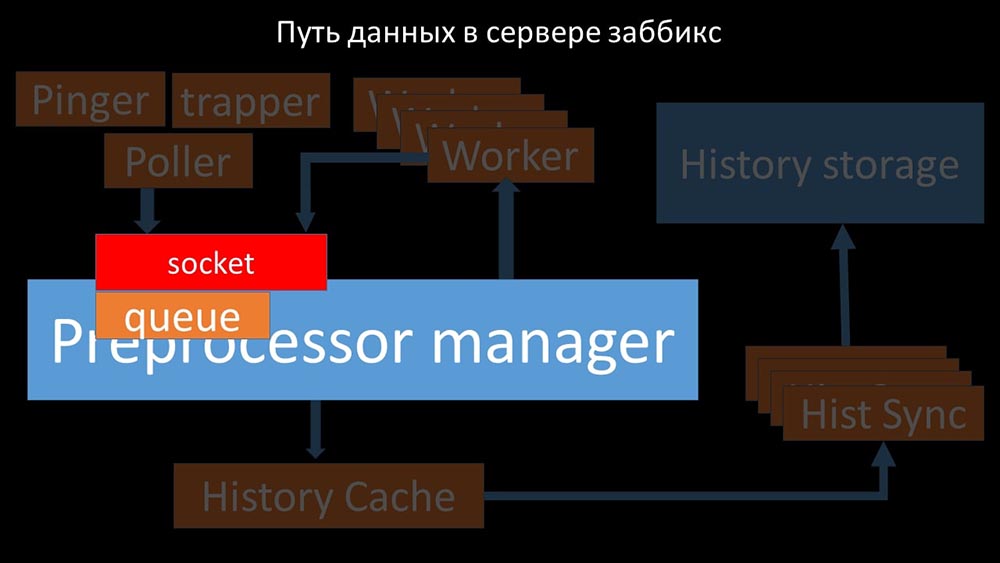 Preprocessor-manager ”transfers data to its workers who execute the preprocessing instructions and return them back through the same socket:
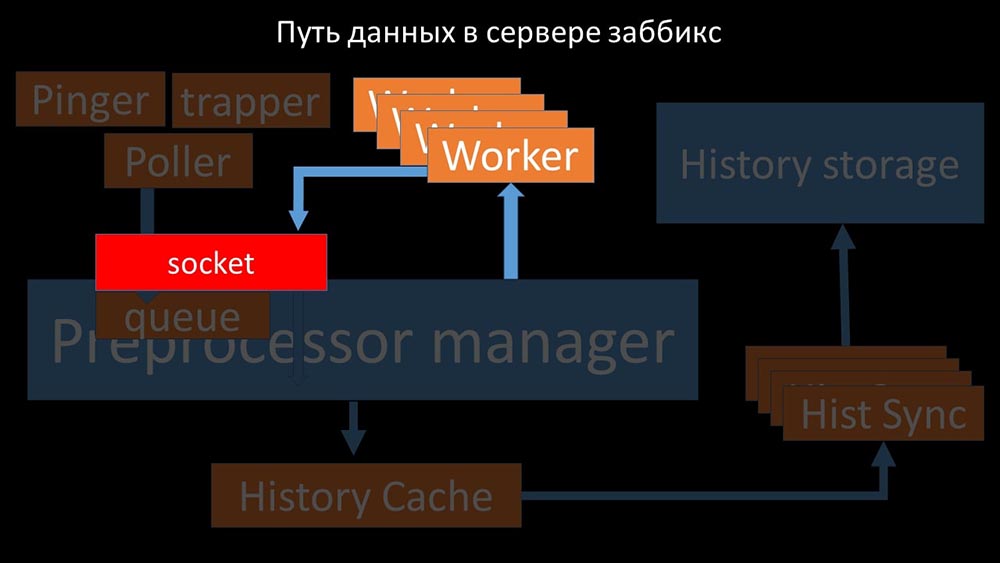 After that, the preprocessor -manager saves them in the history cache:
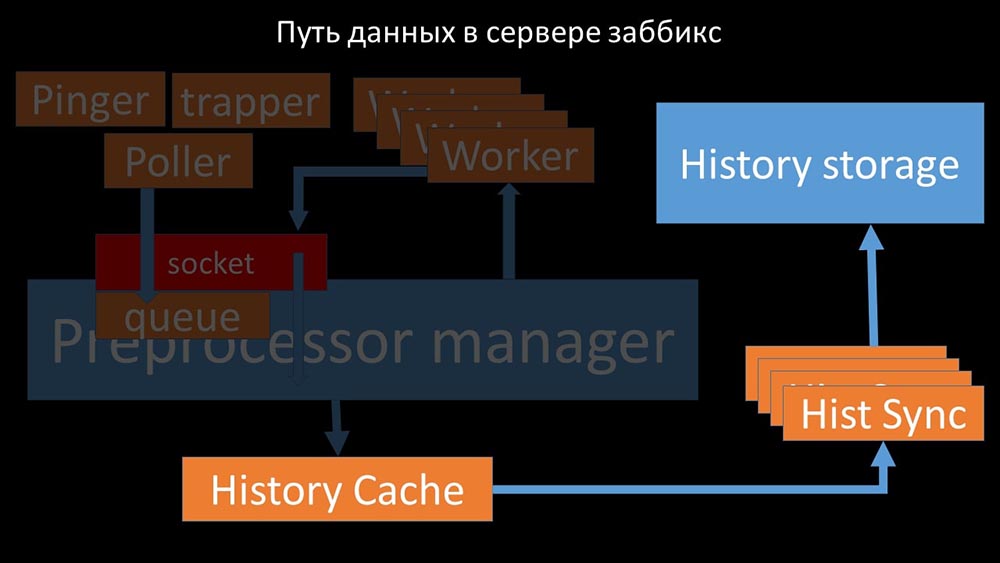 From there, they are taken by historical syncers that perform quite a lot of functions: for example, calculating triggers, filling the value cache and, most importantly, saving metrics in the history store. In general, the process is complex and very confusing.
 MM: - The first thing we saw is that most threads compete for the so-called “configuration cache” (a memory area where all server configurations are stored). Especially a lot of locks are made by the streams responsible for data collection:
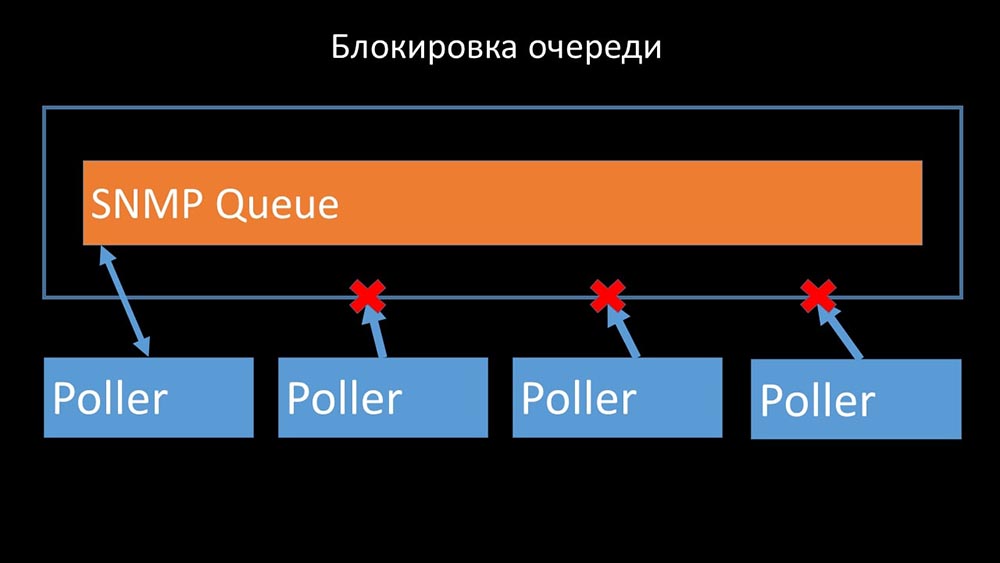
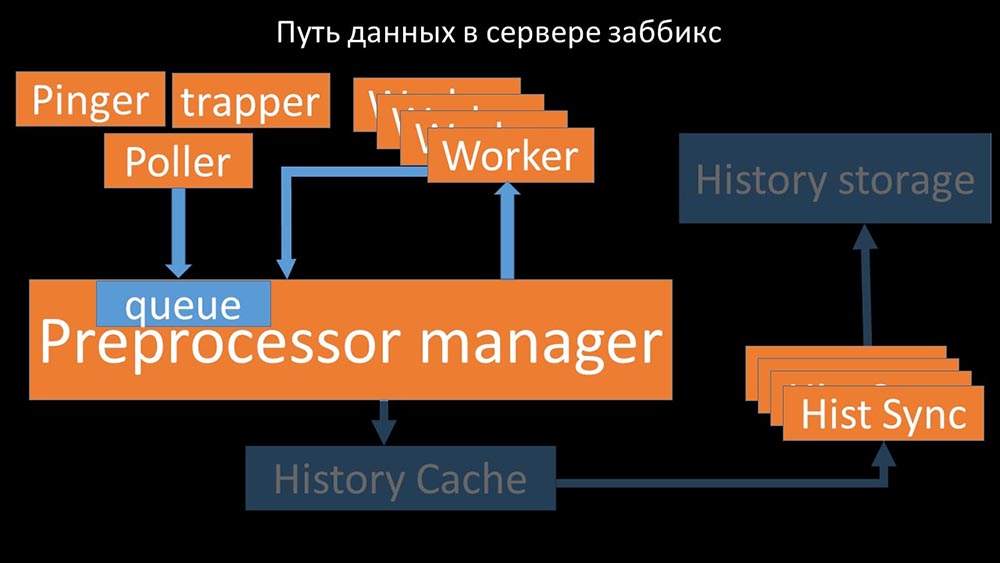 ... since the configuration stores not only metrics with their parameters, but also queues, from which the pollers take information on what to do next. When there are a lot of pollers, and one blocks the configuration, the rest are waiting for requests:
Pollers must not conflict
 Therefore, the first thing we did was divide the queue into 4 parts and allow the pollers to safely block these queues, these parts at the same time:
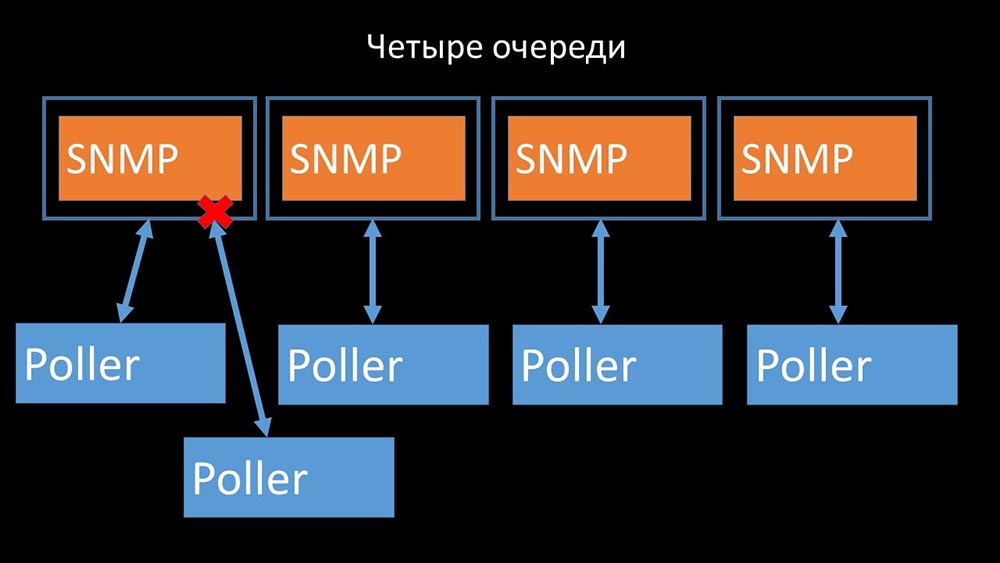 This removed competition for the configuration cache, and the speed of the pollers increased significantly. But then we were faced with the fact that the preprocessor manager began to accumulate a job queue:
Preprocessor manager should be able to prioritize
This happened when he lacked productivity. Then all he could do was to accumulate requests from the data collection processes and add their buffer until he eats up all the memory and crashes: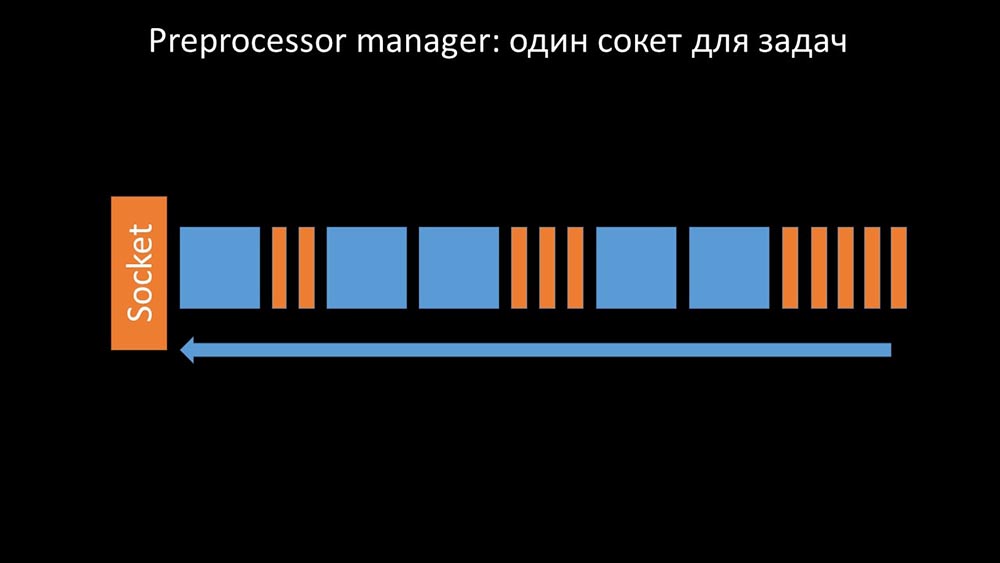 To solve this problem, we added a second socket, which was allocated specifically for workers:
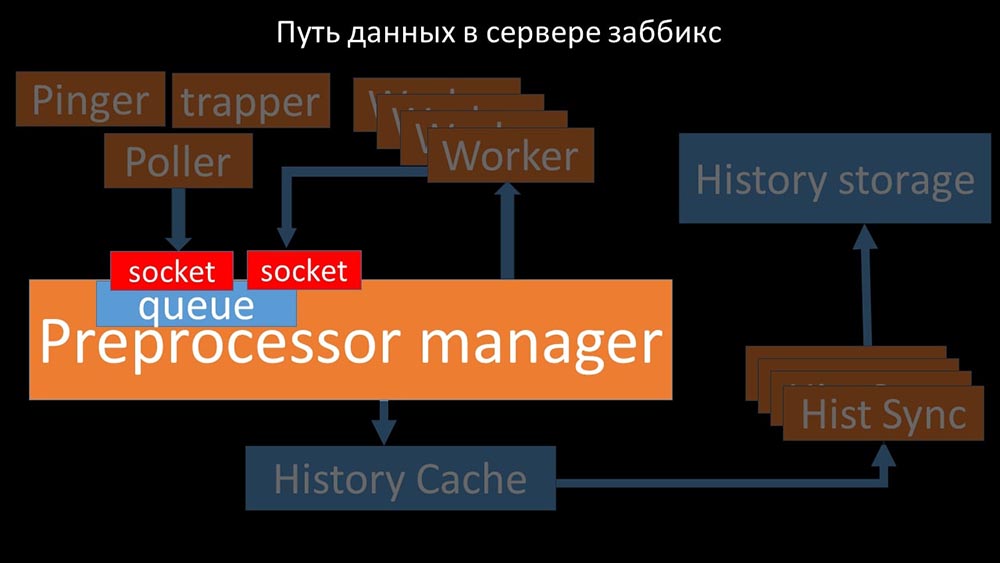 Thus , the preprocessor-manager got the opportunity to prioritize his work and in case the buffer grows, the task is to slow down the eat, giving workers the opportunity to pick up this buffer:
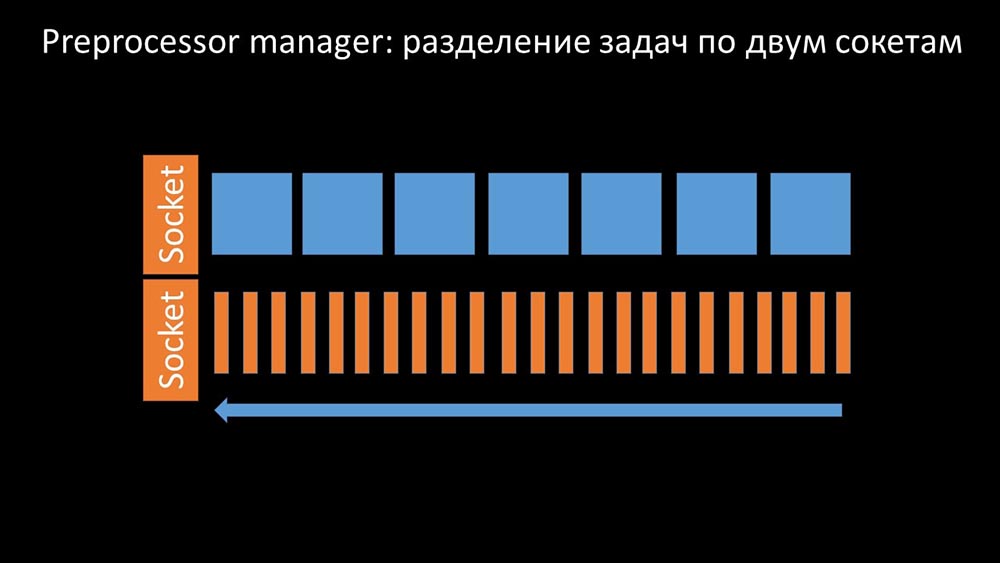 Then we found that one of the reasons for the slowdown was because the workers themselves were competing for vital resource for their work. We registered this problem with a bug-fix, and in the new versions of Zabbix it has already been solved:
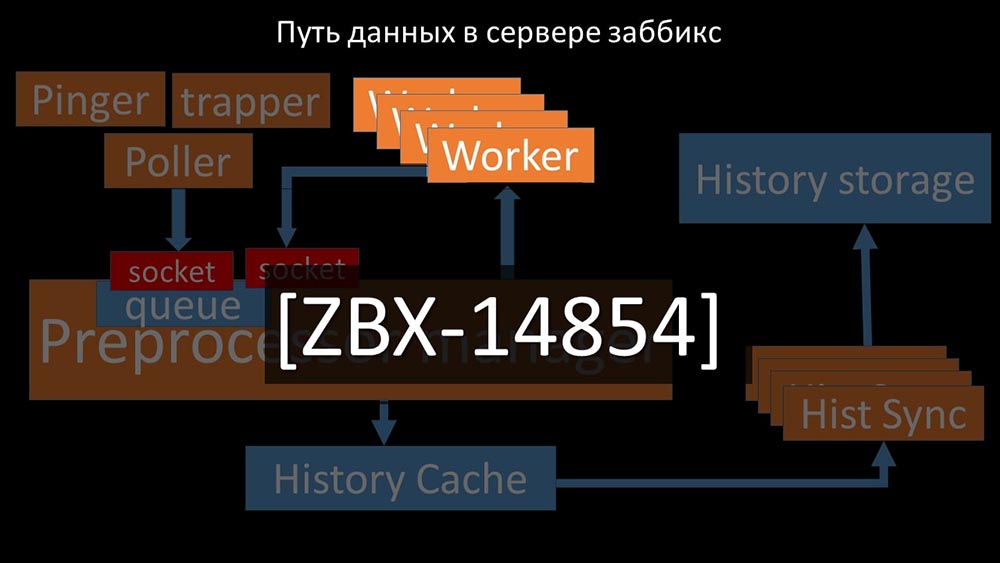
We increase the number of sockets - we get the result
Further, the preprocessor manager itself became a narrow link, since it is a single thread. It rested on the speed of the core, giving a maximum speed of about 70 thousand metrics per second: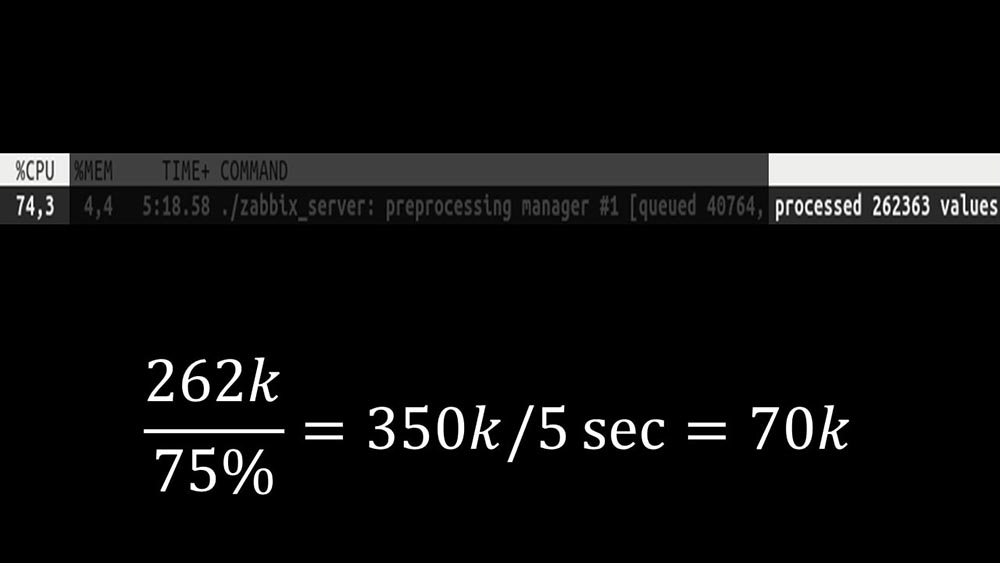 Therefore, we made four, with four sets of sockets, workers:
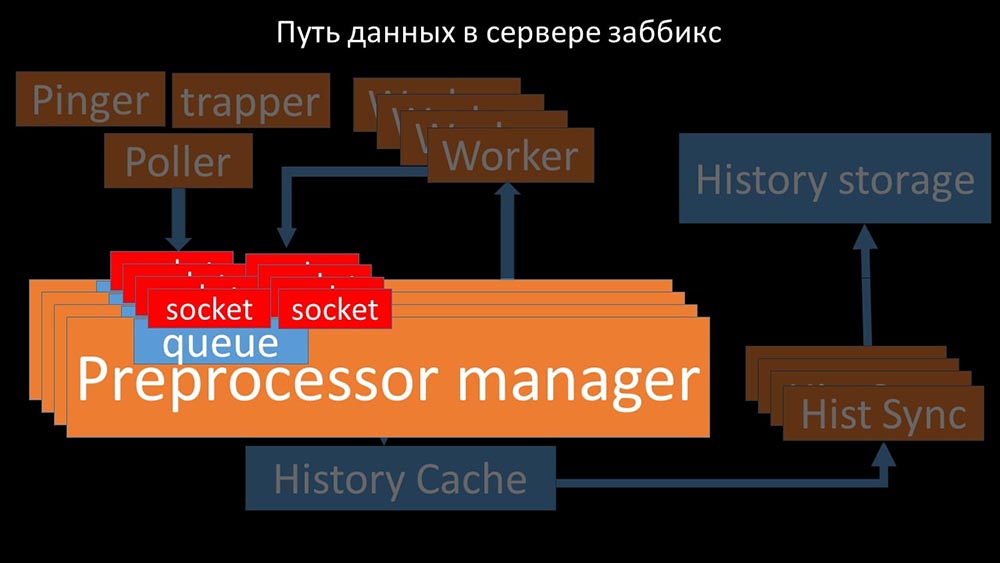 And this allowed us to increase the speed to about 130 thousand metrics: The
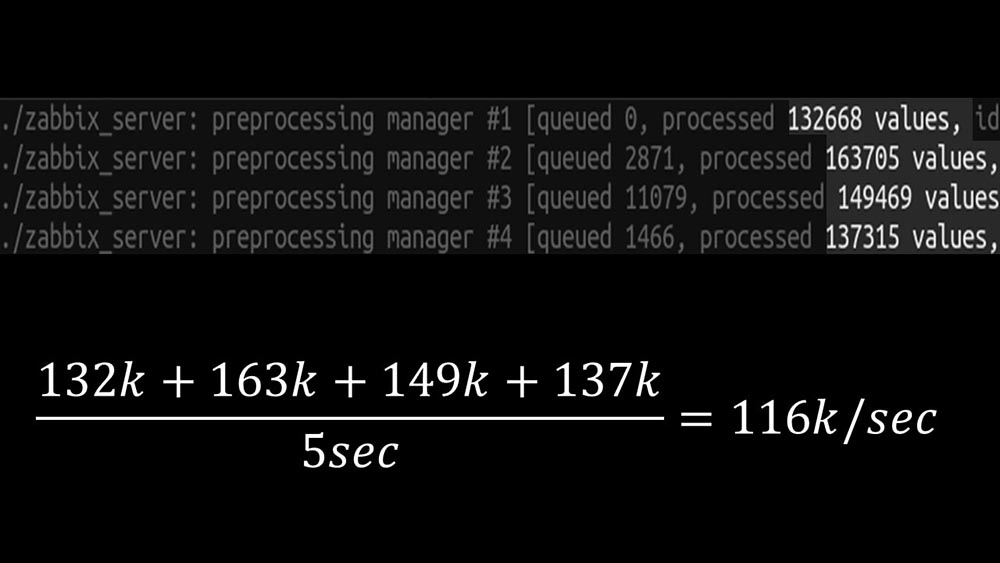 nonlinearity of growth is explained by the fact that there was competition for the cache stories. For him, 4 preprocessor managers and historical synkers competed. At this point, we received about 130 thousand metrics per second on the test machine, utilizing it by about 95% on the processor:
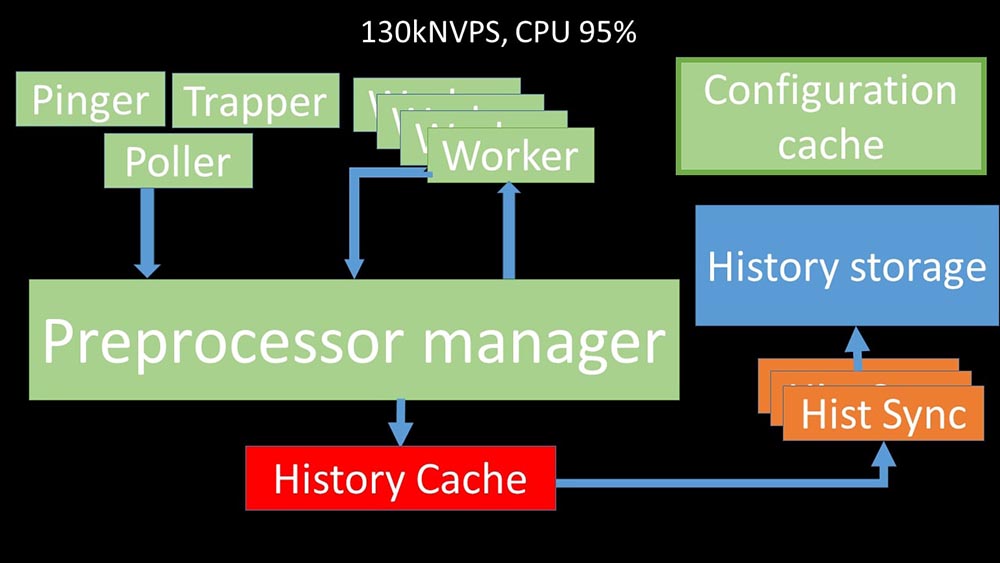 About 2.5 months ago
Refusal of snmp-community increased NVPs by one and a half times
MM: - Max, I need a new test machine! We no longer fit into the current one.MCH: - And what is now?MM: - Now - 130k NVPs and a “shelf” processor.MCH: - Wow! Cool! Wait, I have two questions. According to my calculations, our need is in the region of 15-20 thousand metrics per second. Why do we need more?MM: - I want to finish the job to the end. I want to see how much we can squeeze out of this system.MCH: - But ...MM: - But it is useless for business.MCH: - I see. And the second question: what we have now, can we support ourselves, without the help of a developer?MM:- I do not think. Changing the configuration cache is a problem. It deals with changes in most threads and is difficult to maintain. Most likely, supporting her will be very difficult.MCH: - Then you need some kind of alternative.MM: - There is such an option. We can switch to fast cores, while abandoning the new locking system. We still get the performance of 60-80 thousand metrics. In this case, we can leave the rest of the code. Clickhouse, asynchronous polling will work. And it will be easy to maintain.MCH: - Great! I propose to dwell on this.After optimizing the server side, we were finally able to run the new code into the productive. We abandoned part of the changes in favor of switching to a machine with fast kernels and minimizing the number of changes in the code. We also simplified the configuration and, if possible, abandoned the macros in the data elements, since they are the source of additional locks. For example, the rejection of the snmp-community macro, which is often found in documentation and examples, in our case allowed us to additionally speed up NVPs by about 1.5 times.After two days in production
Remove incident history pop-ups
MCH: - Misha, we use the system for two days, and everything works. But only when everything works! We had planned work with the transfer of a sufficiently large segment of the network, and again with our hands we checked that it had risen, that it hadn’t.MM: - It cannot be! We checked everything 10 times. The server processes even complete network inaccessibility instantly.MCH: - Yes, I understand everything: server, database, top, austat, logs - everything is fast ... But we look at the web interface, and there we have the processor "in the shelf" on the server and this: MM: - I see. Let's watch the web. We found that in a situation where there were a large number of active incidents, most operational widgets began to work very slowly:
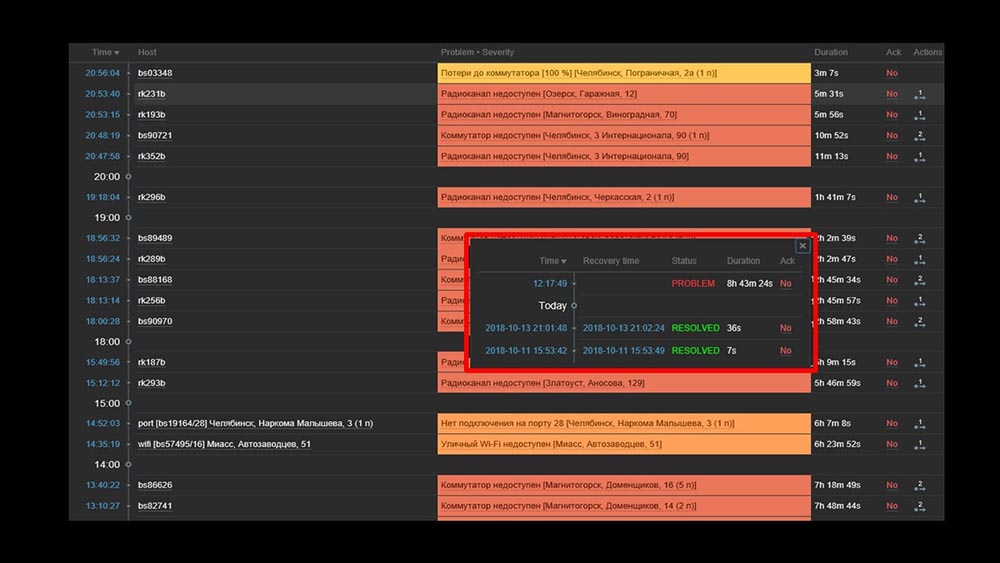 The reason for this was the generation of pop-ups with a history of incidents that are generated for each item in the list. Therefore, we refused to generate these windows (commented out 5 lines in the code), and this solved our problems.The widget loading time, even when completely inaccessible, was reduced from a few minutes to the acceptable for us 10-15 seconds, and the history can still be viewed by clicking on the time:
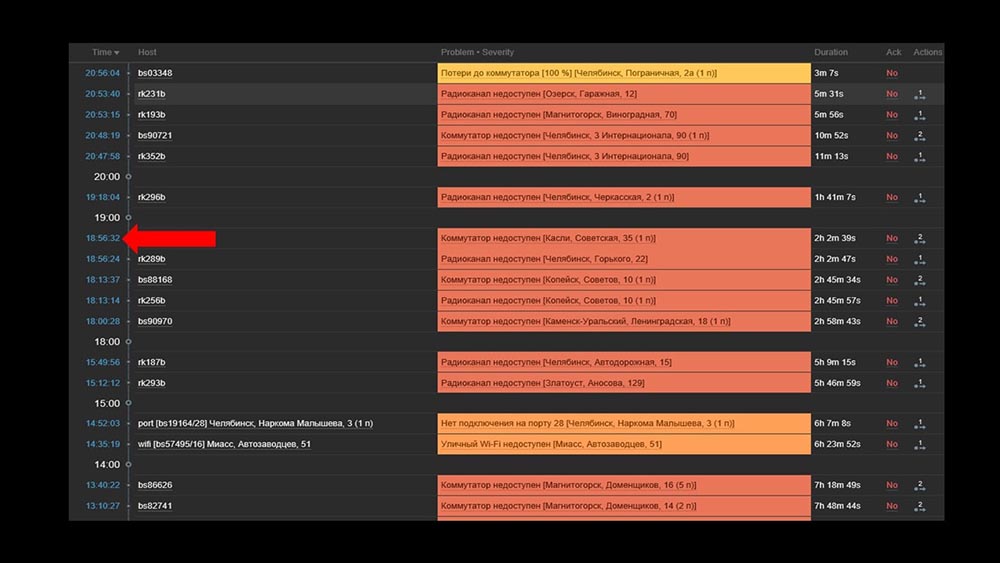 After work. 2 months agoMCH: - Misha, are you leaving? We have to talk.MM: - Not going to. Again something with Zabbix?MCH: - Oh no, relax! I just wanted to say: everything works, thanks! Beer with me.
Zabbix is effective
Zabbix is a fairly versatile and rich system and function. It can be used for small installations out of the box, but with the growth of needs it has to be optimized. To store a large archive of metrics, use the appropriate storage:- You can use the built-in tools in the form of integration with Elastixerch or uploading the history to text files (available from the fourth version);
- You can take advantage of our experience and integration with Clickhouse.
To drastically increase the speed of collecting metrics, collect them asynchronously and transfer them through the trapper interface to the Zabbix server; or you can use the patch for asynchronous pollers of Zabbix itself.Zabbix is written in C and is quite effective. The solution of several narrow architectural places allows us to further increase its productivity and, in our experience, to receive more than 100 thousand metrics on a single-processor machine.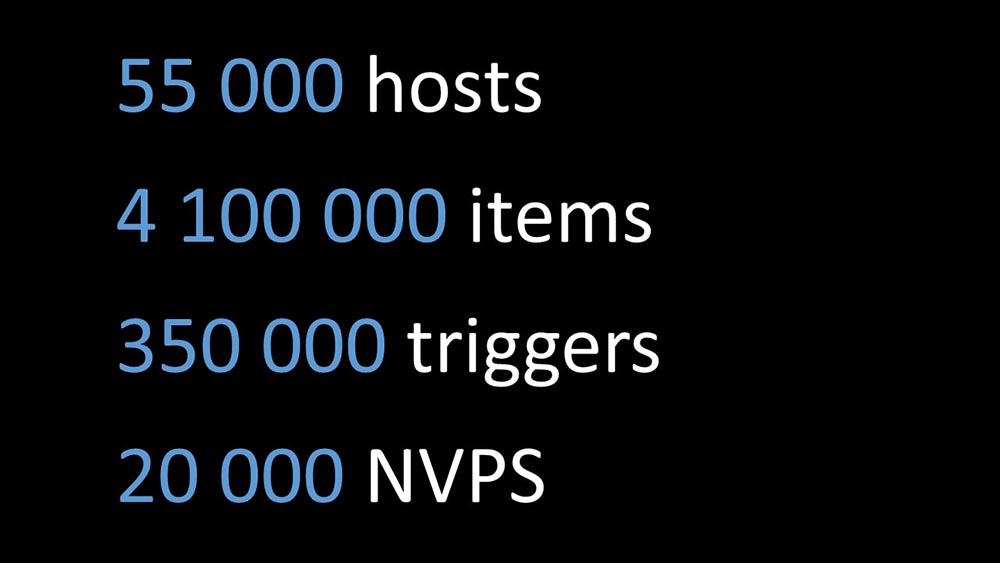
The same Zabbix patch
MM: - I want to add a couple of points. The entire current report, all tests, numbers are given for the configuration that is used with us. We are now taking about 20 thousand metrics per second from it. If you are trying to understand if this will work for you - you can compare. What they talked about today is posted on GitHub as a patch: github.com/miklert/zabbix The patch includes:
- full integration with Clickhouse (both Zabbix server and frontend);
- solving problems with the preprocessor manager;
- asynchronous polling.
The patch is compatible with all version 4, including lts. Most likely, with minimal changes, it will work on version 3.4.Thank you for the attention.Questions
Question from the audience (hereinafter - A): - Good afternoon! Please tell me, do you have plans for intensive interaction with the Zabbix team or do they have with you so that this is not a patch, but the normal behavior of Zabbix?MM: - Yes, we will certainly commit part of the changes. Something will be, something will remain in the patch.A: - Thank you very much for the excellent report! Tell me, please, after applying the patch, the support from the side of Zabbix will remain and how to continue to upgrade to higher versions? Will it be possible to update Zabbix after your patch to 4.2, 5.0?MM:- I can’t say about support. If I were Zabbix's tech support, I would probably say no, because this is someone else's code. As for the code base 4.2, our position is this: "We will go with time, and we will be updated on the next version." Therefore, for some time we will upload the patch to updated versions. I already said in the report: the number of changes with the versions is still quite small. I think the transition from 3.4 to 4 took us, it seems, about 15 minutes. Something has changed there, but not very important.A: - So you plan to maintain your patch and you can safely put it on production, in the future getting updates in some way?MM: - We strongly recommend it. This solves a lot of problems for us.MCH:- Once again, I would like to emphasize that changes that do not relate to architecture and do not relate to locks, queues - they are modular, they are in separate modules. Even on their own with minor changes, they can be maintained quite easily.MM: - If the details are interesting, then “Clickhouse” uses the so-called history library. It is untied - this is a copy of the support of Elastic, that is, it is configurable. Polling only changes pollers. We believe that this will work for a long time.A: - Thank you very much. But tell me, is there any documentation of the changes made?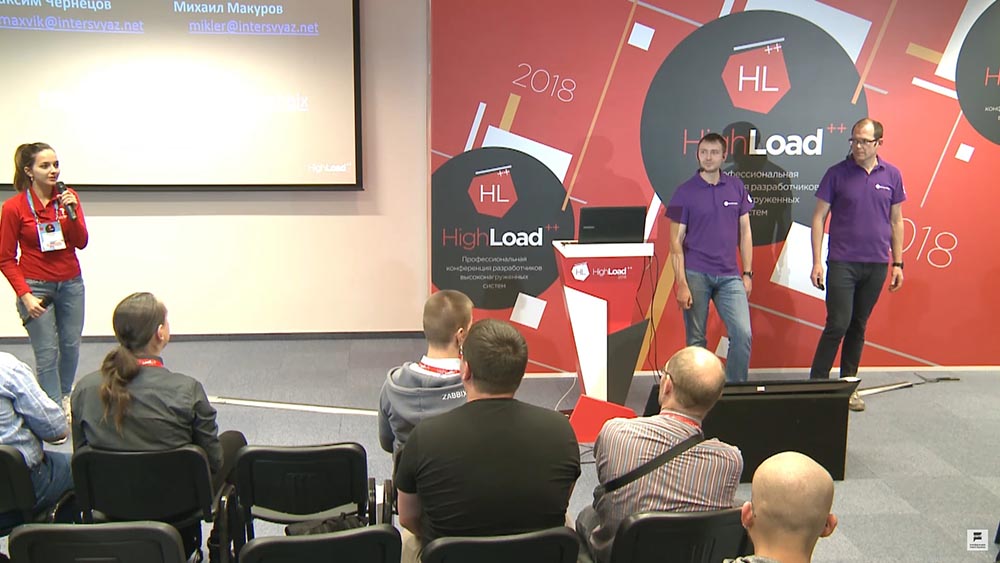 MM:- Documentation is a patch. Obviously, with the introduction of “Clickhouse,” with the introduction of new types of pollers, new configuration options arise. The link from the last slide has a short description of how to use it.
About replacing fping with nmap
A: - How did you eventually implement this? Can you give specific examples: is it your strappers and an external script? What eventually checks out so many hosts so quickly? How do you get these hosts? Do nmap need to somehow feed them, get them from somewhere, put them in, start something? ..MM:- Cool. Very correct question! The point is this. We modified the library (ICMP ping, part of Zabbix) for ICMP checks, which indicate the number of packets - unit (1), and the code tries to use nmap. That is, this is the internal work of Zabbix, it has become the internal work of the pinger. Accordingly, no synchronization or use of a trapper is required. This was done deliberately in order to leave the system coherent and not engage in the synchronization of two base systems: what to check, fill in through the poller, and if the fill has broken in us? .. This is much simpler.A: - Does it work for a proxy too?MM: - Yes, but we did not check. The polling code is the same in both Zabbix and the server. Should work. I emphasize again: the system performance is such that we do not need a proxy.MCH: - The correct answer to the question is: “Why do you need a proxy with such a system?” Only because of NAT'a or to monitor through a slow channel some ...A: - And you use Zabbix as an allergen, if I understand correctly. Or the graphics (where is the archive layer) you left for another system, such as Grafana? Or are you not using this functionality?MM: - I will emphasize once again: we have made full integration. We pour history into “Clickhouse”, but at the same time changed the php frontend. Php-frontend goes to “Clickhouse” and does all the graphics from there. At the same time, to be honest, we have a part that builds from the same “Clickhouse”, from the same Zabbix data, data in other graphic display systems.MCH: - In "Grafan" as well.How was the decision to allocate resources made?
A: - Share a little inner kitchen. How was the decision made that resources should be allocated for serious product processing? These are, in general, certain risks. And please tell me, in the context of the fact that you are going to support new versions: how is this decision justified from a management point of view?MM: - Apparently, we did not tell the drama of the story very well. We found ourselves in a situation where something had to be done, and went essentially two parallel commands:- One was engaged in launching a monitoring system using new methods: monitoring as a service, a standard set of open source solutions that we combine and then try to change the business process in order to work with the new monitoring system.
- In parallel, we had an enthusiastic programmer who was doing this (about himself). It so happened that he won.
A: - And what is the size of the team?MCH: - She is in front of you.A: - That is, as always, a passionary is needed?MM: - I do not know what a passionarian is.A: - In this case, apparently, you. Thank you very much, you are cool.MM: - Thank you.About patches for Zabbix
A: - For a system that uses proxies (for example, in some distributed systems), is it possible for your decision to adapt and patch, say, pollers, proxies and partially the preprocessor of Zabbix itself; and their interaction? Is it possible to optimize existing developments for a system with multiple proxies?MM: - I know that the Zabbix server is assembled using a proxy (it compiles and the code is obtained). We did not test this in the product. I am not sure about this, but, in my opinion, the preprocessor manager is not used in the proxy. The proxy’s task is to take a set of metrics from Zabbix, fill them in (it also writes the configuration, local database) and return it to the Zabbix server. Then the server itself will do the preprocessing when it receives it.Interest in proxies is understandable. We will verify this. This is an interesting topic.A: - The idea was this: if you can patch pollers, they can be patched to proxies and patch interaction with the server, and the preprocessor can be adapted for these purposes only on the server.MM: - I think everything is even simpler. You take the code, apply the patch, then configure it as you need - collect the proxy servers (for example, with ODBC) and distribute the patched code to the systems. Where necessary - collect proxies, where necessary - server.A: - In addition, you won’t have to patch the proxy transmission to the server, most likely?MCH: - No, it's standard.MM:- Actually, one of the ideas did not sound. We always maintained a balance between an explosion of ideas and the number of changes, the ease of support.A bit of advertising :)
Thank you for staying with us. Do you like our articles? Want to see more interesting materials? Support us by placing an order or recommending to your friends, cloud VPS for developers from $ 4.99 , a unique analog of entry-level servers that was invented by us for you: The whole truth about VPS (KVM) E5-2697 v3 (6 Cores) 10GB DDR4 480GB SSD 1Gbps from $ 19 or how to divide the server? (options are available with RAID1 and RAID10, up to 24 cores and up to 40GB DDR4).Dell R730xd 2 times cheaper at the Equinix Tier IV data center in Amsterdam? Only we have 2 x Intel TetraDeca-Core Xeon 2x E5-2697v3 2.6GHz 14C 64GB DDR4 4x960GB SSD 1Gbps 100 TV from $ 199 in the Netherlands!Dell R420 - 2x E5-2430 2.2Ghz 6C 128GB DDR3 2x960GB SSD 1Gbps 100TB - from $ 99! Read about How to Build Infrastructure class c using Dell R730xd E5-2650 v4 servers costing 9,000 euros for a penny? Source: https://habr.com/ru/post/undefined/
All Articles