At the beginning of my study of Docker and Kubernetes, I lacked a simple and understandable example with which I could “play around” while studying the features of this environment. I would like to close this gap with this article. Here I will talk about integrating .NET Core applications with Telegraf and Grafana, how metrics are sent and how to deploy to Docker and Kubernetes. The examples in the article are intended for those who begin to study this area, but it is desirable to have basic concepts in order to fully understand the article. It describes how to deploy a container that has StatsD, InfluxDB and Grafana, as well as how to send metrics of various types from the application.The examples in this article were run on Kubernetes coming with Docker for Windows. But if you have Windows Home Edition, then you will not be able to install it. If you have Windows Professional, then there should be no problems. There are a couple of tips for installing kubernetes on Windows. Everything should work fine on Linux, tested on Ubuntu, 18.04 LTS.
Demonstration
First, let's see how everything I talk about looks in action. In this example, you run two applications: one sends requests to the other, the second performs some difficult task, and both applications send some StatsD metrics, which you will see in Grafana. Before completing the steps described here, you need to make sure that Kubernetes is installed on your computer. Then simply follow the instructions below and you will see some result. True, you will need to perform some settings yourself.$ git clone https://github.com/xtrmstep/DockerNetSample
$ cd .\DockerNetSample\
$ kubectl apply -f .\src\StatsDServer\k8s-deployment.yaml
$ .\build.ps1
$ .\run.ps1
Now in the browser you can download the localhost URL : 3003 and, using the root / root credentials , you can access the Grafana interface. Metrics are already submitted, and you can try adding your dashboard. After some tweaking, you can get something like this.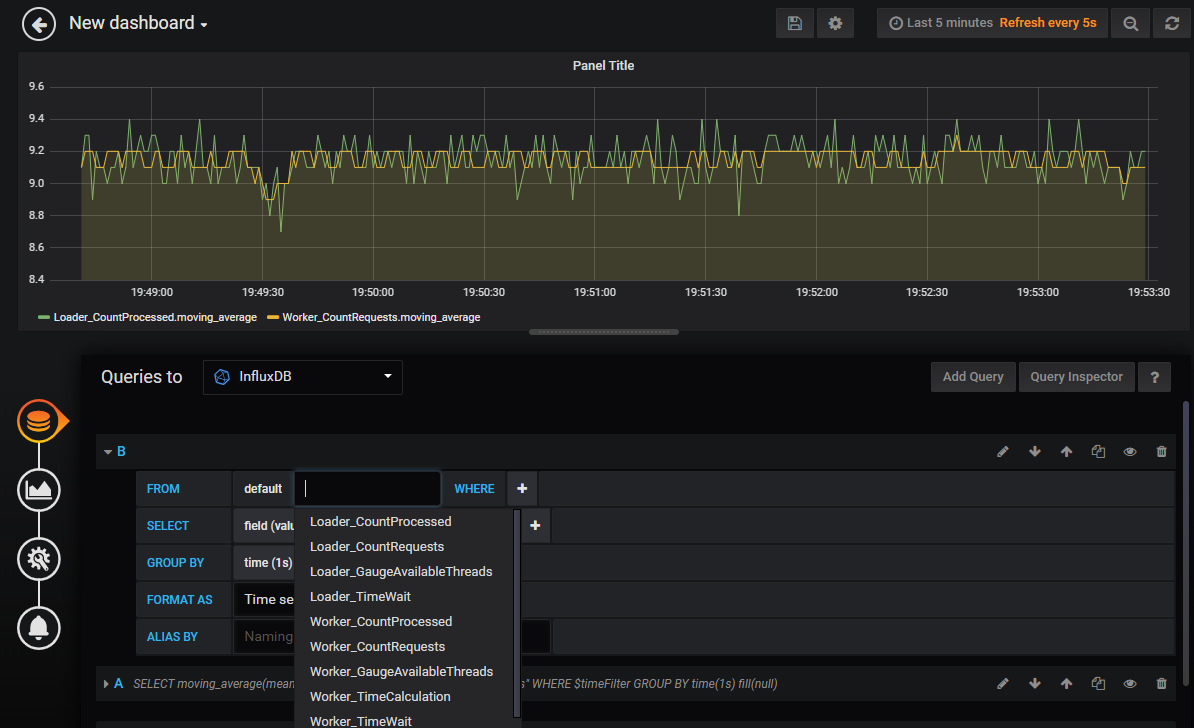 When you decide to stop everything and clear the resources, just close the two windows with the workflows and run the following commands that will clear the objects in Kubernetes:
$ kubectl delete svc stats-tcp
$ kubectl delete svc stats-udp
$ kubectl delete deployment stats
Now let's talk what happened.You deployed StatsD, InfluxDb, and Grafana to local Kubernetes
Not so long ago I discovered that DockerHub has many useful and already prepared images. In my example, I use one of these. You can find the repository with the image here . This image contains InfluxDB, Telegraf (StatsD), and Grafana, which are already configured to work together. There are two common ways to deploy images: the first is using docker-compose in Docker, and the second is deploying on Kubernetes. Both methods make it possible to deploy several components (images) at once, describe network settings and other parameters. I’ll briefly talk about docker-compose, but dwell on the deployment in Kubernetes in more detail. By the way, recently it became possible to deploy docker-compose in Kubernetes .Deploy with Docker-Compose
Docker-compose is distributed with Docker for Windows. But you need to check which version you can use in your YAML. To do this, you need to find out the version of the installed Docker and find the desired version from the compatibility matrix . I installed Docker version 19.03.5 , so I can use the version 3.x file . But I will use 2 for compatibility with previous versions of Docker. All the necessary information for writing docker-compose files is already in the repository description: image name and ports.version: '2'
services:
stats:
image: samuelebistoletti/docker-statsd-influxdb-grafana:latest
ports:
- "3003:3003"
- "3004:8888"
- "8086:8086"
- "8125:8125/udp"
In the ports section, I make visible the ports from the container through the ports of the host system. If I do not, I will not be able to access the resources in the container from the host system, because they will only be visible inside Docker. Roughly speaking, I cannot load Grafana in the browser. You can read more about port mapping here . After compiling the file, you can deploy it. By default, docker-compose looks for the docker-compose.yaml file in the current folder, so you can run it with minimal parameters by simply running the docker-compose up command . This will expand the container in Docker. I will use additional parameters to explicitly specify the file and start the container in the background.$ docker-compose -f docker-compose.yaml up -d
$ docker-compose stop
Kubernetes Deployment
At first glance, deploying to Kubernetes looks a bit more complicated as you need to define Deployment, Service, and other parameters. I resort to a little trick that saves me time writing YAML files for Kubernetes. First, I deploy everything in a minimal configuration to the cluster using kubectl . And then I export the objects I need, like YAML and only then I add the necessary settings.A note on Kubernetes installed on virtual machines in GCP
I tried to use Kubernetes, which is deployed on the Compute Engine in GCP and ran into a problem while deploying the LoadBalancer service. It remains in the pending state and does not receive an external IP address. This circumstance prevents access to the service from the Internet, even if you have configured the network. To do this, there is a solution that requires the installation of an ingress service and the use of NodePort, according to advice on Stackoverflow .
Deploy with kubectl
So, let's create a deployment from an image. The name stats is the deployment name that I myself gave for this object. You can use a different name.$ kubectl run stats --image=samuelebistoletti/docker-statsd-influxdb-grafana:latest --image-pull-policy=Always
This command will create Deployment, which in turn will create Pod and ReplicaSet in k8s. To get access to Grafana, I need to create a service and set up ports. This can be done using the NodePort service or the LoadBalancer. In most cases, you will create LoadBlancer services. Read more about this here .$ kubectl expose deployment stats --type=LoadBalancer --port=3003 --target-port=3003
This command will also map the host port 3003 ( --port ) to the port in the container ( --target-port ). After executing the command, you can access Grafana by loading the localhost : 3003 URL in the browser. You can check created objects in k8s with this command:$ kubectl get all
You should see something like this picture: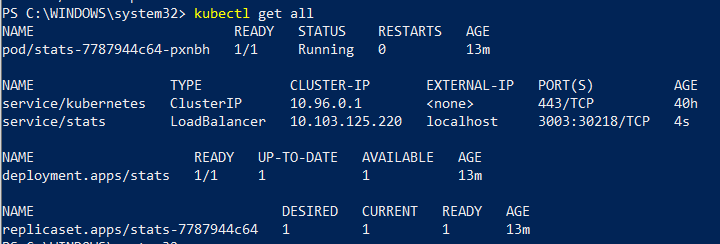
Export YAML configuration
At the moment, the deployed system is not yet what I need, but I can use it as a draft. Export the YAML configuration:$ kubectl get deployment,service stats -o yaml --export > exported.yaml
The exported file will contain the Deployment and Service definitions with the current configuration. I will need to remove unnecessary settings and add port mapping. The final minimalist version might look like this:apiVersion: extensions/v1beta1
kind: Deployment
metadata:
name: stats
spec:
replicas: 1
selector:
matchLabels:
run: stats
template:
metadata:
labels:
run: stats
spec:
containers:
- image: samuelebistoletti/docker-statsd-influxdb-grafana:latest
imagePullPolicy: Always
name: stats
---
apiVersion: v1
kind: Service
metadata:
name: stats-tcp
spec:
type: LoadBalancer
ports:
- name: grafana
protocol: TCP
port: 3003
targetPort: 3003
- name: influxdb-admin
protocol: TCP
port: 3004
targetPort: 8888
- name: influxdb
protocol: TCP
port: 8086
targetPort: 8086
selector:
run: stats
---
apiVersion: v1
kind: Service
metadata:
name: stats-udp
spec:
type: LoadBalancer
ports:
- name: telegraf
protocol: UDP
port: 8125
targetPort: 8125
selector:
run: stats
Note on using TCP / UDP protocols
You cannot create a service such as LoadBalancer that supports TCP and UDP. This is a known limitation, and the community is trying to find some solution . Meanwhile, you can create two separate services for each type of protocol.
Before using the new file, clear the existing resources in Kubernetes, and then use the kubectl apply command .$ kubectl delete svc stats
$ kubectl delete deployment stats
$ kubectl apply -f k8s-deployment.yaml
You have just deployed an image in Kubernetes with the correct port settings. Using the URL mentioned above, you can open Grafana, but now you can still send StatsD metrics. In the next section I will talk a little about metrics.StatsD Protocol
The StatsD protocol is very simple, you can even create your own client library if you really need it. Here you can read more about StatsD datagrams. This protocol supports metrics such as counters, time, timing, gauge, etc.counter.name:1|c
timing.name:320|ms
gauge.name:333|g
Counters are used to count the number of some events. Usually, you just always increment some counter (bucket in StatsD). Aggregation is done at a lower level, so when you get the value in seconds, minutes, you do not have to do additional calculations, and in Grafana you will see the number in seconds, minutes and so on, as you wish.Timing is used to measure the duration of a process. For example, this metric is just perfect for measuring the duration of a web request.Gauge is used to measure some current state of a resource. For example, the amount of available memory or the number of free threads.Metrics in the .NET Core Service
You will need the NuGet JustEat.StatsD package . It has a good description on github. So, just follow his instructions to make your own configuration and register with IoC.As an example, let's take the API, where some method, when called, queues threads using ThreadPool. The API logic allows only a certain number of parallel computations. Let's say you want to know the following about your service:- How many requests are coming?
- How many requests are waiting before ThreadPool issues a thread?
- How long does the operation take?
- How fast do free threads end in the API?
Here's what metrics collection might look like in code:public override async Task<FactorialReply> Factorial(FactorialRequest request, ServerCallContext context)
{
ThreadPool.GetAvailableThreads(out var availableThreads, out _);
_stats.Gauge(availableThreads, "GaugeAvailableThreads");
_stats.Increment("CountRequests");
await _stats.Time("TimeWait", async f => await _semaphoreSlim.WaitAsync());
try
{
var result = await _stats.Time("TimeCalculation", async t => await CalculateFactorialAsync(request.Factor));
_stats.Increment("CountProcessed");
return await Task.FromResult(new FactorialReply
{
Result = result
});
}
finally
{
_semaphoreSlim.Release();
}
}
In the code, the number of simultaneous calculations is controlled by the SemaphoreSlim class. If the number of parallel executions exceeds the maximum, it will stop execution and will wait for the completion of some other thread.