Hallo alle zusammen. Im Mai startet OTUS einen Workshop zur Überwachung und Protokollierung von Infrastruktur und Anwendungen mit Zabbix, Prometheus, Grafana und ELK. In diesem Zusammenhang teilen wir traditionell nützliches Material zu diesem Thema.
Mit dem Blackbox-Exporter für Prometheus können Sie externe Dienste über HTTP, HTTPS, DNS, TCP und ICMP überwachen. In diesem Artikel werde ich Ihnen zeigen, wie Sie die HTTP / HTTPS-Überwachung mit dem Blackbox-Exporter konfigurieren. Wir werden den Blackbox-Exporteur in Kubernetes starten.Umgebung
Wir werden folgendes brauchen:- Kubernetes
- Prometheus-Betreiber
Blackbox-Exporter-Konfiguration
Wir konfigurieren Blackbox durch ConfigMap, um httpdas Webdienst-Überwachungsmodul zu konfigurieren .apiVersion: v1
kind: ConfigMap
metadata:
name: prometheus-blackbox-exporter
labels:
app: prometheus-blackbox-exporter
data:
blackbox.yaml: |
modules:
http_2xx:
http:
no_follow_redirects: false
preferred_ip_protocol: ip4
valid_http_versions:
- HTTP/1.1
- HTTP/2
valid_status_codes: []
prober: http
timeout: 5s
Das Modul wird http_2xxverwendet, um zu überprüfen, ob der Webdienst einen HTTP 2xx-Statuscode zurückgibt. Die Konfiguration des Blackbox-Exporters wird in der Dokumentation ausführlicher beschrieben .Stellen Sie den Blackbox-Exporter im Kubernetes-Cluster bereit
Beschreiben Deploymentund Servicefür die Bereitstellung in Kubernetes.---
kind: Service
apiVersion: v1
metadata:
name: prometheus-blackbox-exporter
labels:
app: prometheus-blackbox-exporter
spec:
type: ClusterIP
ports:
- name: http
port: 9115
protocol: TCP
selector:
app: prometheus-blackbox-exporter
---
apiVersion: apps/v1
kind: Deployment
metadata:
name: prometheus-blackbox-exporter
labels:
app: prometheus-blackbox-exporter
spec:
replicas: 1
selector:
matchLabels:
app: prometheus-blackbox-exporter
template:
metadata:
labels:
app: prometheus-blackbox-exporter
spec:
restartPolicy: Always
containers:
- name: blackbox-exporter
image: "prom/blackbox-exporter:v0.15.1"
imagePullPolicy: IfNotPresent
securityContext:
readOnlyRootFilesystem: true
runAsNonRoot: true
runAsUser: 1000
args:
- "--config.file=/config/blackbox.yaml"
resources:
{}
ports:
- containerPort: 9115
name: http
livenessProbe:
httpGet:
path: /health
port: http
readinessProbe:
httpGet:
path: /health
port: http
volumeMounts:
- mountPath: /config
name: config
- name: configmap-reload
image: "jimmidyson/configmap-reload:v0.2.2"
imagePullPolicy: "IfNotPresent"
securityContext:
runAsNonRoot: true
runAsUser: 65534
args:
- --volume-dir=/etc/config
- --webhook-url=http:
resources:
{}
volumeMounts:
- mountPath: /etc/config
name: config
readOnly: true
volumes:
- name: config
configMap:
name: prometheus-blackbox-exporter
Der Blackbox-Exporter kann mit dem folgenden Befehl bereitgestellt werden. Der Namespace monitoringbezieht sich auf den Prometheus-Operator.kubectl --namespace=monitoring apply -f blackbox-exporter.yaml
Stellen Sie mit dem folgenden Befehl sicher, dass alle Dienste ausgeführt werden:kubectl --namespace=monitoring get all --selector=app=prometheus-blackbox-exporter
Überprüfen Sie die Blackbox
Sie können auf die Exporter Blackbox-Weboberfläche zugreifen mit port-forward:kubectl --namespace=monitoring port-forward svc/prometheus-blackbox-exporter 9115:9115
Stellen Sie über einen Webbrowser unter localhost : 9115 eine Verbindung zur Blackbox-Weboberfläche des Exporteurs her .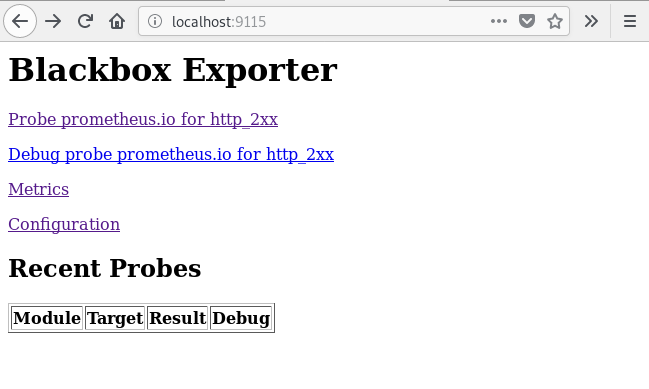 Wenn Sie zur Adresse http: // localhost: 9115 / probe? Module = http_2xx & target = https: //www.google.com gehen , wird das Ergebnis der Überprüfung der angegebenen URL ( https://www.google.com ) angezeigt .
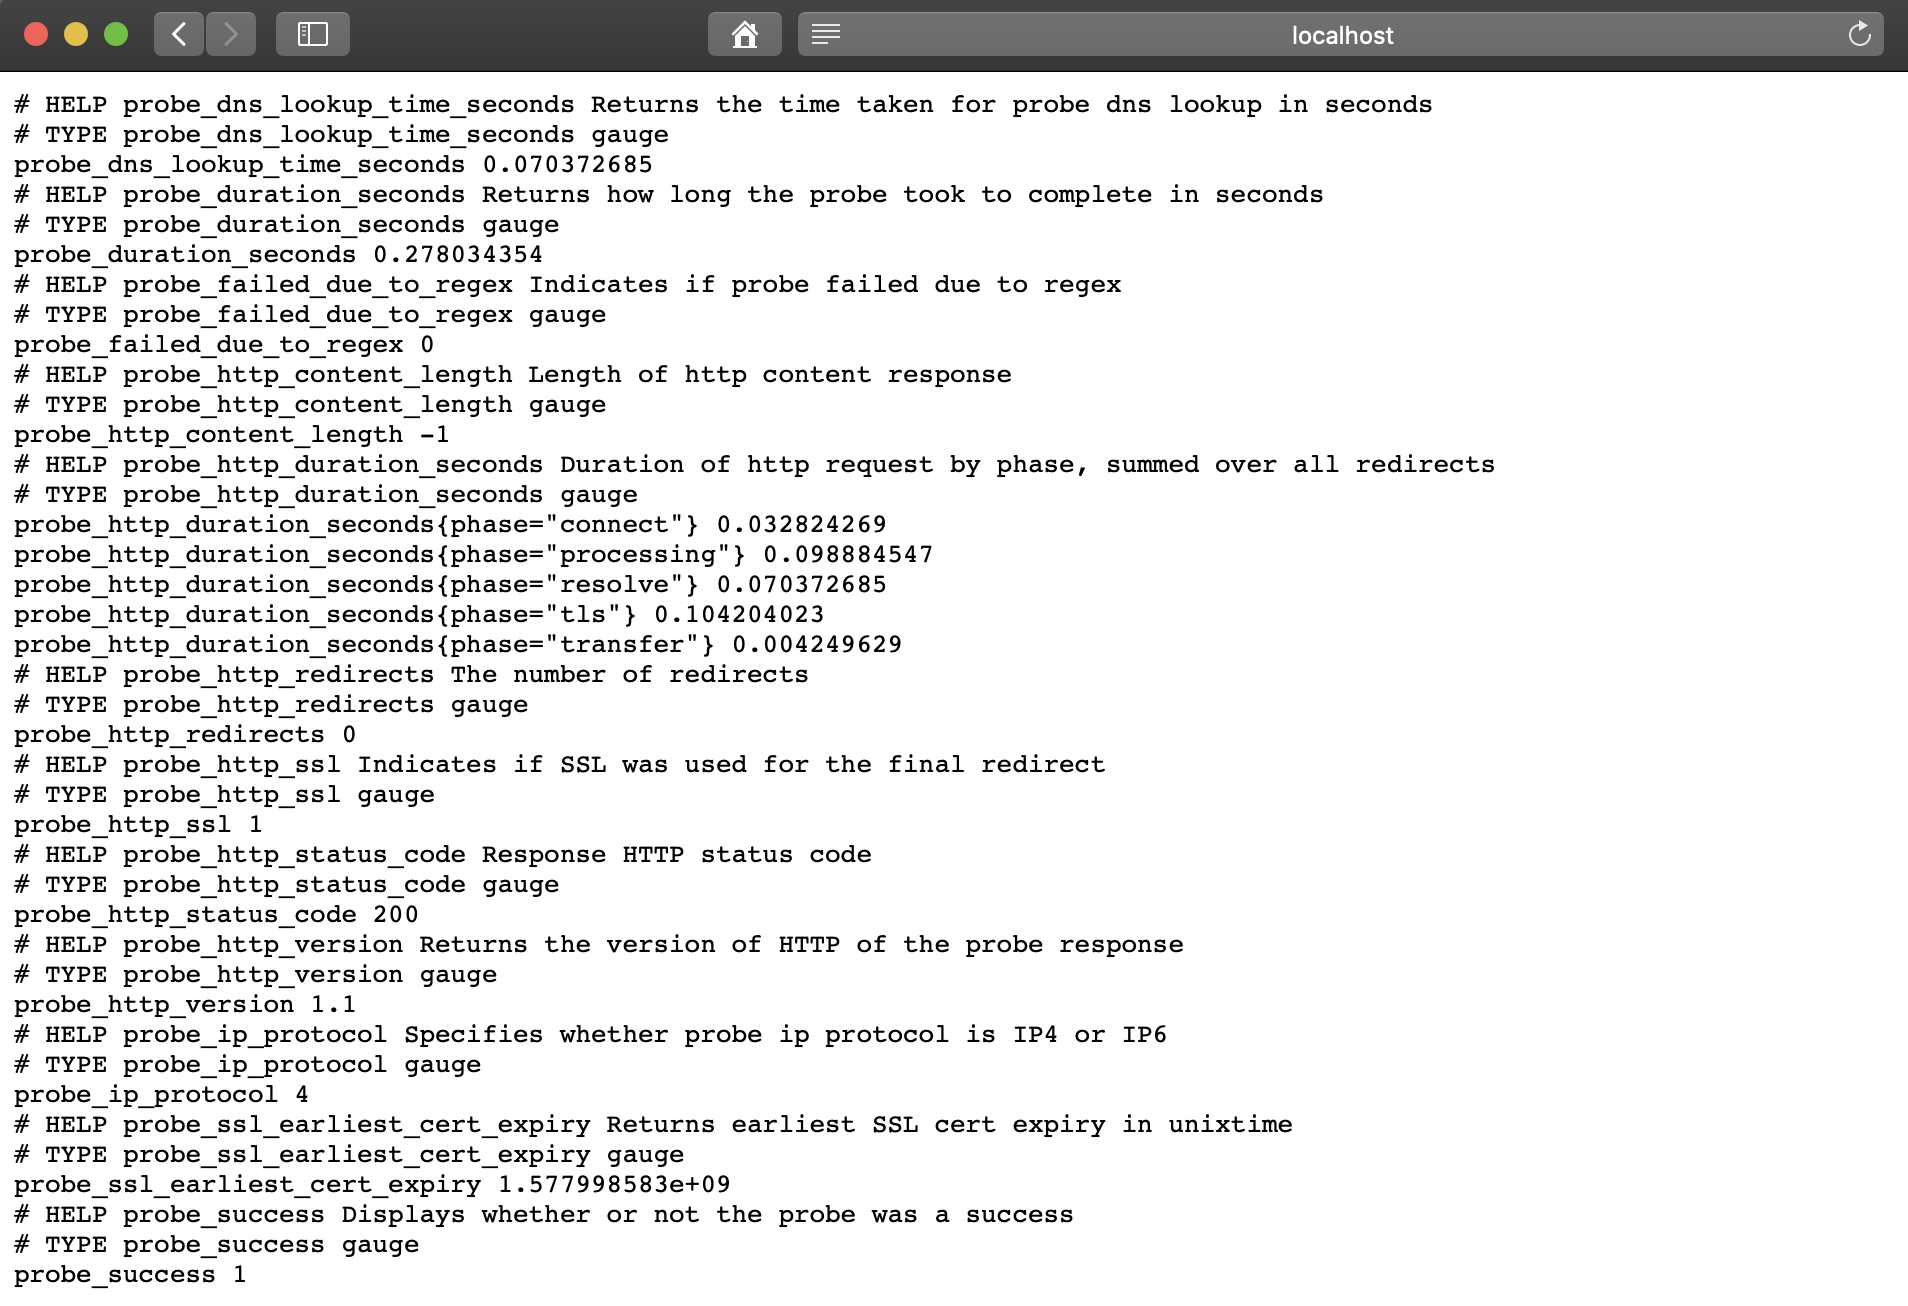 Ein metrischer
 probe_successWert von 1 bedeutet eine erfolgreiche Prüfung. Ein Wert von 0 zeigt einen Fehler an.Prometheus einrichten
Konfigurieren Sie Prometheus nach der Bereitstellung des BlackBox-Exporters prometheus-additional.yaml.- job_name: 'kube-api-blackbox'
scrape_interval: 1w
metrics_path: /probe
params:
module: [http_2xx]
static_configs:
- targets:
- https:
- http:
- https:
relabel_configs:
- source_labels: [__address__]
target_label: __param_target
- source_labels: [__param_target]
target_label: instance
- target_label: __address__
replacement: prometheus-blackbox-exporter:9115 # The blackbox exporter.
Generieren Sie Secretmit dem folgenden Befehl.PROMETHEUS_ADD_CONFIG=$(cat prometheus-additional.yaml | base64)
cat << EOF | kubectl --namespace=monitoring apply -f -
apiVersion: v1
kind: Secret
metadata:
name: additional-scrape-configs
type: Opaque
data:
prometheus-additional.yaml: $PROMETHEUS_ADD_CONFIG
EOF
Geben Sie additional-scrape-configsfür den Prometheus-Operator Folgendes an additionalScrapeConfigs.kubectl --namespace=monitoring edit prometheuses k8s
...
spec:
additionalScrapeConfigs:
key: prometheus-additional.yaml
name: additional-scrape-configs
Wir gehen in die Prometheus-Weboberfläche, überprüfen Metriken und Ziele.kubectl --namespace=monitoring port-forward svc/prometheus-k8s 9090:9090
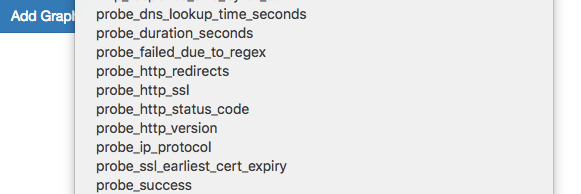
 Wir sehen die Metriken und Ziele der Blackbox.
Hinzufügen von Regeln für Benachrichtigungen (Warnung)
Fügen Sie dem Prometheus-Operator die Regeln hinzu, um Benachrichtigungen vom Blackbox-Exporter zu erhalten.kubectl --namespace=monitoring edit prometheusrules prometheus-k8s-rules
...
- name: blackbox-exporter
rules:
- alert: ProbeFailed
expr: probe_success == 0
for: 5m
labels:
severity: error
annotations:
summary: "Probe failed (instance {{ $labels.instance }})"
description: "Probe failed\n VALUE = {{ $value }}\n LABELS: {{ $labels }}"
- alert: SlowProbe
expr: avg_over_time(probe_duration_seconds[1m]) > 1
for: 5m
labels:
severity: warning
annotations:
summary: "Slow probe (instance {{ $labels.instance }})"
description: "Blackbox probe took more than 1s to complete\n VALUE = {{ $value }}\n LABELS: {{ $labels }}"
- alert: HttpStatusCode
expr: probe_http_status_code <= 199 OR probe_http_status_code >= 400
for: 5m
labels:
severity: error
annotations:
summary: "HTTP Status Code (instance {{ $labels.instance }})"
description: "HTTP status code is not 200-399\n VALUE = {{ $value }}\n LABELS: {{ $labels }}"
- alert: SslCertificateWillExpireSoon
expr: probe_ssl_earliest_cert_expiry - time() < 86400 * 30
for: 5m
labels:
severity: warning
annotations:
summary: "SSL certificate will expire soon (instance {{ $labels.instance }})"
description: "SSL certificate expires in 30 days\n VALUE = {{ $value }}\n LABELS: {{ $labels }}"
- alert: SslCertificateHasExpired
expr: probe_ssl_earliest_cert_expiry - time() <= 0
for: 5m
labels:
severity: error
annotations:
summary: "SSL certificate has expired (instance {{ $labels.instance }})"
description: "SSL certificate has expired already\n VALUE = {{ $value }}\n LABELS: {{ $labels }}"
- alert: HttpSlowRequests
expr: avg_over_time(probe_http_duration_seconds[1m]) > 1
for: 5m
labels:
severity: warning
annotations:
summary: "HTTP slow requests (instance {{ $labels.instance }})"
description: "HTTP request took more than 1s\n VALUE = {{ $value }}\n LABELS: {{ $labels }}"
- alert: SlowPing
expr: avg_over_time(probe_icmp_duration_seconds[1m]) > 1
for: 5m
labels:
severity: warning
annotations:
summary: "Slow ping (instance {{ $labels.instance }})"
description: "Blackbox ping took more than 1s\n VALUE = {{ $value }}\n LABELS: {{ $labels }}"
Gehen Sie in der Prometheus-Weboberfläche zu Status => Regeln und suchen Sie die Warnungsregeln für den Blackbox-Exporter.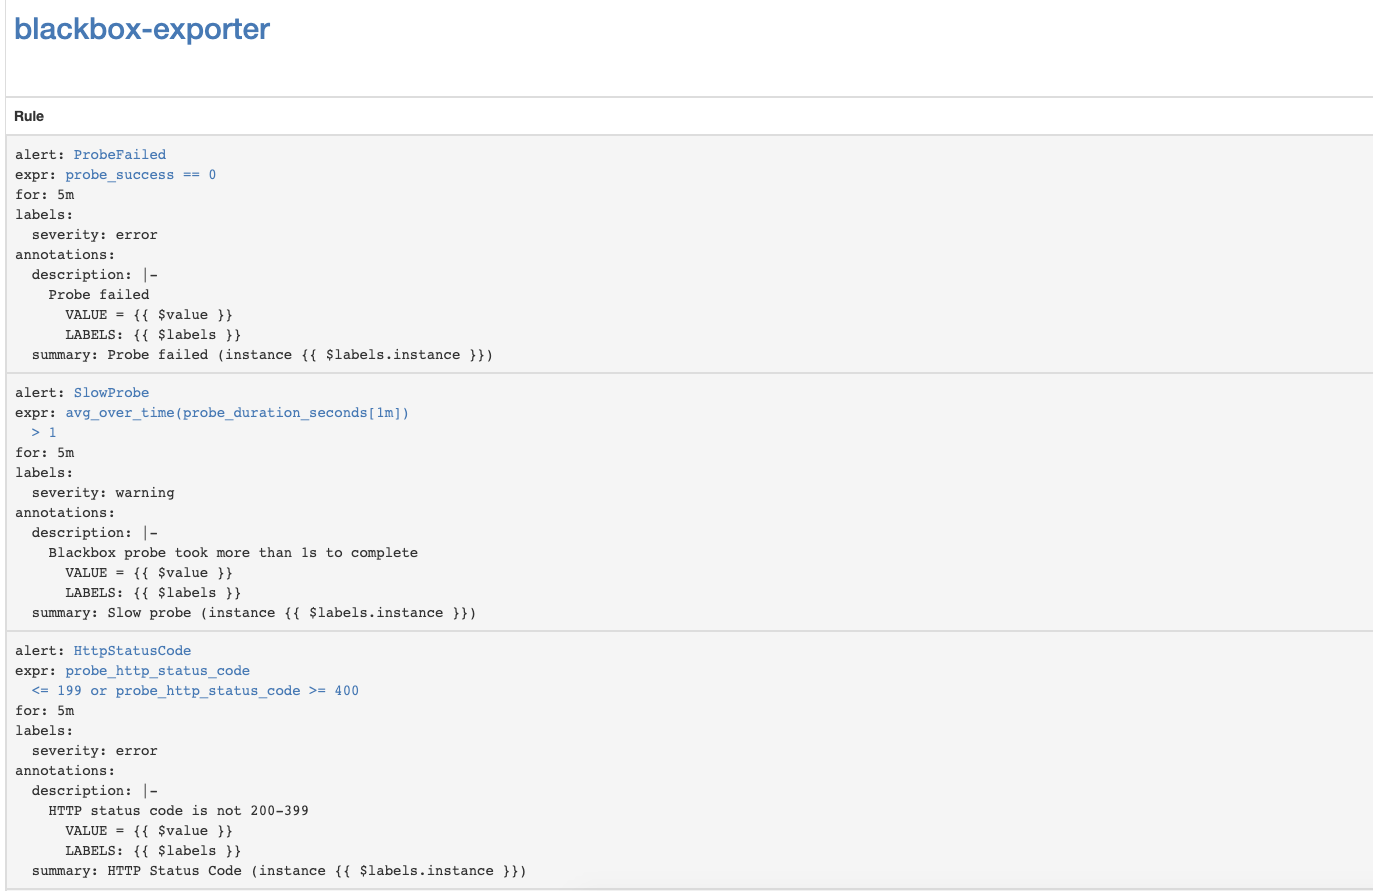
Konfigurieren Sie Kubernetes API Server SSL-Zertifikatablaufbenachrichtigungen
Lassen Sie uns die Überwachung des Ablaufs von Kubernetes API Server-SSL-Zertifikaten einrichten. Er wird einmal pro Woche Benachrichtigungen senden.Fügen Sie das Blackbox-Exporter-Modul für die Kubernetes API Server-Authentifizierung hinzu.kubectl --namespace=monitoring edit configmap prometheus-blackbox-exporter
...
kube-api:
http:
method: GET
no_follow_redirects: false
preferred_ip_protocol: ip4
tls_config:
insecure_skip_verify: false
ca_file: /var/run/secrets/kubernetes.io/serviceaccount/ca.crt
bearer_token_file: /var/run/secrets/kubernetes.io/serviceaccount/token
valid_http_versions:
- HTTP/1.1
- HTTP/2
valid_status_codes: []
prober: http
timeout: 5s
Hinzufügen der Prometheus-Kratzkonfiguration- job_name: 'kube-api-blackbox'
metrics_path: /probe
params:
module: [kube-api]
static_configs:
- targets:
- https:
relabel_configs:
- source_labels: [__address__]
target_label: __param_target
- source_labels: [__param_target]
target_label: instance
- target_label: __address__
replacement: prometheus-blackbox-exporter:9115 # The blackbox exporter.
Prometheus Secret anwendenPROMETHEUS_ADD_CONFIG=$(cat prometheus-additional.yaml | base64)
cat << EOF | kubectl --namespace=monitoring apply -f -
apiVersion: v1
kind: Secret
metadata:
name: additional-scrape-configs
type: Opaque
data:
prometheus-additional.yaml: $PROMETHEUS_ADD_CONFIG
EOF
Fügen Sie Warnregeln hinzukubectl --namespace=monitoring edit prometheusrules prometheus-k8s-rules
...
- name: k8s-api-server-cert-expiry
rules:
- alert: K8sAPIServerSSLCertExpiringAfterThreeMonths
expr: probe_ssl_earliest_cert_expiry{job="kube-api-blackbox"} - time() < 86400 * 90
for: 1w
labels:
severity: warning
annotations:
summary: "Kubernetes API Server SSL certificate will expire after three months (instance {{ $labels.instance }})"
description: "Kubernetes API Server SSL certificate expires in 90 days\n VALUE = {{ $value }}\n LABELS: {{ $labels }}"
Nützliche Links
Überwachung und Anmeldung in Docker